Most investors treat volatility as something to hide from. When uncertainty spikes, the instinct is to reach for safety, reduce exposure, and wait for calmer conditions. For one specific class of income strategy, that instinct has the logic exactly backwards.
Options-income strategies do not merely survive volatility. They feed on it. Rising uncertainty enlarges the premium an options writer collects, which means the macro conditions that make equity and bond investors uncomfortable can quietly expand the income opportunity.
Australia spent the past year delivering precisely that kind of environment. The Reserve Bank cut once in August 2025, then reversed into four rate increases through to September 2026, lifting the cash rate to 4.60%, a 15-year high. That sequence created the elevated-uncertainty conditions where options-income strategies are theoretically most productive.
The question this analysis answers is whether they actually delivered, and whether the macro tailwind that made FY26 productive is still in place. What you get here is a concrete framework for judging whether options-based income belongs in your portfolio given where Australian rates and volatility sit right now.
Why the RBA’s tightening cycle made option premiums richer
Start with the part most Australian investors already feel: rates have been climbing. The Reserve Bank cut the cash rate to 3.60% in August 2025, then changed direction entirely. Three consecutive 25 basis point hikes followed between February and May 2026, a pause held the rate through the middle of the year, and a fourth hike in September 2026 pushed it to 4.60%.
| Date | Decision | Rate Before | Rate After |
|---|---|---|---|
| 13 August 2025 | Cut | 3.85% | 3.60% |
| 4 February 2026 | Hike | 3.60% | 3.85% |
| 17-18 March 2026 | Hike | 3.85% | 4.10% |
| 6 May 2026 | Hike | 4.10% | 4.35% |
| 17 June 2026 | Hold | 4.35% | 4.35% |
| 12 August 2026 | Hold | 4.35% | 4.35% |
| 30 September 2026 | Hike | 4.35% | 4.60% |
The RBA’s own communications through the June and August 2026 holds referenced “three increases in the cash rate target since the beginning of the year,” and its May 2026 Statement on Monetary Policy assumed the rate could reach roughly 4.7% by year-end. That matters, because it signals the uncertainty had not resolved.
Here is the less obvious part: that uncertainty transmits directly into option premiums through three channels.
- Implied volatility. When macro risk rises, market participants demand more compensation for holding risk. That shows up as higher implied volatility, which lifts the premium an options writer receives for the same obligation. On the ASX, the S&P/ASX 200 volatility index (XVI), calculated from option prices, is the mechanism carrying this effect into premiums.
- Cost of carry. Higher risk-free rates change the theoretical pricing of options, particularly longer-dated contracts, because financing a position costs more.
- Hedging demand. When risks rise, institutions buy more protective puts and volatility hedges. That elevated demand pushes implied volatility, and premiums, higher across maturities.
Implied volatility is not a directional signal; it measures the market’s collective expectation of future price movement magnitude, and that distinction matters when evaluating whether current ASX option premiums reflect genuine risk or temporary macro noise.
The point worth holding onto is that this uplift is structural, not a one-off. Sustained policy uncertainty tends to keep premiums elevated across the options market rather than producing isolated spikes.
So the same tightening cycle that squeezed conventional income investors in FY26 was, in a measurable way, enlarging the income available to anyone writing options on the ASX. That tension is the thread the rest of this analysis follows.
When big ASX news breaks, our subscribers know first
How the income cycle actually works when markets move
An options-income strategy is always running one of two trades. It is never idle, and understanding this is the key to reading what a fund is actually doing.
- Covered calls: selling call options against stock the portfolio already owns. The writer collects a premium in exchange for agreeing to sell those shares at the strike price if the market rallies past it.
- Cash-secured puts: selling put options on stocks the portfolio wants to own, holding enough cash to buy them if assigned. The premium is compensation for accepting that downside commitment.
The strategy rotates between these two modes. In rising markets it writes calls against holdings. When those holdings get called away, it redeploys the proceeds into put-writing on target names. Monthly premium is the consistent output regardless of which mode it is in, and according to Fairway Capital Management, the fund collected net option premium in every month of FY26 despite the rate moves and sector rotation that defined the year.
This is where a common mental model breaks down. The stock count you see at any moment is a snapshot of the current phase, not a measure of activity.
Fairway held seven stock positions at the start of FY26 and just three at 30 June 2026. That drop is easy to misread as a strategy winding down. What it actually tells you is that call options were exercised during rallies, shares were sold at the strike, premium income was crystallised, and proceeds were rotated into fresh put-writing.
What the FY26 activity data reveals about strategy intensity
The trade data makes the point unmistakable. Across FY26, the fund wrote 202 option positions and executed 63 equity trades.
59 of 63 equity trades resulted from option assignment. The portfolio was not being hand-picked. It was being shaped by the options cycle itself.
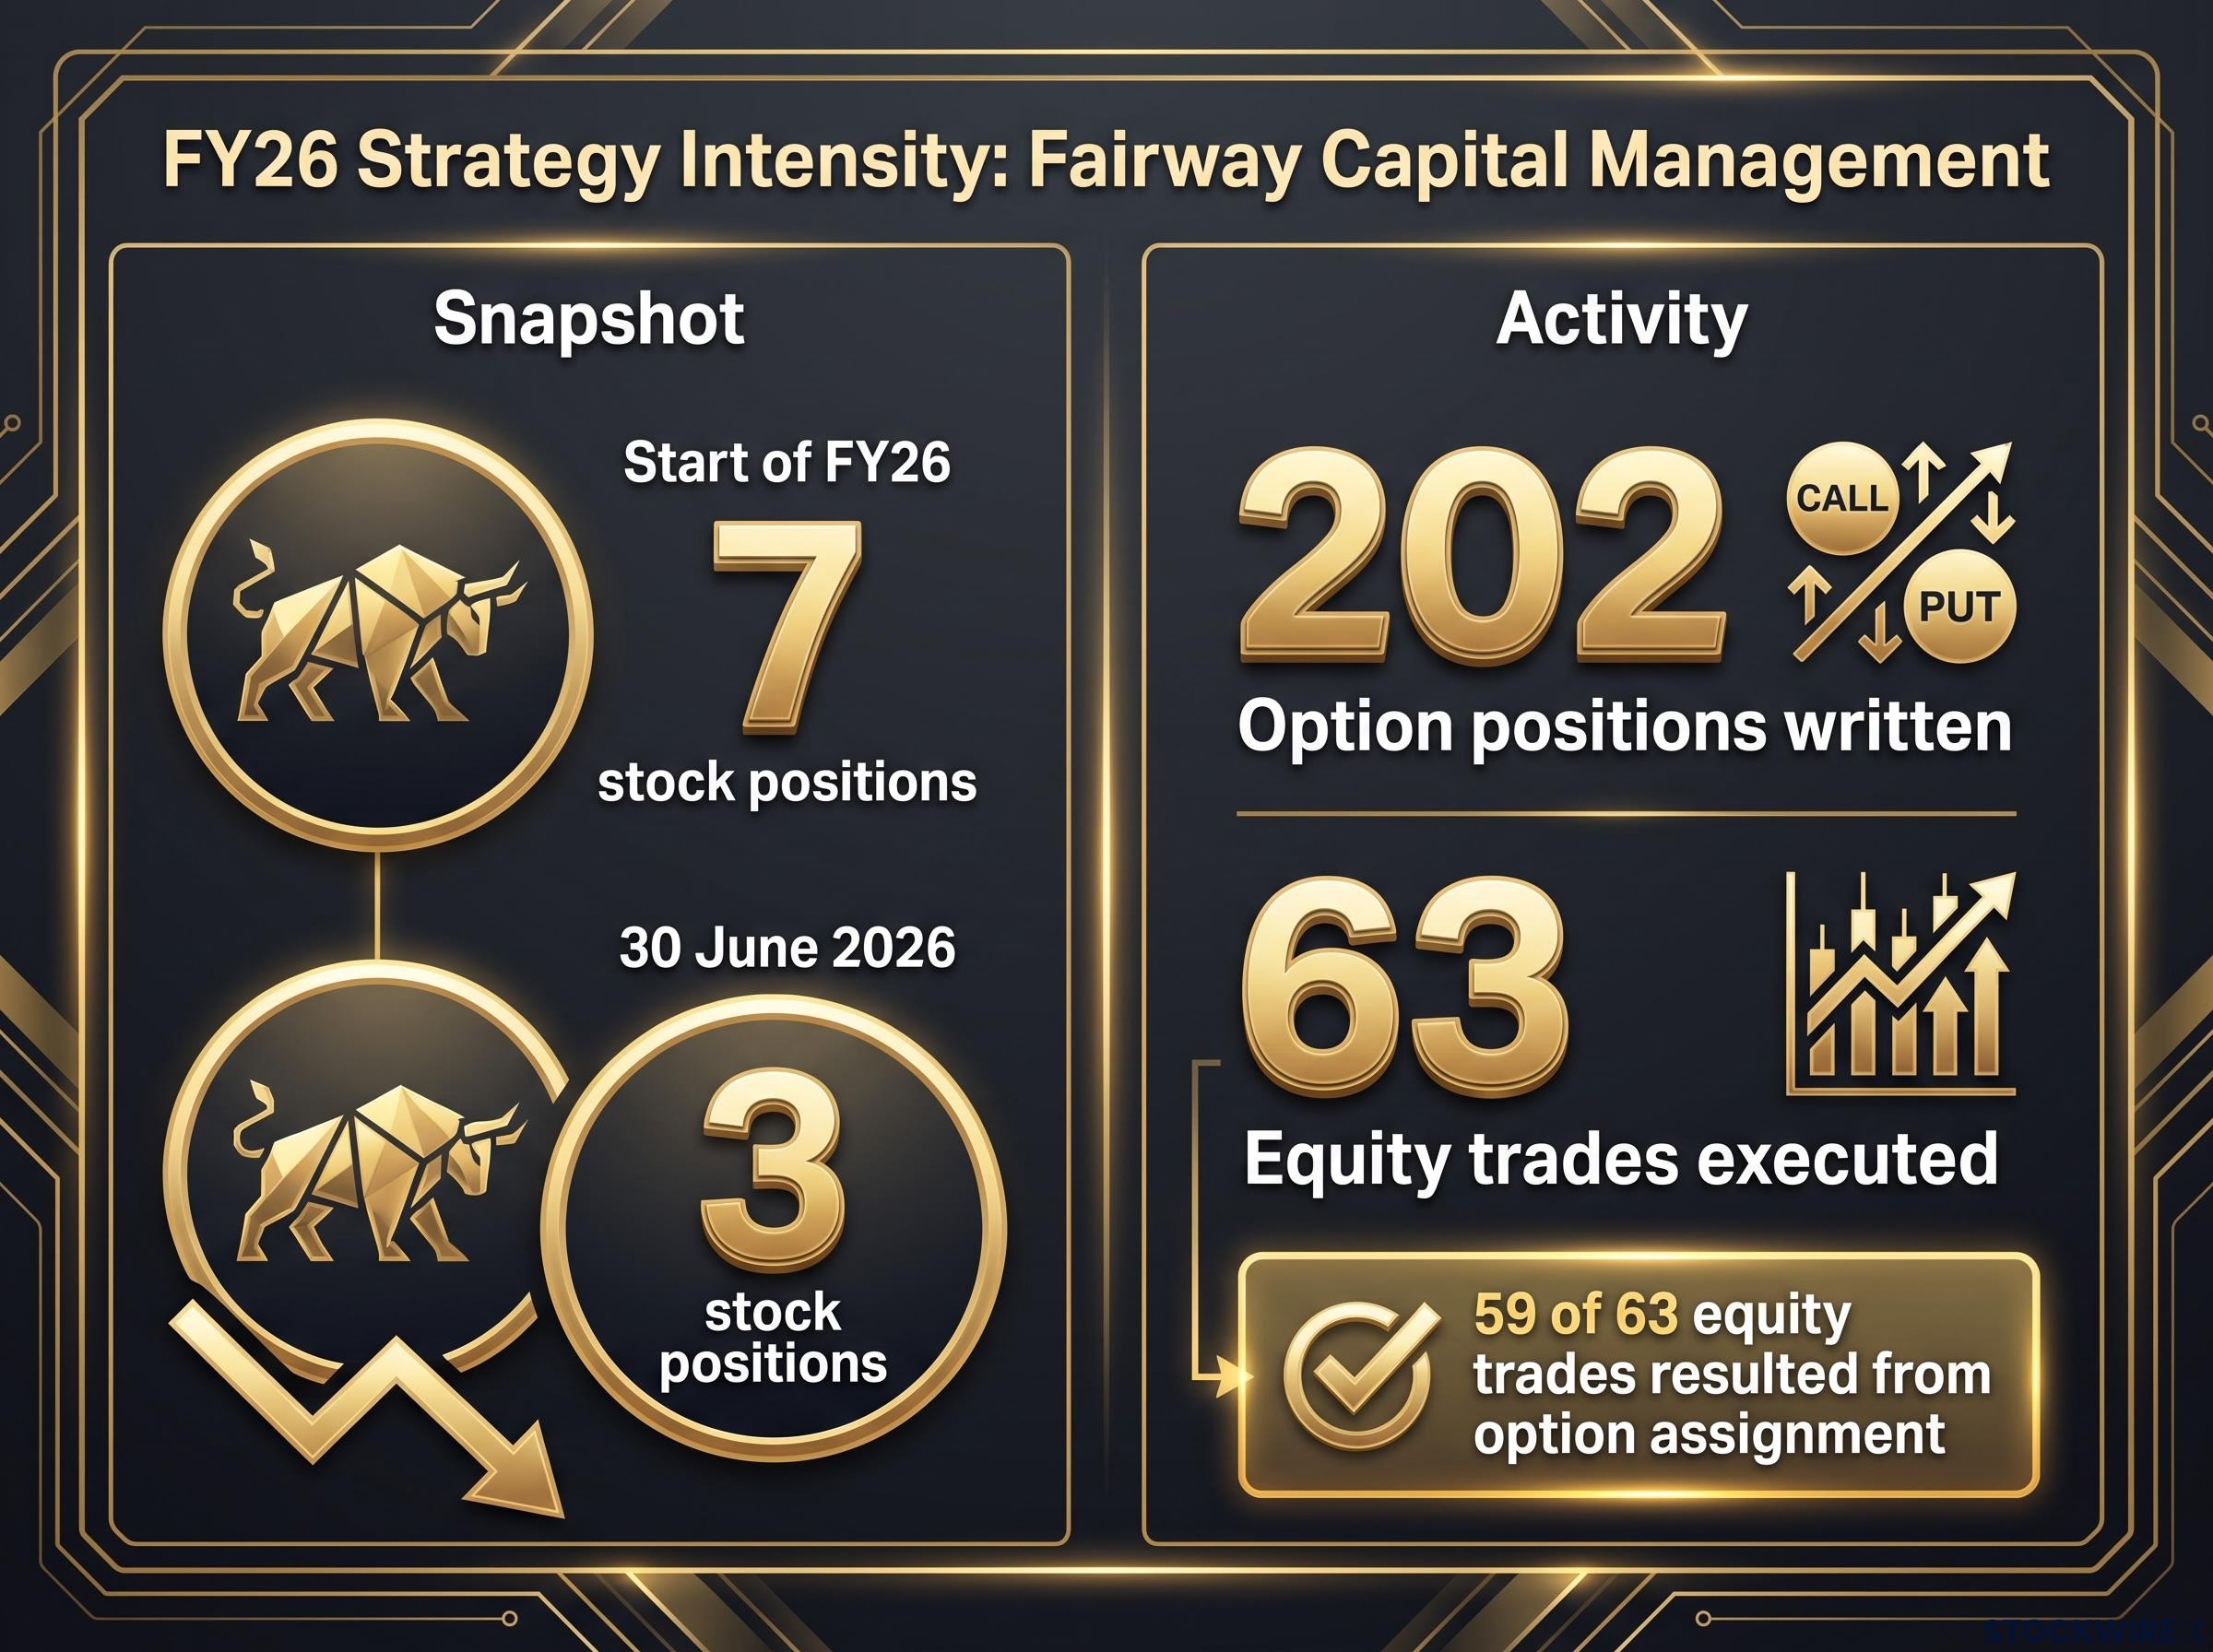
That ratio is the clearest evidence of how tightly integrated the strategy is. A visible holding count of three masks a high-frequency income cycle, not a passive position sitting under a label. For anyone evaluating an options-income fund, this is the test: is the strategy genuinely active, or is it holding stocks and calling it something more sophisticated? The activity data answers that directly.
What the returns data and the trade-offs actually show
The theory predicts these strategies should earn more in volatile, rate-transition conditions. FY26 gave them that test, and the audited numbers are worth reading plainly.
Fund return of 8.50% per unit after fees, versus a benchmark return of 7.93%. The benchmark is the S&P/ASX Dividend Opportunities Index on a total return basis.
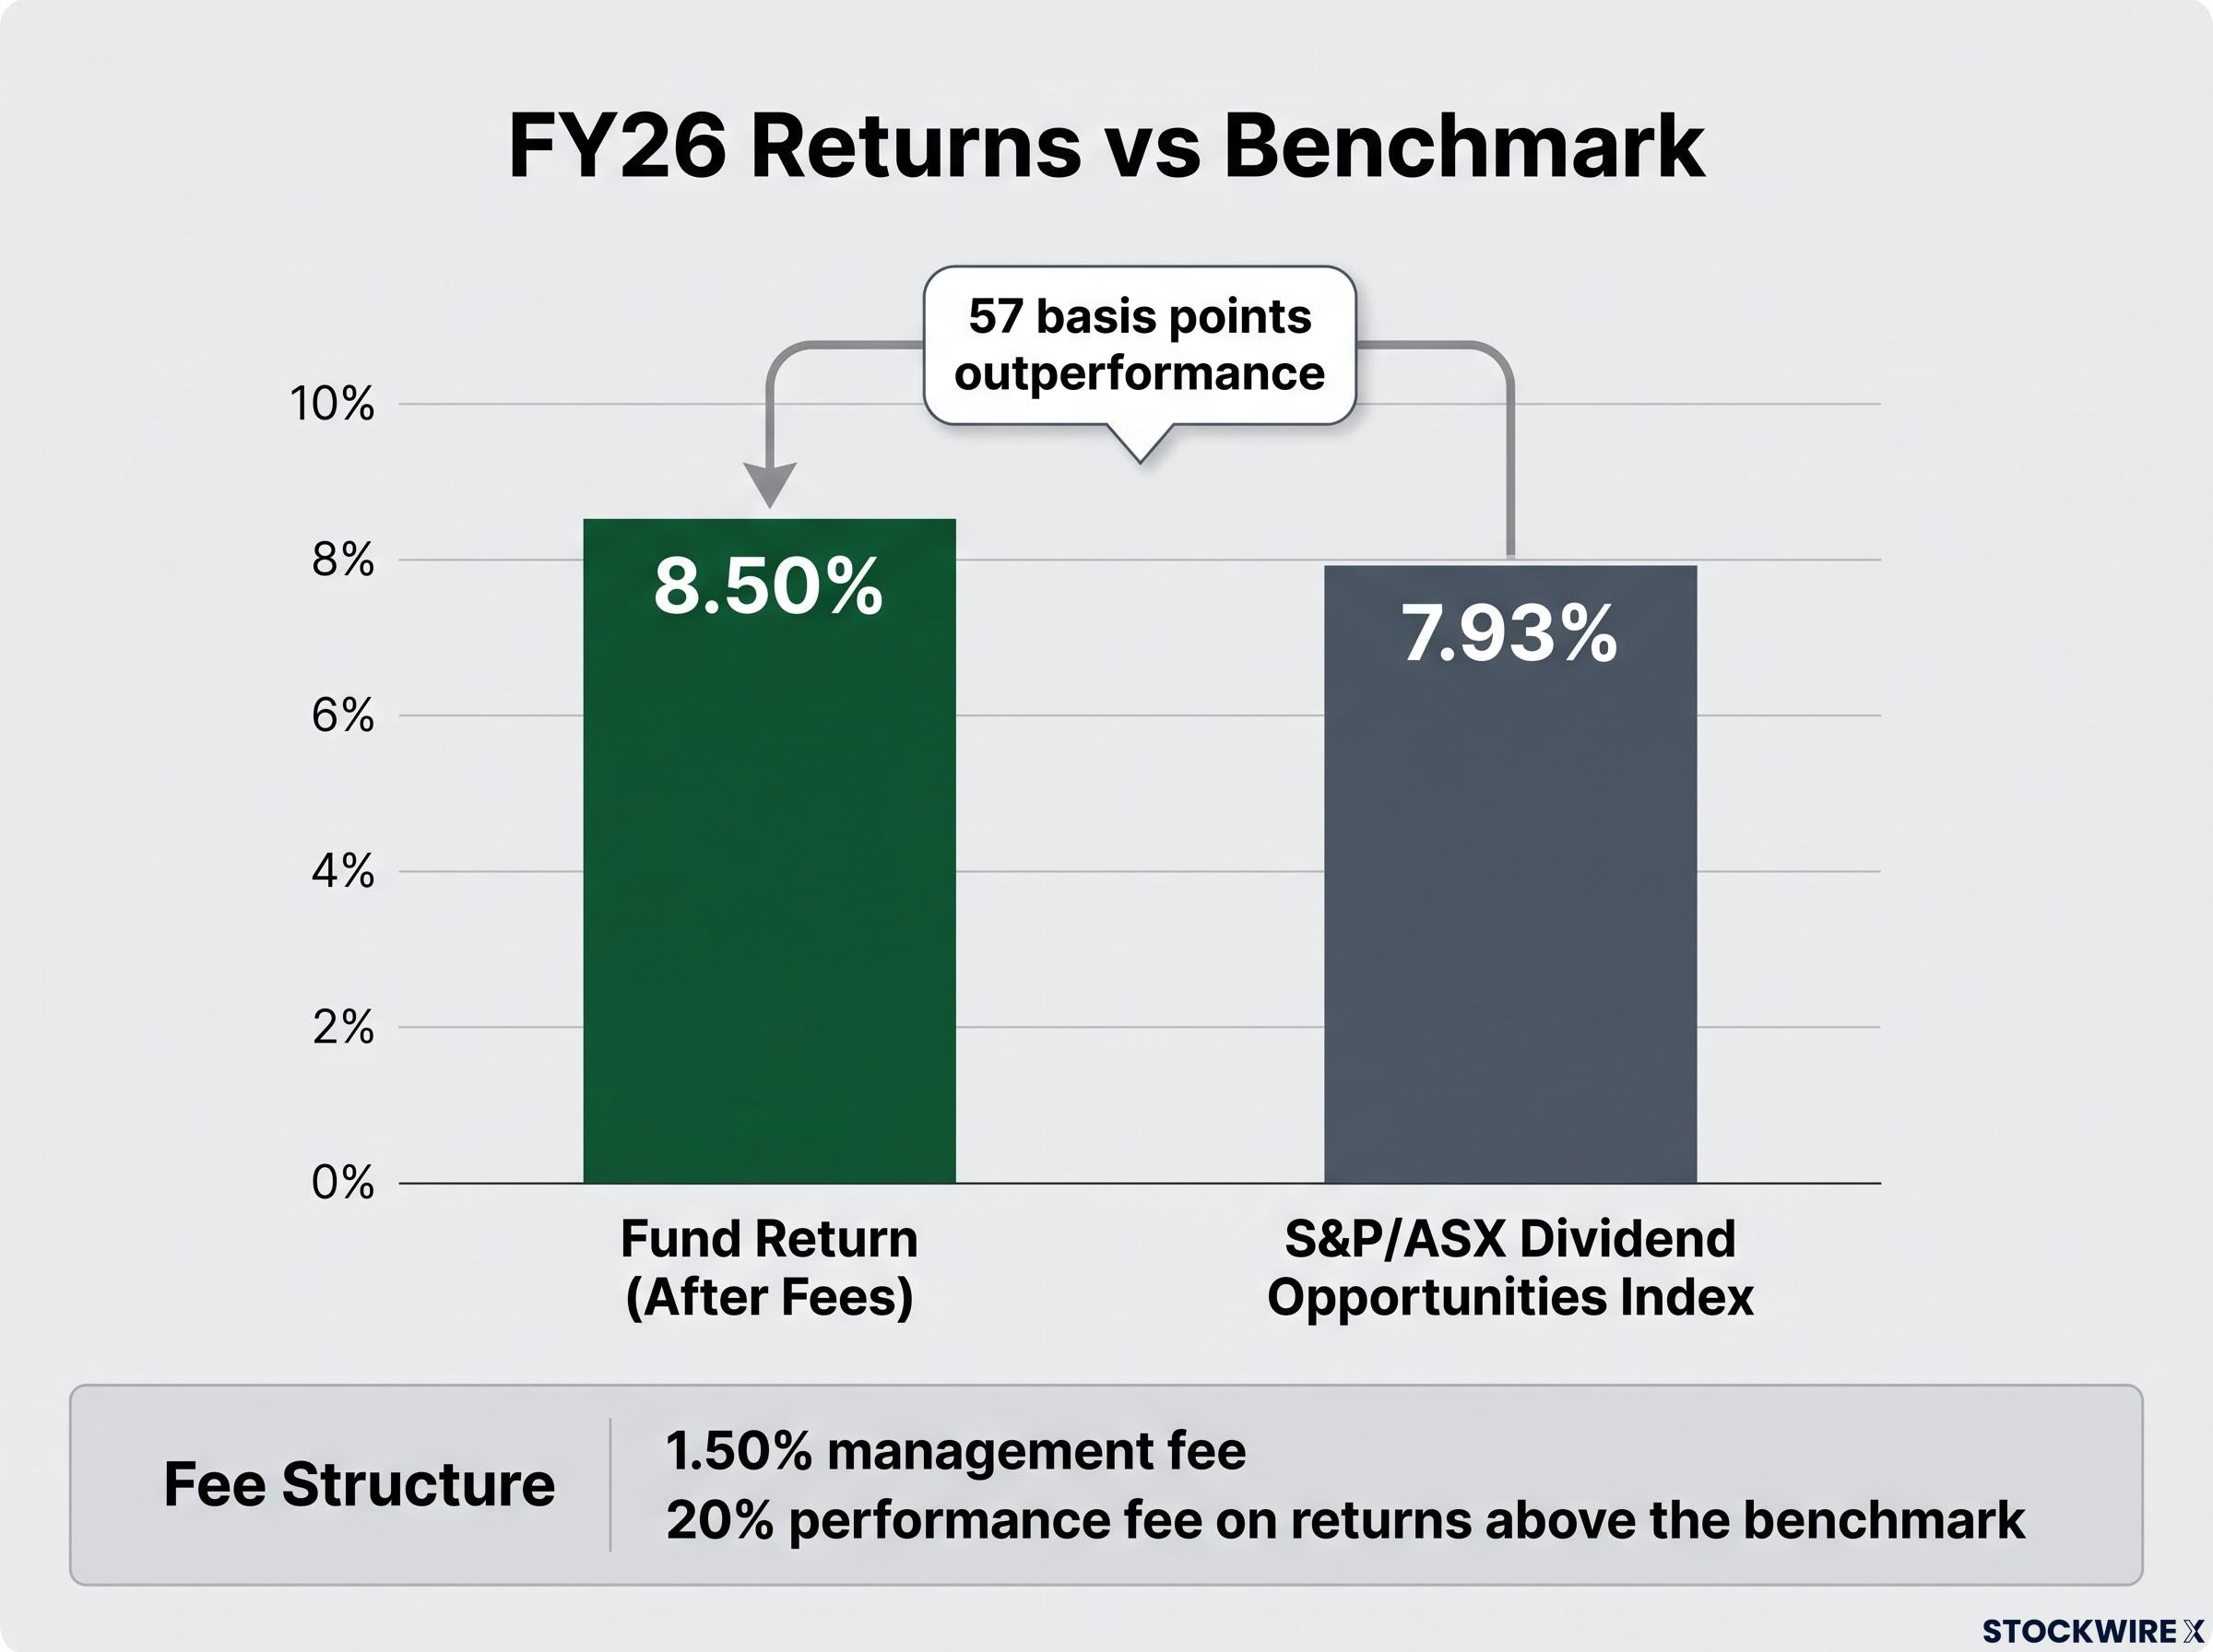
That is roughly 57 basis points of outperformance after a 1.50% management fee and a 20% performance fee on returns above the benchmark. Part of the edge came from mandate flexibility rather than stock-picking: Fairway reduced exposure to housing and consumer sectors during FY26, something index-tracking vehicles could not do. That is a structural advantage of an unconstrained mandate, not evidence of forecasting skill.
The broader pattern across ASX-listed covered-call funds reinforces the shape of this result. Products such as the BetaShares Australian Top 20 Equity Yield Maximiser Fund (YMAX) tend to pay higher cash distributions than standard index funds during volatile periods, because call premiums are richer. The known trade-off, flagged explicitly in their product disclosure statements, is lower total returns when markets rise strongly, because upside above the strike is given away.
The headline yields quoted by covered-call funds are the output of at least three prior decisions: overwrite percentage, strike placement, and how leverage is managed as prices shift; one analysis found a fund advertising a 10% yield where genuine income generated was only 4.8%, with the remainder funded by return of capital.
That trade-off is the honest centre of this whole strategy.
| Benefit | Cost |
|---|---|
| More predictable, often higher income today | Potentially lower long-term capital growth |
| Reduced portfolio volatility via derivative overlays | Tracking error versus pure equity benchmarks |
| Income generation enhanced by volatility | Greater sensitivity to short-term market moves |
| Flexibility to avoid problematic sectors | Higher fees than passive alternatives |
ASIC’s MoneySmart guidance is blunt on what sits inside that framework: exchange-traded options are complex, high-risk instruments that can generate premium income but also introduce risks of capital loss, missed upside, and margin calls.
So is 57 basis points of outperformance after fees impressive? Not dramatically. But the more useful question is whether the result came from the strategy doing what it was designed to do, and the activity data says it did. The real analytical issue, then, is not whether it worked, but whether the conditions that made it work are likely to last.
Who should consider this approach, and who should not
This is where the analysis becomes personal, because the strategy is not broadly suitable. It fits a specific investor and actively disadvantages another, and the dividing line is clear enough to self-assess.
The profile it suits:
- Income-focused investors, particularly retirees, who prioritise steady cash flow over maximum capital appreciation.
- Investors who can tolerate underperforming in strong bull markets, where capped upside bites hardest.
- Those with enough options literacy to understand the payoff profile of what they own, whether directly or through a managed fund.
The profile it does not suit:
- Growth-oriented investors chasing full market upside.
- Investors with low risk tolerance or discomfort with options complexity.
- Retirees who cannot absorb capital losses, given the sequencing risk discussed below.
There is a genuine knowledge barrier here. Understanding delta, gamma, theta, and vega, the sensitivities that drive option pricing, along with assignment, margin, and liquidity risk, is a real prerequisite. Australian investors can access the strategy through managed funds or ETFs such as YMAX without executing options themselves, but they still need to understand the payoff profile of what they hold. ASIC is explicit that options are not appropriate for all investors, particularly those with limited experience or low risk tolerance.
ASIC MoneySmart guidance on exchange-traded options sets out the specific risks retail investors face when writing or buying ETOs, including capital loss, margin calls, and the complexity barriers that make these instruments unsuitable for investors without prior derivatives experience.
The risks that matter most in the current Australian environment
Four risks deserve specific attention, and the current rate backdrop sharpens three of them.
- Capped upside and assignment risk. If RBA-driven tightening triggers a sector re-rating, covered-call writers earn premium but surrender gains above the strike, and shares get called away mid-rally.
- Downside at the strike. Selling puts commits the writer to buying at the strike. If a delayed recession materialises, put writers can be forced to buy well above market in a sell-off.
- Concentration risk. Writing options across a narrow sector exposure, financials or resources alone, amplifies both of the above.
- Sequencing risk for retirees. Large drawdowns while drawing income are especially damaging for retirees, which makes the downside scenarios of put-selling strategies particularly relevant for this cohort through a rate-plateau period.
The relevant question is not whether volatility income strategies work in theory. It is whether your income need, risk tolerance, options literacy, and drawdown profile match the conditions under which they deliver.
Assessing volatility income strategies when the rate plateau holds
Pull the thread together and the picture is coherent. The RBA’s tightening cycle through FY26 produced the elevated implied volatility that makes options-income strategies most productive, and the audited evidence shows one Australian fund converting that environment into modest, real outperformance.
The cash rate sits at 4.60%, a 15-year high. The conditions that fed these strategies have not resolved.
That is the forward-looking crux. The RBA’s May 2026 Statement on Monetary Policy assumed a peak near 4.7% by end-2026. If that holds, the premium-rich environment could persist into early 2027. A pivot toward cuts would do the opposite, compressing implied volatility and thinning the premium income these strategies depend on.
For investors wanting to operationalise the IV-premium relationship before rates shift, our dedicated guide to implied volatility strategy selection explains exactly when elevated IV favours premium-selling structures and when falling IV makes those same trades structurally unattractive.
So the case for options-income strategies is conditional, not permanent. It rests on rates and volatility staying elevated, and that tailwind will not last indefinitely.
For an income investor reading this today, the strategies still work and the conditions are still present, but they are time-limited. The question is less whether they work and more whether you are positioned to act while the environment supports them. Fairway Capital Management is explicit that past performance is an unreliable indicator of future returns, and that caveat is the right note to end on.
This article is for informational purposes only and should not be considered financial advice. Investors should conduct their own research and consult with financial professionals before making investment decisions. Past performance does not guarantee future results. Financial projections are subject to market conditions and various risk factors, and these forward-looking statements are speculative and subject to change based on market developments.