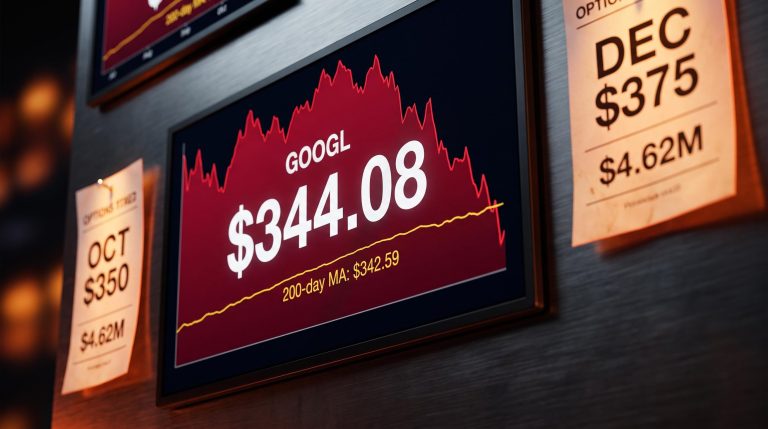
A long-duration bond fund that once sat near $180 now trades around $77, a round-trip back to price levels last seen near the year 2000. For anyone who held TLT through the past six years, that is roughly two decades of gains erased in a handful of them.
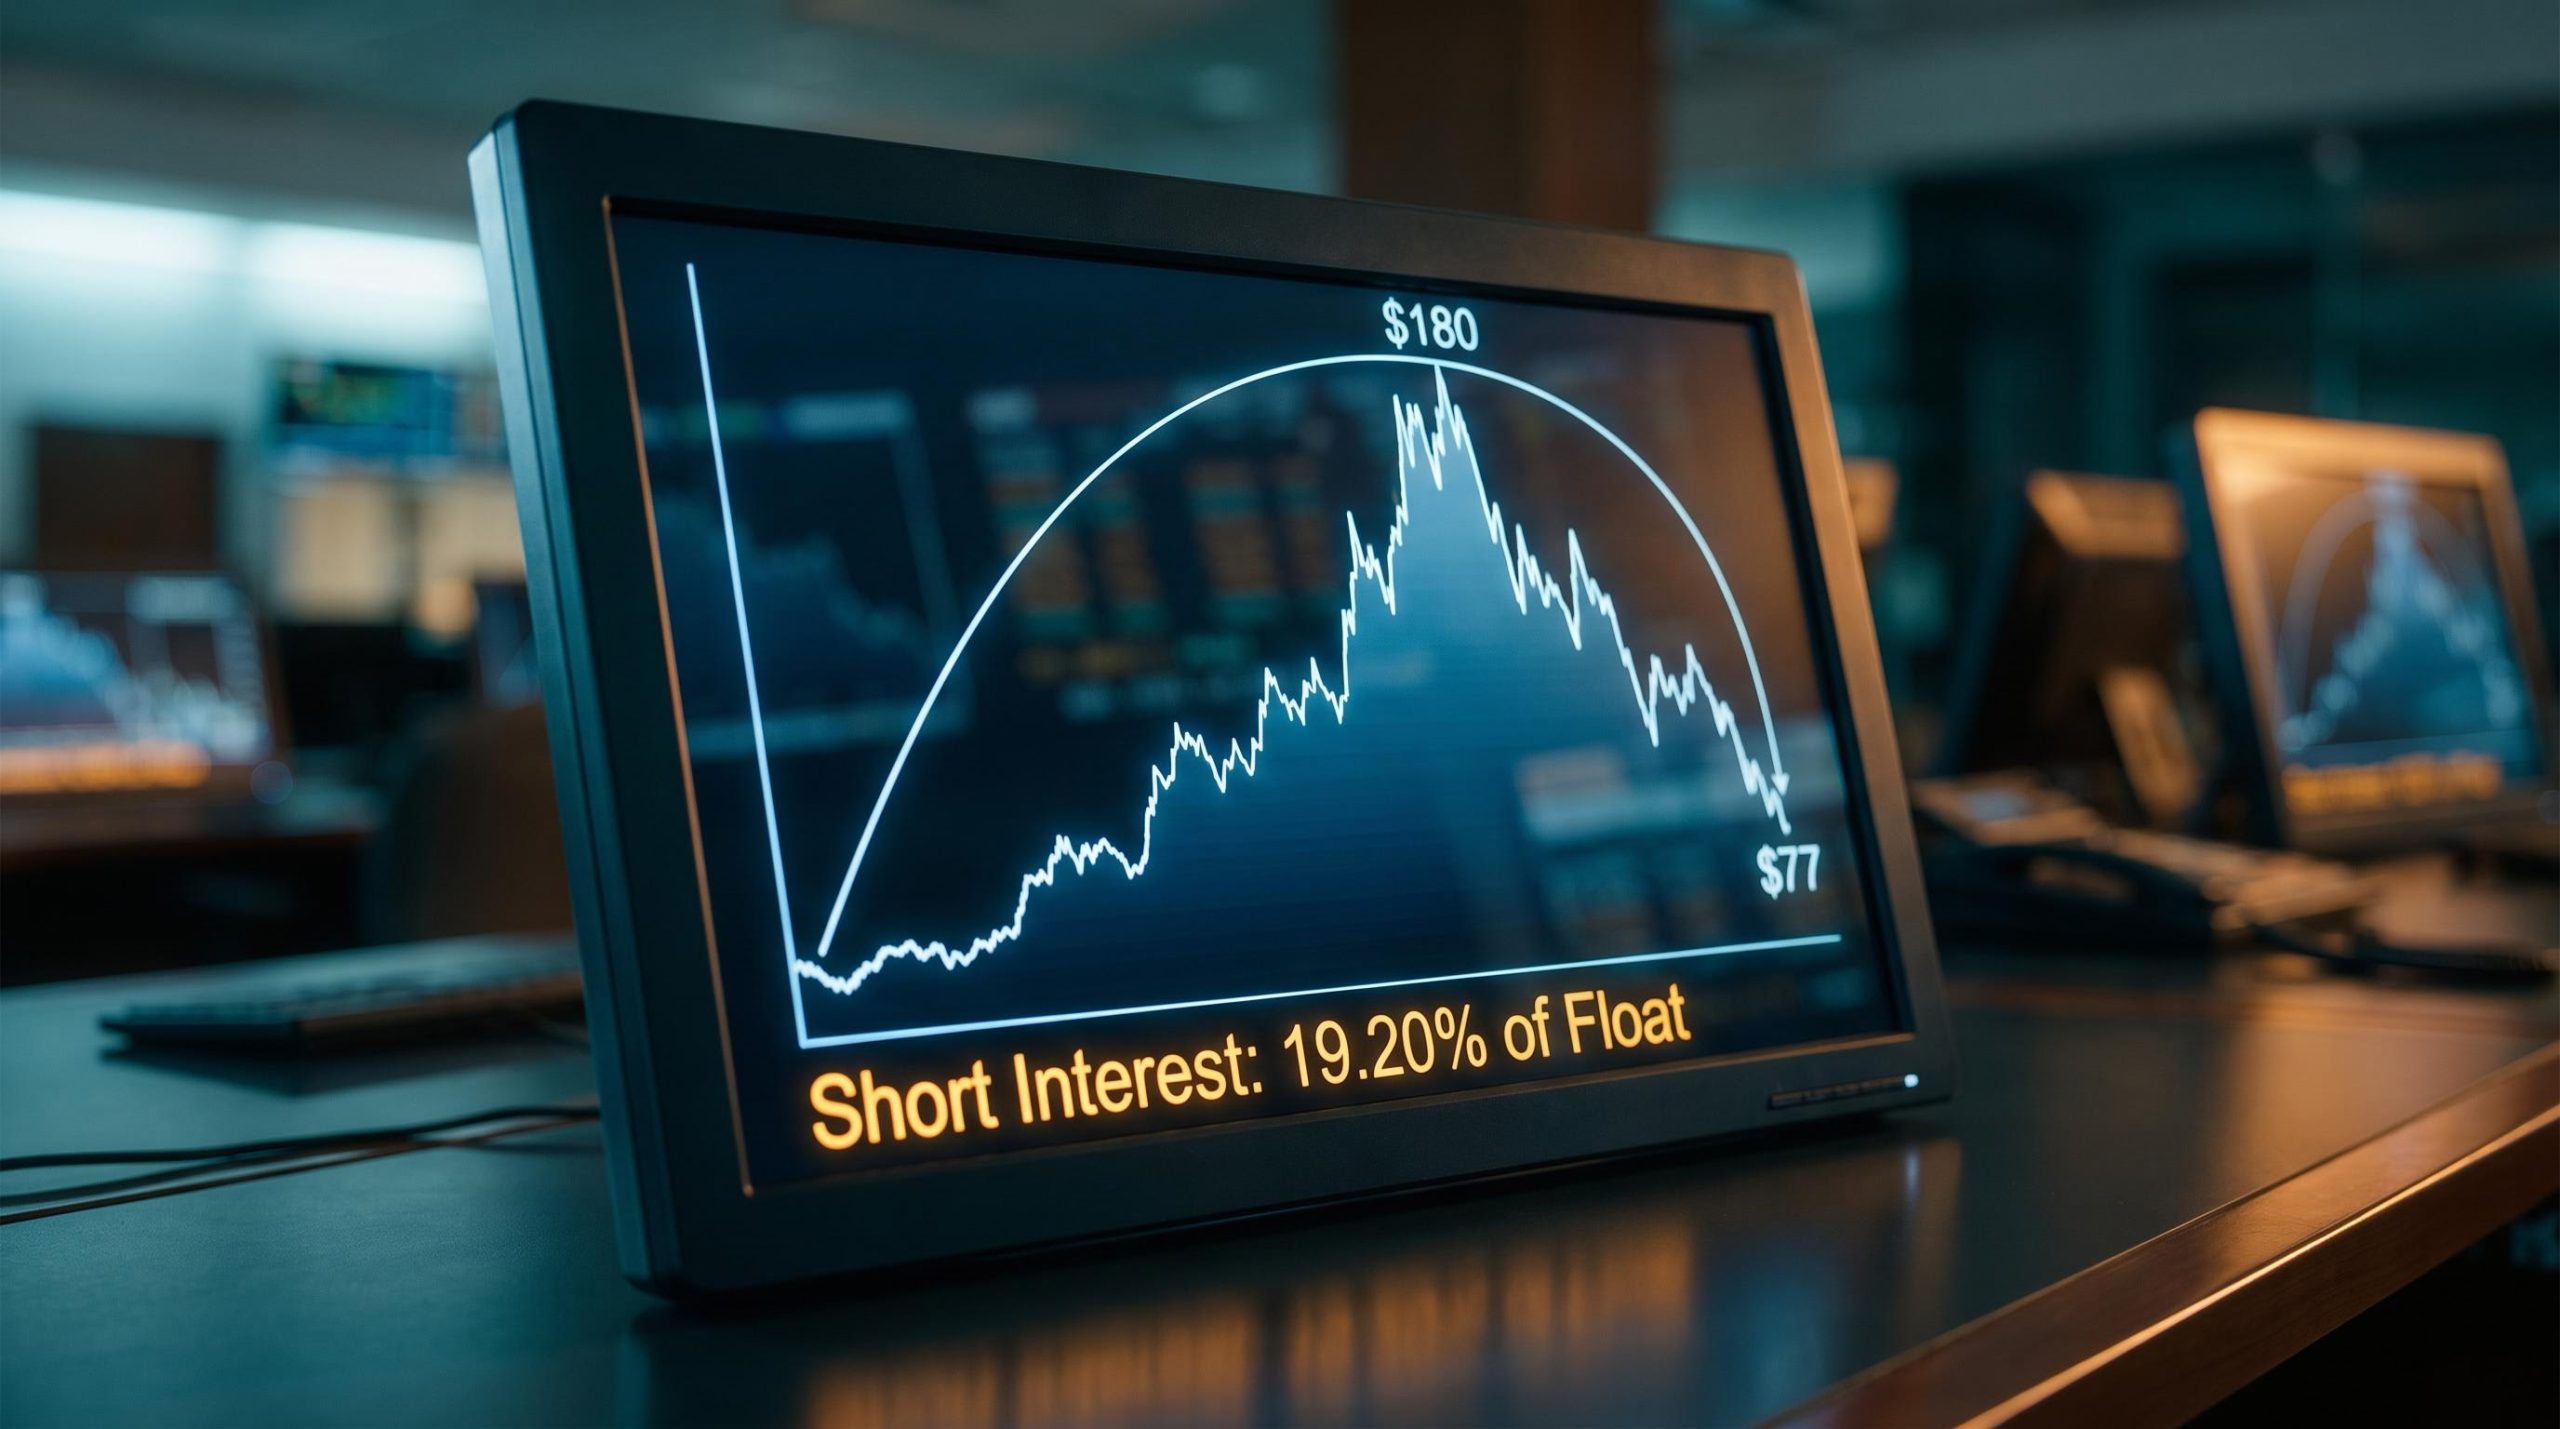
That collapse has set up one of the most contested trades in fixed income. Short interest in the iShares 20+ Year Treasury Bond ETF sits near historically elevated levels, roughly 19.20% of its float as of the September 2026 settlement, and a vocal subset of traders argues the ingredients for a violent snap-back rally are now in place.
The problem is that the structural case for lower bond prices and the positioning case for a squeeze point in opposite directions. This piece lays out what actually drove the decline, what a genuine squeeze would require, and what the data says about whether those conditions have arrived. By the end, you will have a framework for reading this trade rather than a verdict you cannot act on.
A selloff without modern precedent
Start with where the fund trades today. TLT changes hands near $77 to $77.70, a level that puts it roughly where it sat in the early years of this century.
Rewind to 2020, and the picture is almost unrecognisable. During the COVID rate collapse, TLT peaked near $180 as yields fell to historic lows and long-duration bonds became the safest bet in the room.
Now walk the price history back to its starting point. TLT traded near $80 around 2002, meaning the fund has completed a full round trip: up roughly $100 to its pandemic peak, then all the way back down.
- 2002 baseline: approximately $80
- 2020 peak: approximately $180
- Current level: approximately $77 to $77.70
That is a decline of roughly 60% from the 2020 high. To understand why this is not just another bad year for bonds, compare it to the prior worst episode for this kind of product.
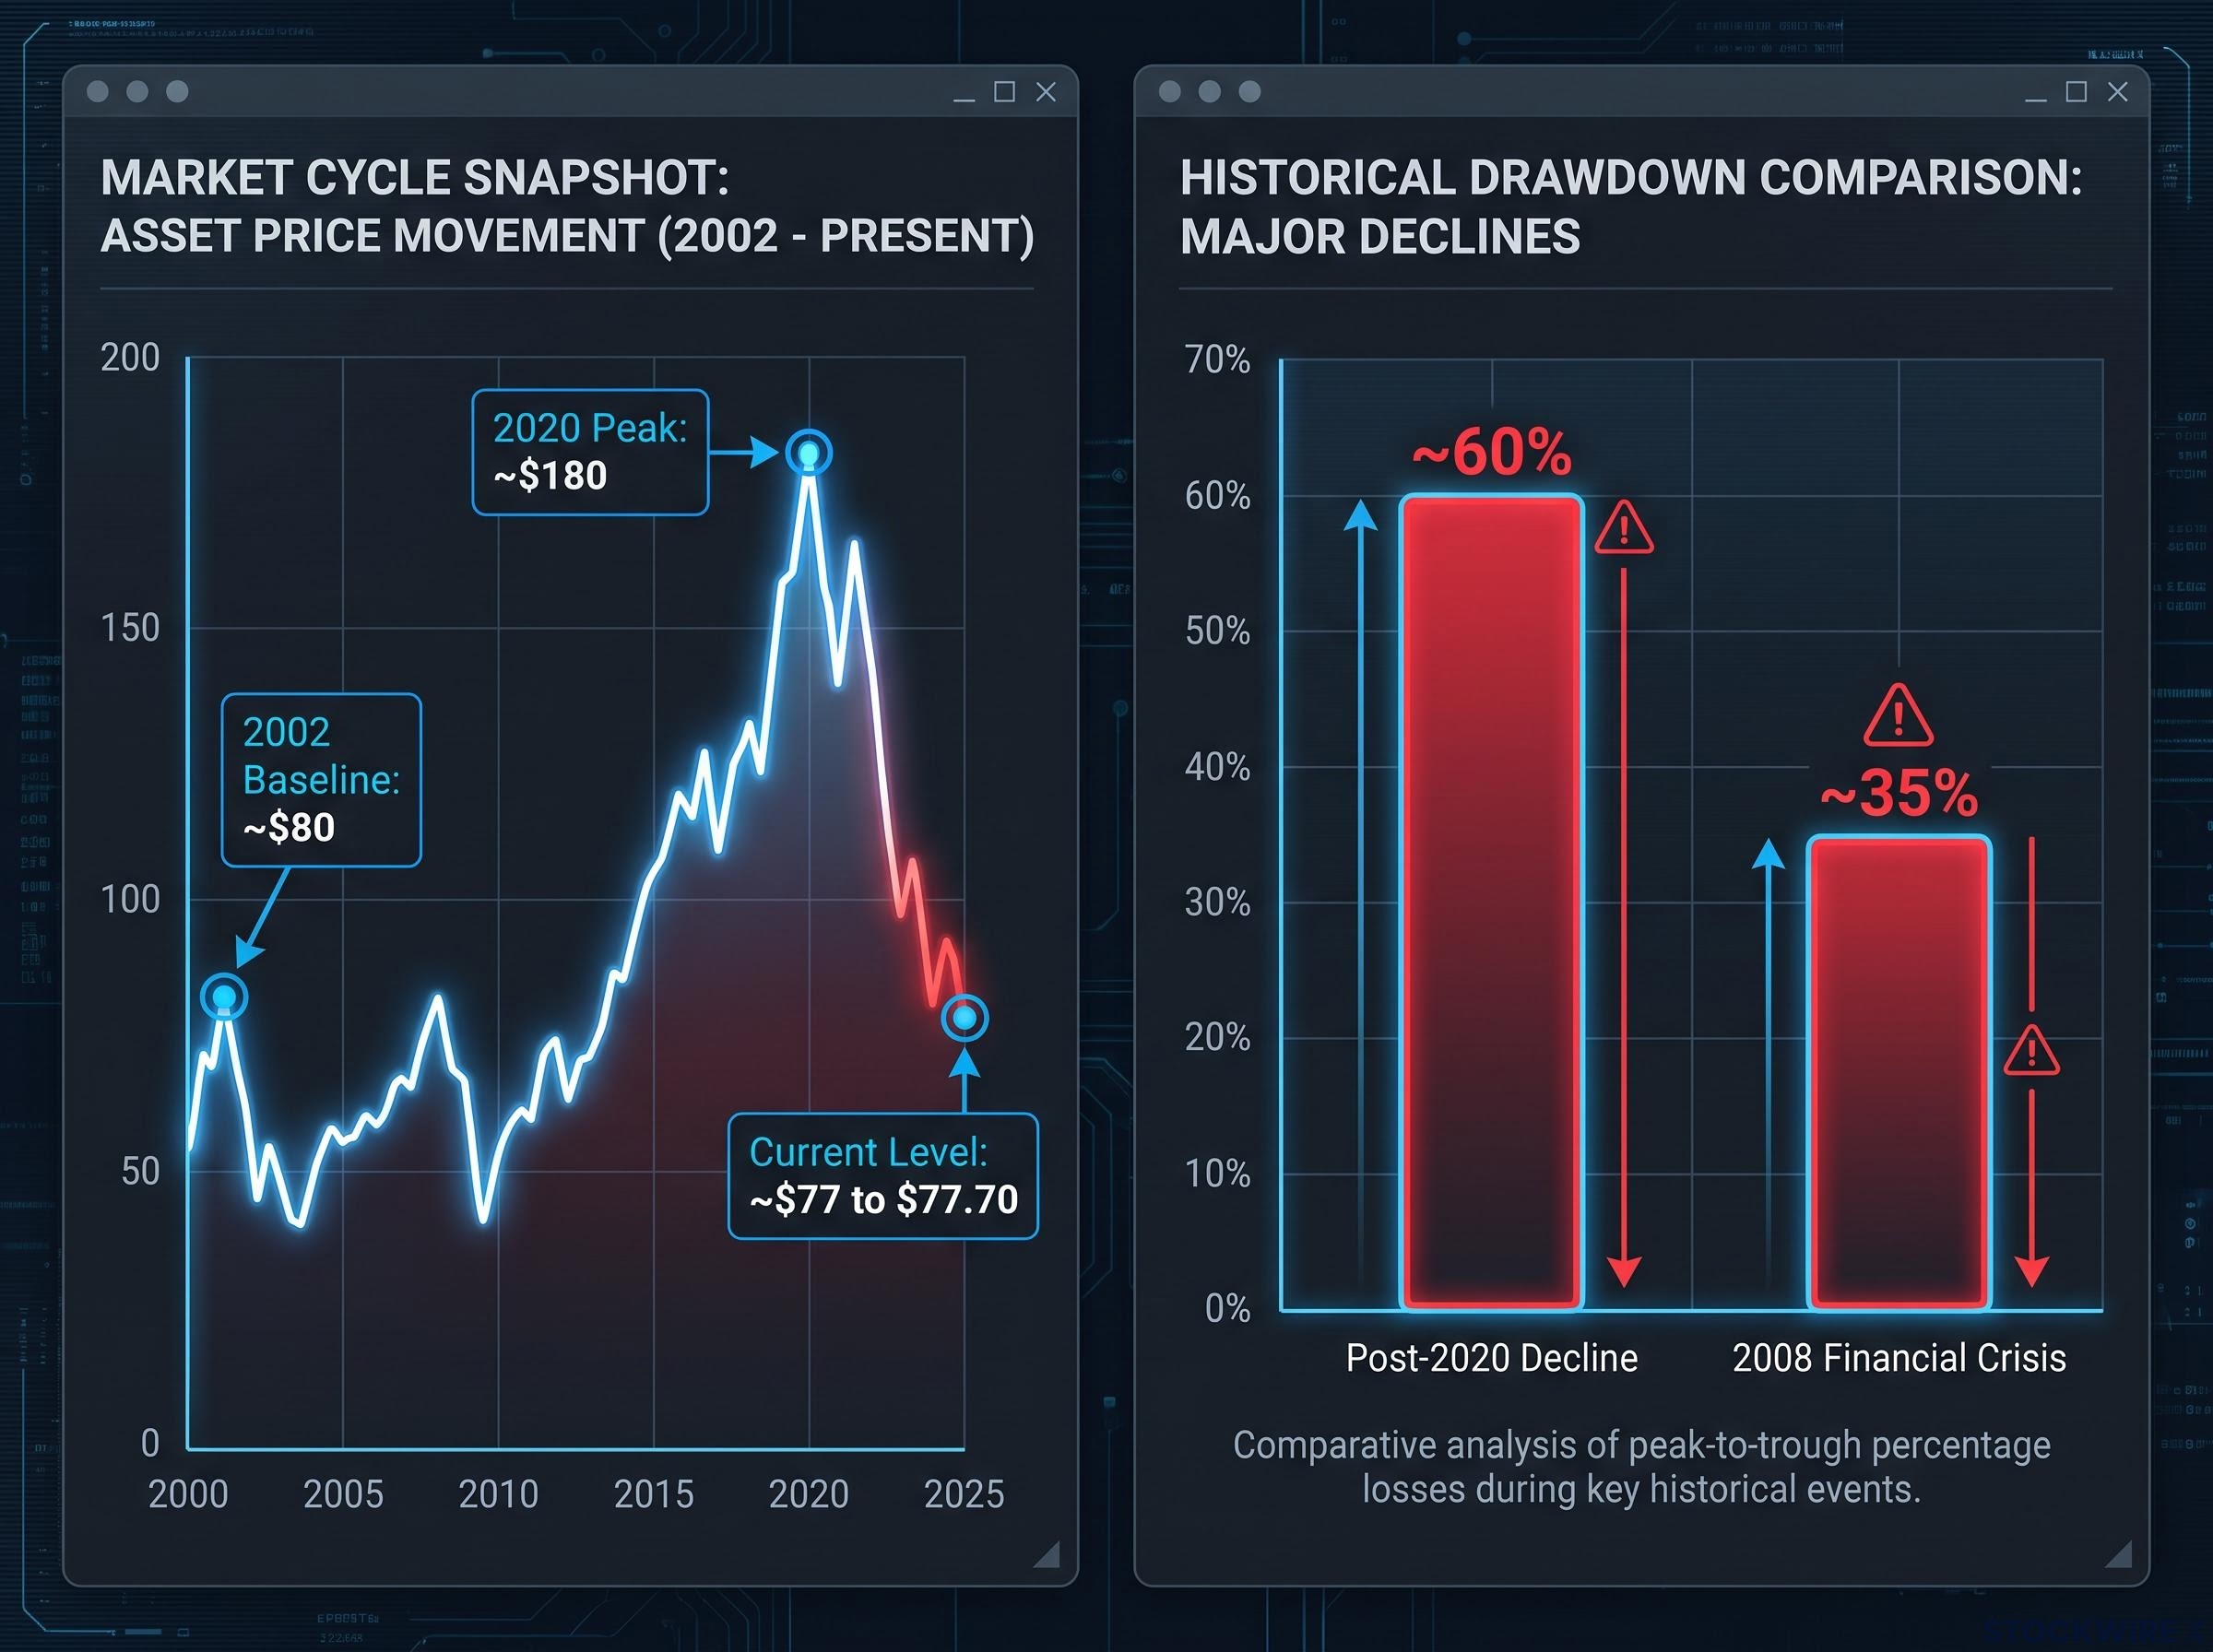
The 2008 financial crisis produced a drawdown of roughly 35% in long-duration Treasuries. The post-2020 decline of roughly 60% is nearly double that, making this the deepest drawdown in the asset class’s modern history.
This matters beyond the record books. If you built your sense of bond risk before 2020, using the 2008 crisis as the worst-case anchor, this episode tells you that framework materially understated what a full rate-cycle reversal could do to long-duration assets.
Bond duration is the engine behind the scale of TLT’s drawdown: a fund carrying an effective duration of 16 responds to a 300 basis point rise in long yields with a price decline that approaches 48%, a loss magnitude that most investors running pre-2020 risk frameworks never stress-tested.
Why duration amplifies every yield move
The engine behind these moves is duration. TLT carries an effective duration of roughly 16 years, a measure of how sensitive its price is to changes in interest rates.
In practical terms, a duration of 16 means TLT’s price moves roughly 16% for every 1 percentage point change in long-term yields. A 50 basis point fall in yields generates close to an 8% rally, and the same arithmetic works brutally in reverse.
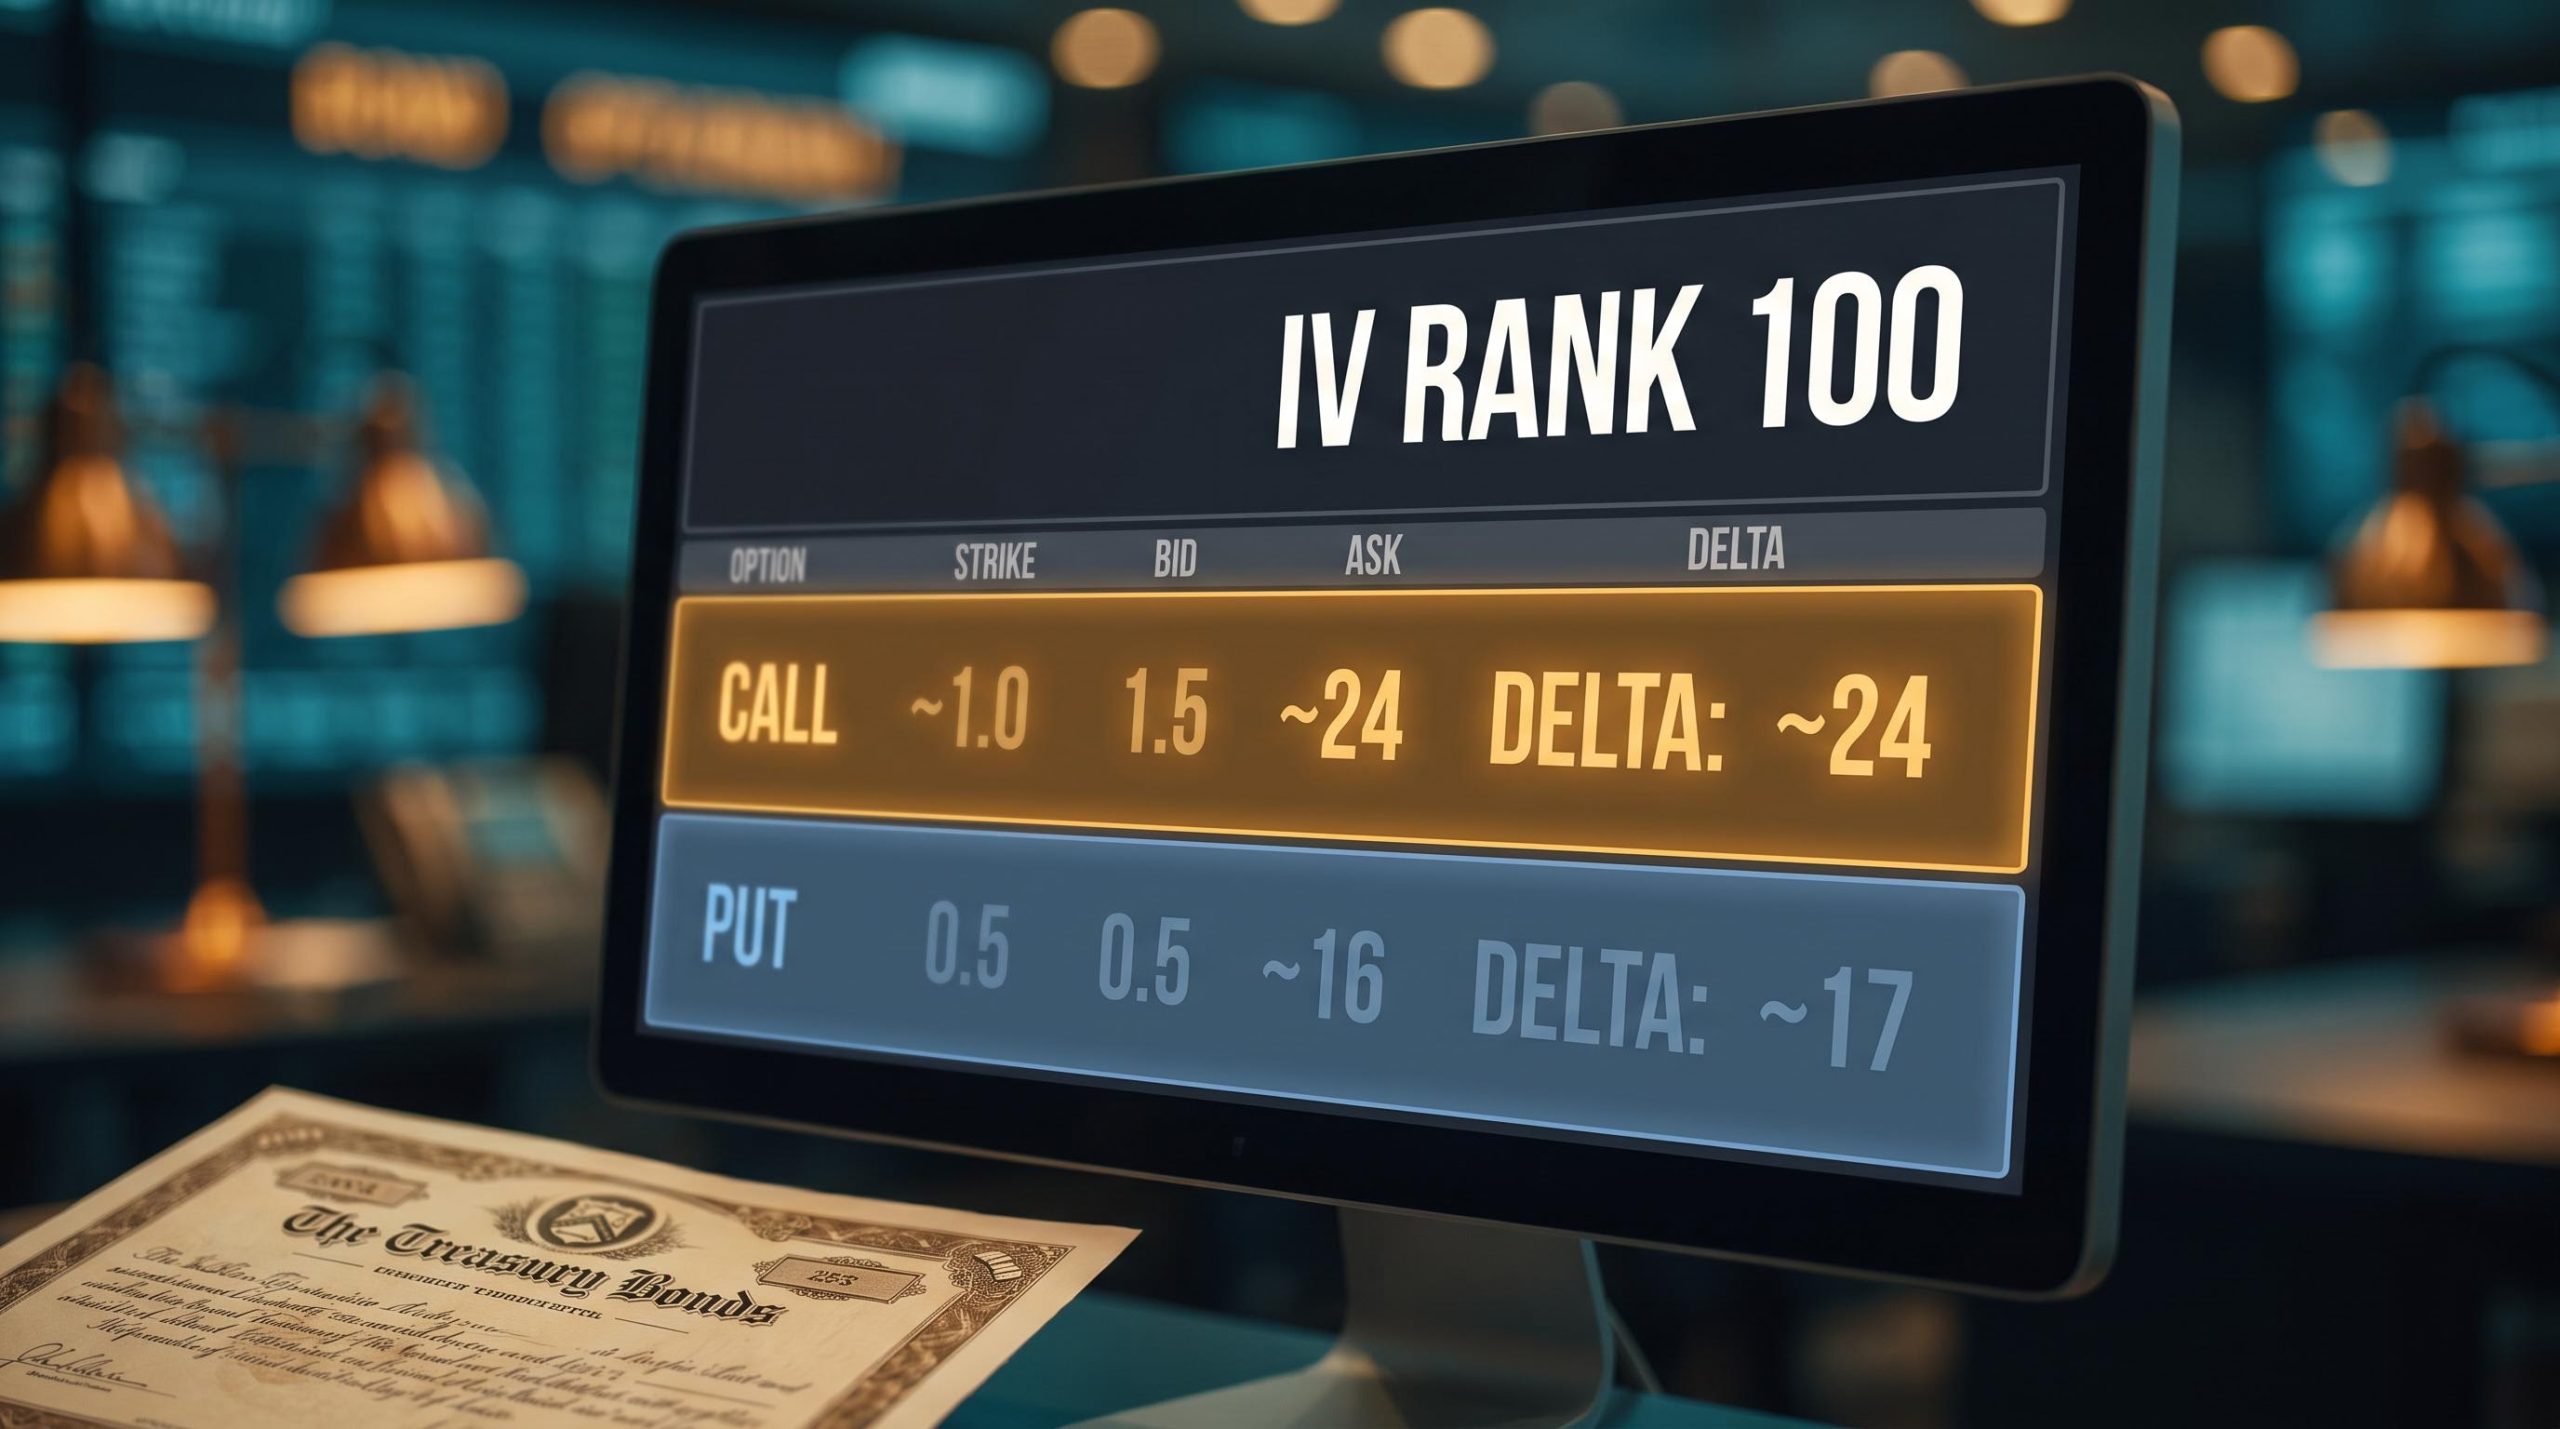
That sensitivity is precisely what the options market has been reluctant to price for a fast reversal. A move of that magnitude was not reflected in TLT options until the March 2027 expiry cycle, a signal that traders are not expecting a rapid snap-back in the near term.
When big ASX news breaks, our subscribers know first
What broke the long bond: three structural forces
The selloff is not a single story. Three forces have operated together, each reinforcing the others, which is why so many single-variable forecasts (“the Fed will cut, bonds will recover”) have repeatedly disappointed.
- Federal Reserve policy trajectory: a higher-for-longer posture that has outlasted most bulls’ patience.
- Term premium repricing: investors demanding more compensation to hold long-dated debt, independent of where short rates sit.
- Foreign demand retreat: the steady, price-insensitive buyers of U.S. Treasuries stepping back.
Take the Fed first. At its 16 September 2026 meeting, the FOMC raised the federal funds target by 25 basis points to a range of 3.75% to 4.00%, with communications stressing that inflation “remains elevated.” That hike is best read not as the cause of the collapse but as one more confirmation of a multi-year stance that has kept the long end under pressure.
The second force is subtler. Term premium is the extra yield investors demand for the risk of holding a long-dated bond rather than rolling short ones, and it has been climbing on the back of inflation uncertainty, large fiscal deficits, and heavy Treasury supply. The 10-year yield closed at 5.01% on 16 September 2026, its highest daily close of the year and its highest level since 2007, with later September prints ranging up toward 5.29%. Schwab’s strategists, in an August 2026 note, lifted their expected 10-year trading range to 4.25% to 4.75%, above their prior band.
Term premium repricing has accelerated as the Fed’s share of outstanding public debt shrank from roughly 26% in 2021 to approximately 14% by mid-2026, halving its direct leverage over long-term borrowing costs and leaving the bond market itself to set the price of long-duration money.
The retreat of the anchor buyers
The third force is where the structural shift becomes concrete. Japan and China have long been the two largest foreign holders of U.S. Treasuries, and historically they bought steadily regardless of price, acting as a demand floor that dampened yield spikes.
That floor has been pulled away. Over the five months from February to July 2026, the two countries reduced their combined holdings by roughly $212 billion.
| Holder | July 2026 Holdings | Approx. February 2026 | Change |
|---|---|---|---|
| Japan | $1,103.9B | ~$1,240B | ~-11% |
| Mainland China | $618.0B | ~$694B | ~-11% |
The retreat extends beyond the top two. Total foreign holdings peaked near $9.49 trillion in February 2026 before falling to $9,248.1 billion by July, according to Treasury International Capital (TIC) data cited by 24/7 Wall St., which points to net selling across the entire foreign holder base.
Set against a U.S. national debt of roughly $40 trillion, that withdrawal matters more than any single geopolitical headline. It removes the structural demand anchor that historically kept long-end yields from spiking freely, and that absence is now priced into the curve whether or not you recognise it as the reason.
The retreat extends beyond the top two. Total foreign holdings peaked near $9.49 trillion in February 2026 before falling to $9,248.1 billion by July, according to Treasury International Capital data released by the U.S. Department of the Treasury, which tracks net foreign acquisitions of long-term U.S. securities on a monthly basis.
The short squeeze thesis: what it would actually require
Here is the mechanism, cleanly. A fast rally in TLT, driven by a sharp drop in long-term yields, inflicts mark-to-market losses on anyone short the fund. Those losses trigger margin calls and risk-limit breaches, which force shorts to buy back shares, which pushes the price higher and draws in still more covering.
The self-reinforcing logic of short squeeze mechanics follows a precise sequence: mark-to-market losses trigger margin calls, margin calls force covering, covering lifts the price, and the higher price draws in still more forced buyers, with each step amplifying the next.
That is the logic. Now stress-test each link against the current data.
The first link, crowded short positioning, is genuinely present. As of the 15 September 2026 settlement, MarketBeat reported 107.78 million shares sold short, equal to 19.20% of float, with ChartExchange confirming a near-identical 18.73%. At an earlier point in the cycle, the original squeeze thesis cited short interest closer to 135 million shares, or roughly 25% of float, so some covering has already occurred.
The second link, the size of rally required, is where the thesis starts to strain. The original source estimated a move of roughly 8% would be needed to force meaningful covering, and that scale of move was not priced into TLT options until the March 2027 cycle (an implied move of roughly plus or minus $6.50, or 8% to 10%).
Short interest: 19.20% of float. Days to cover: 3.7. Elevated positioning, but not trapped positioning.
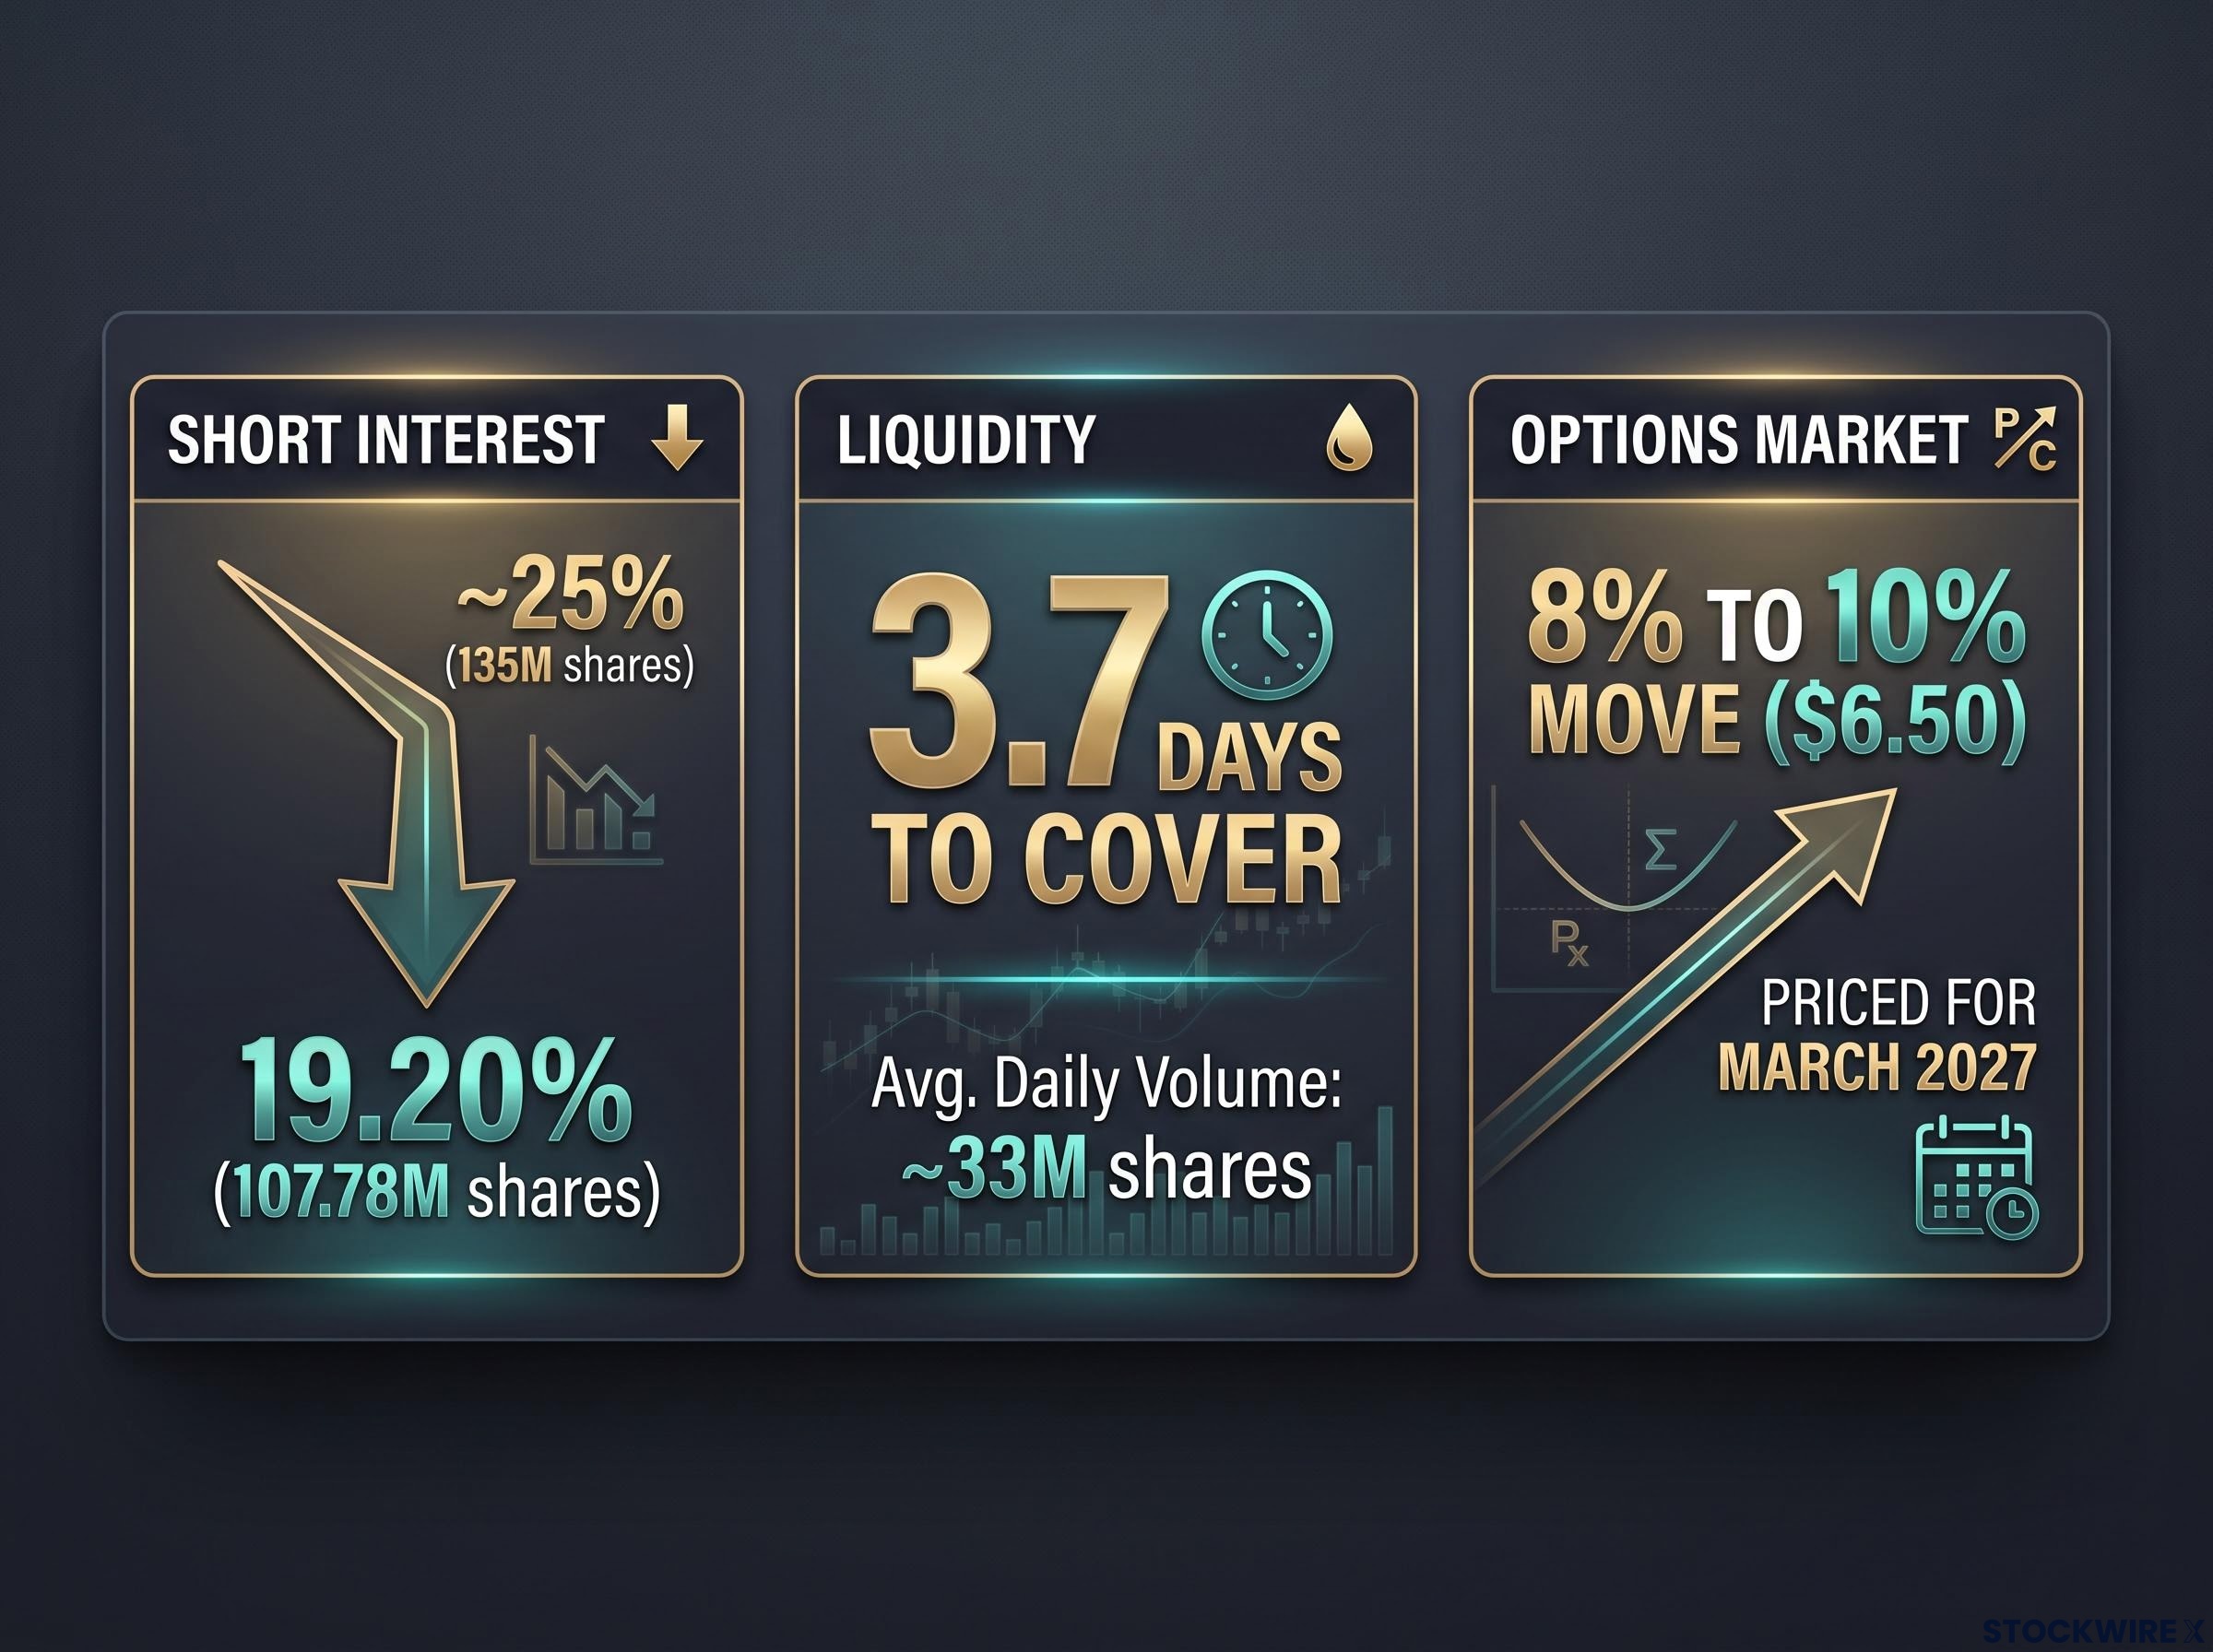
The third link is the catalyst, and this is the weak point. A 3.7-day cover ratio, calculated against average daily volume of roughly 33 million shares, means shorts are positioned in one of the most liquid securities in the world. They are not trapped in an illiquid instrument where positioning alone forces the issue. For the rally to become self-reinforcing, an external shock would have to arrive first. Candidates include:
- A decisive dovish Fed pivot, meaning rapid rate cuts in response to a downturn.
- A major risk-off event driving a flight to safety into long-duration Treasuries.
- Renewed foreign official buying.
- A cluster of soft macro data. The original source pointed to soft inflation prints, a roughly 5% drop in oil, and consumer confidence at its lowest since 2014 as signals that had already produced consecutive positive sessions.
The read for anyone eyeing TLT calls as a squeeze play: elevated short interest is a necessary condition, not a sufficient one. Conflating the two leads to entering a trade that may take months, or a policy shock, to resolve.
Historical precedents: when bond squeezes have worked
Bond squeezes do happen, and the history clarifies what they need. In the 2008 crisis and the March 2020 COVID shock, flight-to-safety flows drove long-duration Treasuries sharply higher in short order, punishing shorts.
The most instructive parallel is the 2022 UK gilt crisis. Forced selling by liability-driven investment pension schemes first drove yields up violently, before emergency Bank of England purchases triggered a powerful short-covering rally. That episode shows how a policy intervention superimposed on crowded shorts creates mechanical buying pressure.
Japan’s yield-curve-control episodes offer a related lesson, with aggressive central-bank buying repeatedly overriding short positioning in long-dated government bonds. Across all of these, the common conditions are the same: an unexpected policy or macro shock, pre-existing crowded shorts, and limited alternative safe-haven assets at scale.
What the data tells investors on both sides of this trade
This is not a bull case followed by a bear case. The genuine feature of this trade is that both sides face real, asymmetric risk at the same time.
If you are long TLT or considering an entry, the duration arithmetic cuts against you first. A further 50 basis point rise in yields from current levels would inflict another roughly 8% price decline on a position already deeply underwater, which makes sizing and entry timing critical rather than optional.
If you are short, the 3.7-day cover ratio may feel comfortable right up until a policy surprise arrives. At that point, rising borrow costs, share-recall risk, and gap risk in a fast market can compress the real covering window well below what the headline number implies.
| Dimension | Long TLT | Short TLT |
|---|---|---|
| Primary risk | Duration loss on rising yields | Convexity loss on falling yields |
| Trigger event | Further hawkish Fed or supply shock | Dovish pivot or risk-off flight |
| Duration of pain | Potentially prolonged, path-dependent | Rapid once a catalyst hits |
| Signal to watch | 10-year above the 5% band | Short interest falling sharply |
Crowding cuts both ways. If squeeze-play longs pile into TLT calls and the catalyst fails to show, unwinding those positions can itself become a source of downside pressure.
Schwab’s guidance (August 2026): favour diversified duration exposure over binary long or short positioning, given that the risk of further rate hikes remains live.
The options market offers the sharpest single read on timing. Pricing an 8% to 10% move only as far out as March 2027 is not an invitation for patient bulls. It is the market’s way of saying the conditions for a squeeze are theoretically present but the catalyst is not considered imminent, and anyone buying calls against that gap should understand they may be paying for time they cannot afford.
What a genuine resolution looks like, and what to watch for it
The resolution of this trade depends on a catalyst that is not yet in the data, which makes a directional verdict less useful than a set of observable signals. Rather than wait for a single analyst call, you can monitor the variables that would tell you in real time whether the squeeze thesis is gaining or losing validity.
Keep a watch list:
- Fed communications turning dovish. A genuine shift in tone toward cuts, not just a pause, is the most direct trigger for the rally the thesis needs.
- The 10-year yield breaking below 5%. With September prints in the 5.01% to 5.29% band and Schwab’s forecast at 4.25% to 4.75%, a sustained move below the 5% line would be a meaningful downside break in yields.
- TIC data showing renewed foreign buying. The next read comes with the usual lag; July 2026 is the most recent available, so August data is the next window onto whether Japan and China reverse course.
- Short interest declining sharply. A drop from here would suggest covering is already underway and could act as a leading signal.
That last point deserves weight. Short interest has already fallen from roughly 25% of float to 19.20% before any sustained rally materialised, which suggests some participants are not waiting for confirmation.
The honest framing is prolonged uncertainty rather than imminent resolution, consistent with Schwab’s caution and the options market’s March 2027 horizon. Whether you position for the squeeze, hedge an existing long, or sit the trade out depends on which of these signals arrives first, and how fast.
For investors who hold TLT as part of a broader fixed income allocation, our full explainer on bond portfolio management in a normalised rate environment walks through how BlackRock, PIMCO, Vanguard, and J.P. Morgan are calibrating duration across the curve and which instruments they favour for balancing yield against rate sensitivity.
This article is for informational purposes only and should not be considered financial advice. Investors should conduct their own research and consult with financial professionals before making investment decisions. Past performance does not guarantee future results. Financial projections are subject to market conditions and various risk factors, and forward-looking scenarios discussed here are speculative and subject to change based on market developments.