Three separate forces converged on markets on 1 October 2026: a once-dominant consumer brand hovering near a 12-year low with record short interest, oil ETFs spiking 2-3% on fresh Middle East escalation, and at least one portfolio manager cutting exposure by nearly half ahead of a jobs report expected to show the weakest payroll growth in months.
Each of these developments runs on its own logic, but their simultaneous arrival points to a single condition in markets right now: event risk is stacking. Corporate fundamentals, a geopolitical supply shock, and a macro data release are all landing in the same short window, and how investors navigate the intersection matters as much as any single outcome.
This breaks down each catalyst, what the numbers actually show, and what the positioning moves around them suggest about where informed money sees the risk sitting this week.
Nike’s 80% collapse puts earnings under a microscope
Nike has shed roughly four-fifths of its market value, and the destruction is close to total by any measure an investor would care about.
The stock closed at $35.75 on 29 September 2026, according to MEXC Crypto Pulse, down approximately 78-80% from its November 2021 peak. That peak sits near $161.91 on a closing basis, or closer to $179 intraday, per Fortune and Yahoo Finance reporting; the discrepancy reflects methodology, but the scale of the fall is consistent across every source.
Put another way, Nike now trades near where it changed hands in 2014. Roughly 12 years of price gains have been unwound, before even accounting for inflation.
The institutional standing has eroded alongside the price. In September 2026, Nike was removed from the S&P 100 after nearly 18 years in the index, a structural marker of how far the company has fallen, not just a line on a chart.
| Metric | Peak | Current |
|---|---|---|
| Share price | ~$161.91 (Nov 2021 close) | $35.75 (29 Sep 2026) |
| Market cap | ~$264 billion | ~$57 billion |
| Annual revenue | Higher prior years | $46.4 billion (FY2026, -2% currency-neutral) |
| Short interest | Lower prior levels | 87 million shares (all-time high) |
The fundamentals explain the entrenchment. Fiscal 2026 revenue came in at $46.4 billion, down 2% on a currency-neutral basis, with Q4 revenue of $11 billion down 4% currency-neutral and guidance pointing to further deceleration into Q1 and Q2 FY2027.
JPMorgan expects the “Win Now” turnaround to weigh on earnings through at least FY2028, framing the path ahead as stabilisation rather than recovery. Telsey Advisory Group cut its price target in September 2026 with a blunt assessment of the pace.
Telsey Advisory Group The turnaround is “progressing slowly.”
Here is where the two camps sit:
- Bearish thesis: Revenue is contracting, guidance signals more deceleration, short interest is at a record, and the stock has lost its blue-chip index membership. JPMorgan’s stabilisation-only view through FY2028 anchors this case.
- Constructive-contrarian thesis: A near-80% collapse plus the S&P 100 exit may mark capitulation, setting up a long-duration recovery for patient investors, contingent on sustained progress in product and margins.
Short interest of 87 million shares, an all-time high per S3 Partners, combined with ongoing revenue decline tells you professional investors have built a structural bearish thesis here, not a momentum trade. Entering or holding Nike requires a specific conviction about what reverses that thesis, and at this level of crowding, any earnings surprise in either direction carries outsized potential for violent price action.
When big ASX news breaks, our subscribers know first
Why oil surged while the broader market held its ground
The energy complex moved hard on 1 October 2026, and it moved alone.
- USO (United States Oil Fund): up close to 3% on reports of additional Middle East military deployments
- XOP (Oil and Gas Exploration ETF): up approximately 3% on the same catalyst
- XLE (Energy Select Sector ETF): up close to 2%
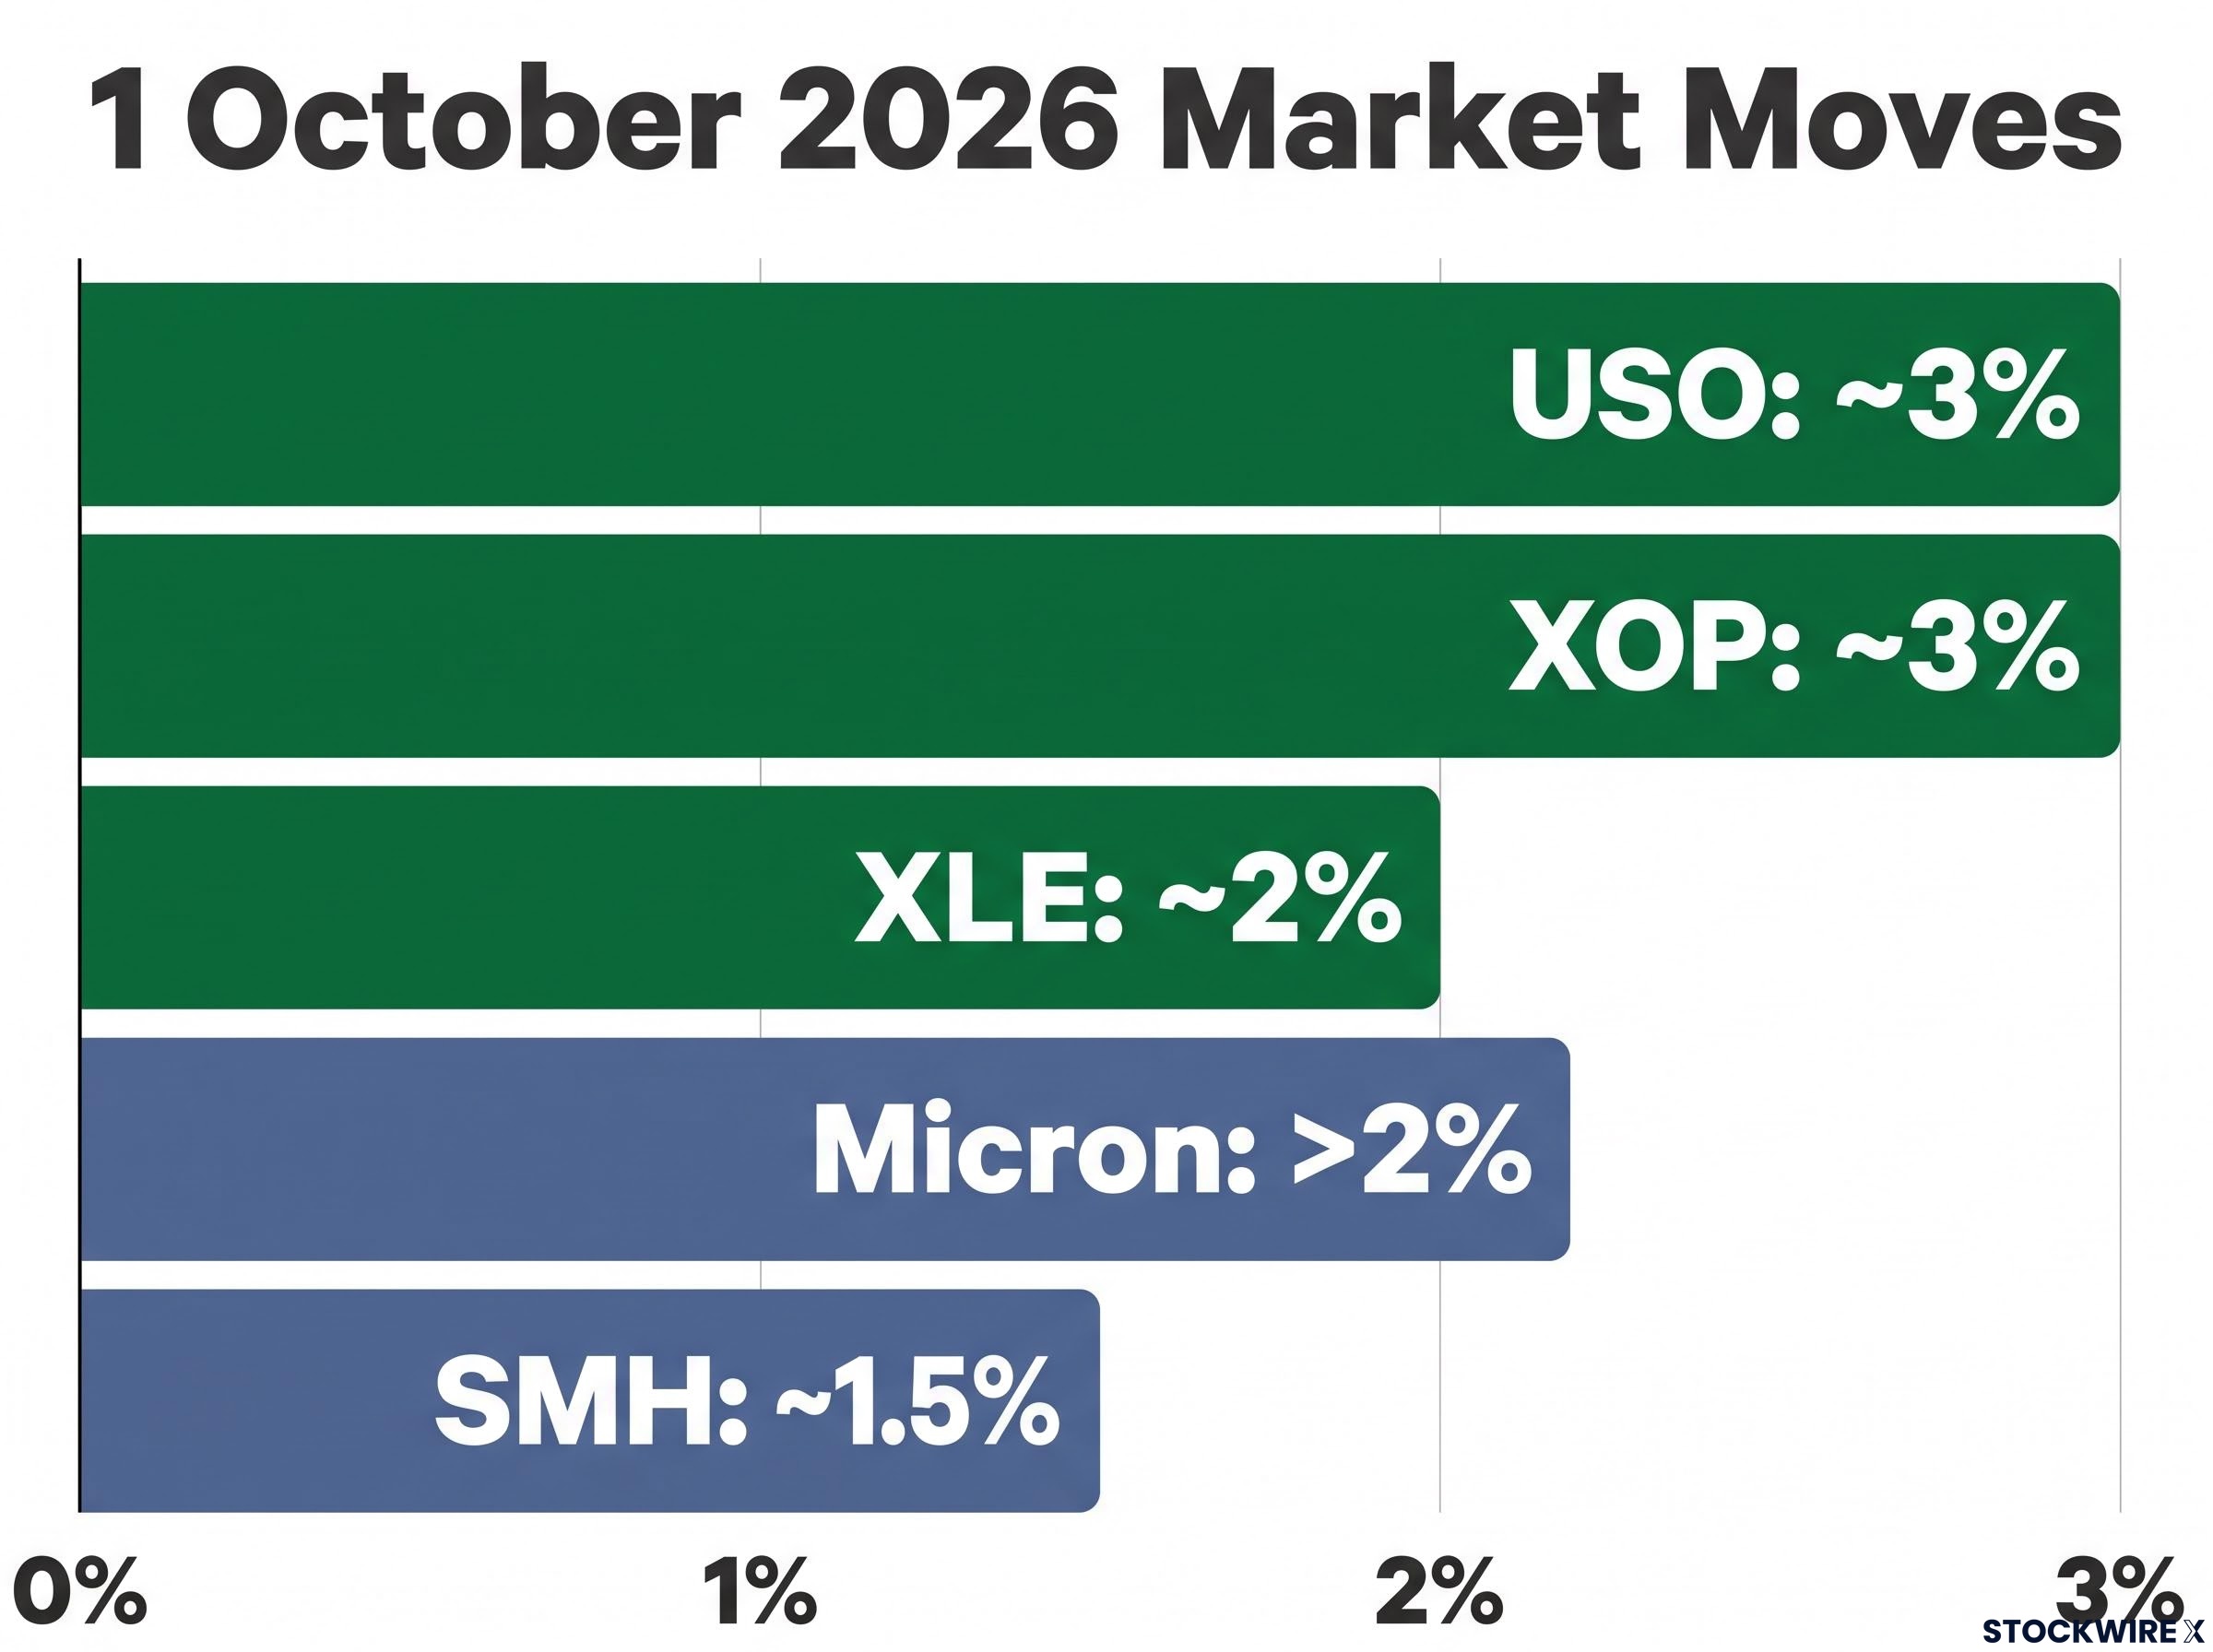
What made the session unusual was the backdrop. Major equity indices stayed in positive territory even as energy spiked on negative geopolitical headlines, which is not the risk-off pattern escalation typically produces. The analyst behind the original commentary also exited positions in EWY (South Korea ETF) as it turned range-bound and non-directional, while Micron closed up more than 2% and the SMH (Semiconductor ETF) gained roughly 1.5%, settling just below its midline resistance.
How Middle East escalation feeds into energy markets
The channel here is the Strait of Hormuz, a narrow transit route through which a large share of seaborne crude flows. When military risk near that chokepoint rises, traders price a higher probability of disruption into oil futures and upstream energy equities, lifting prices before a single barrel is physically blocked.
That is the mechanism driving these ETF moves: risk-premium repricing, not confirmed supply loss. Heightened tail risk alone is enough to push spot and forward oil higher, and energy ETFs follow.
The Hormuz shipping crisis illustrates exactly why risk-premium repricing precedes any confirmed supply loss: commercial transit volumes collapsed to 3-14 vessels per day against a pre-disruption baseline of 120-140, yet crude futures moved sharply on the threat alone, well before physical barrel flows were formally interrupted.
The counterargument matters just as much. These spikes can reverse quickly if physical supply stays intact, if non-OPEC production such as US shale absorbs the perceived risk, or if policy responses like strategic reserve releases step in.
Guardian reporting on Strait of Hormuz disruption places Brent crude back above $100 a barrel on 1 October 2026, providing the specific price-level context behind the ETF moves and confirming that the risk-premium repricing in USO and XOP reflected genuine forward market concern rather than thin-volume noise.
The fact that broad indices stayed green while energy jumped tells you the market is currently compartmentalising this as a sector-specific catalyst rather than a systemic shock. If you are holding oil-sensitive positions, the question to watch over coming sessions is whether that compartmentalisation holds or whether the risk starts bleeding into the wider tape.
Cutting exposure from 140% to 95% before the jobs report
One active manager responded to the week’s risk density with a concrete decision rather than a forecast: reducing total portfolio exposure from roughly 140% down to approximately 95% ahead of the jobs report, explicitly as event-risk management.
The de-risking move Total exposure cut from ~140% to ~95% ahead of the 2 October jobs report.
The release itself arrives Friday, 2 October 2026, at 8:30 a.m. ET, per the Bureau of Labor Statistics. The number the market is benchmarking against is a consensus of approximately +90,000 nonfarm payrolls for September, drawn from Reuters coverage of ADP private payrolls data, a sharp slowdown from August’s +162,000 gain.
Beyond the headline payrolls figure, NFP report internals including average hourly earnings, prior-month revisions, and the unemployment rate trajectory carry more Fed-policy signal than the top-line number alone, and a wages surprise can move cross-asset markets sharply even when the headline lands in line with consensus.
Here is the logic behind trimming before a print like this:
- A consensus of +90,000, nearly half August’s gain, sets a low bar for a surprise in either direction, making the data likely to move markets.
- Crowded positioning amplifies gap risk at the open, and macro-sensitive strategies are especially exposed to any shift in Fed-policy expectations.
- Re-entry timing is manageable if the data land cleanly, which keeps the opportunity cost of stepping aside contained.
The trade-off is real. If the print lands in line and the reaction is benign, reduced exposure means giving up upside, and re-entering into choppy post-data price action is its own challenge.
A forecast that nearly halves the prior month’s gain means the asymmetry of risk around this number is unusually high. If you are carrying leveraged or macro-sensitive positions, the move from 140% to 95% is a visible example of how professionals treat binary events as insurance problems, not forecasting exercises, and it gives you a benchmark for your own pre-event posture.
What the rest of this week’s event stack means for positioning
Three catalysts, three different engines, one compressed window. Nike earnings, an unresolved geopolitical escalation, and the September payrolls print are all landing inside the same few sessions, which shortens the timeline for every position decision an investor needs to make.
In time-priority order, the risks line up like this:
- Jobs report (2 October, immediate): The most proximate catalyst, with consensus at roughly +90,000 and a low bar for a market-moving surprise.
- Nike earnings (near-term): With 87 million shares short, the reaction potential is outsized in either direction.
- Energy and geopolitical escalation (ongoing, contingent): The most dependent on whether the Middle East situation worsens or stabilises.
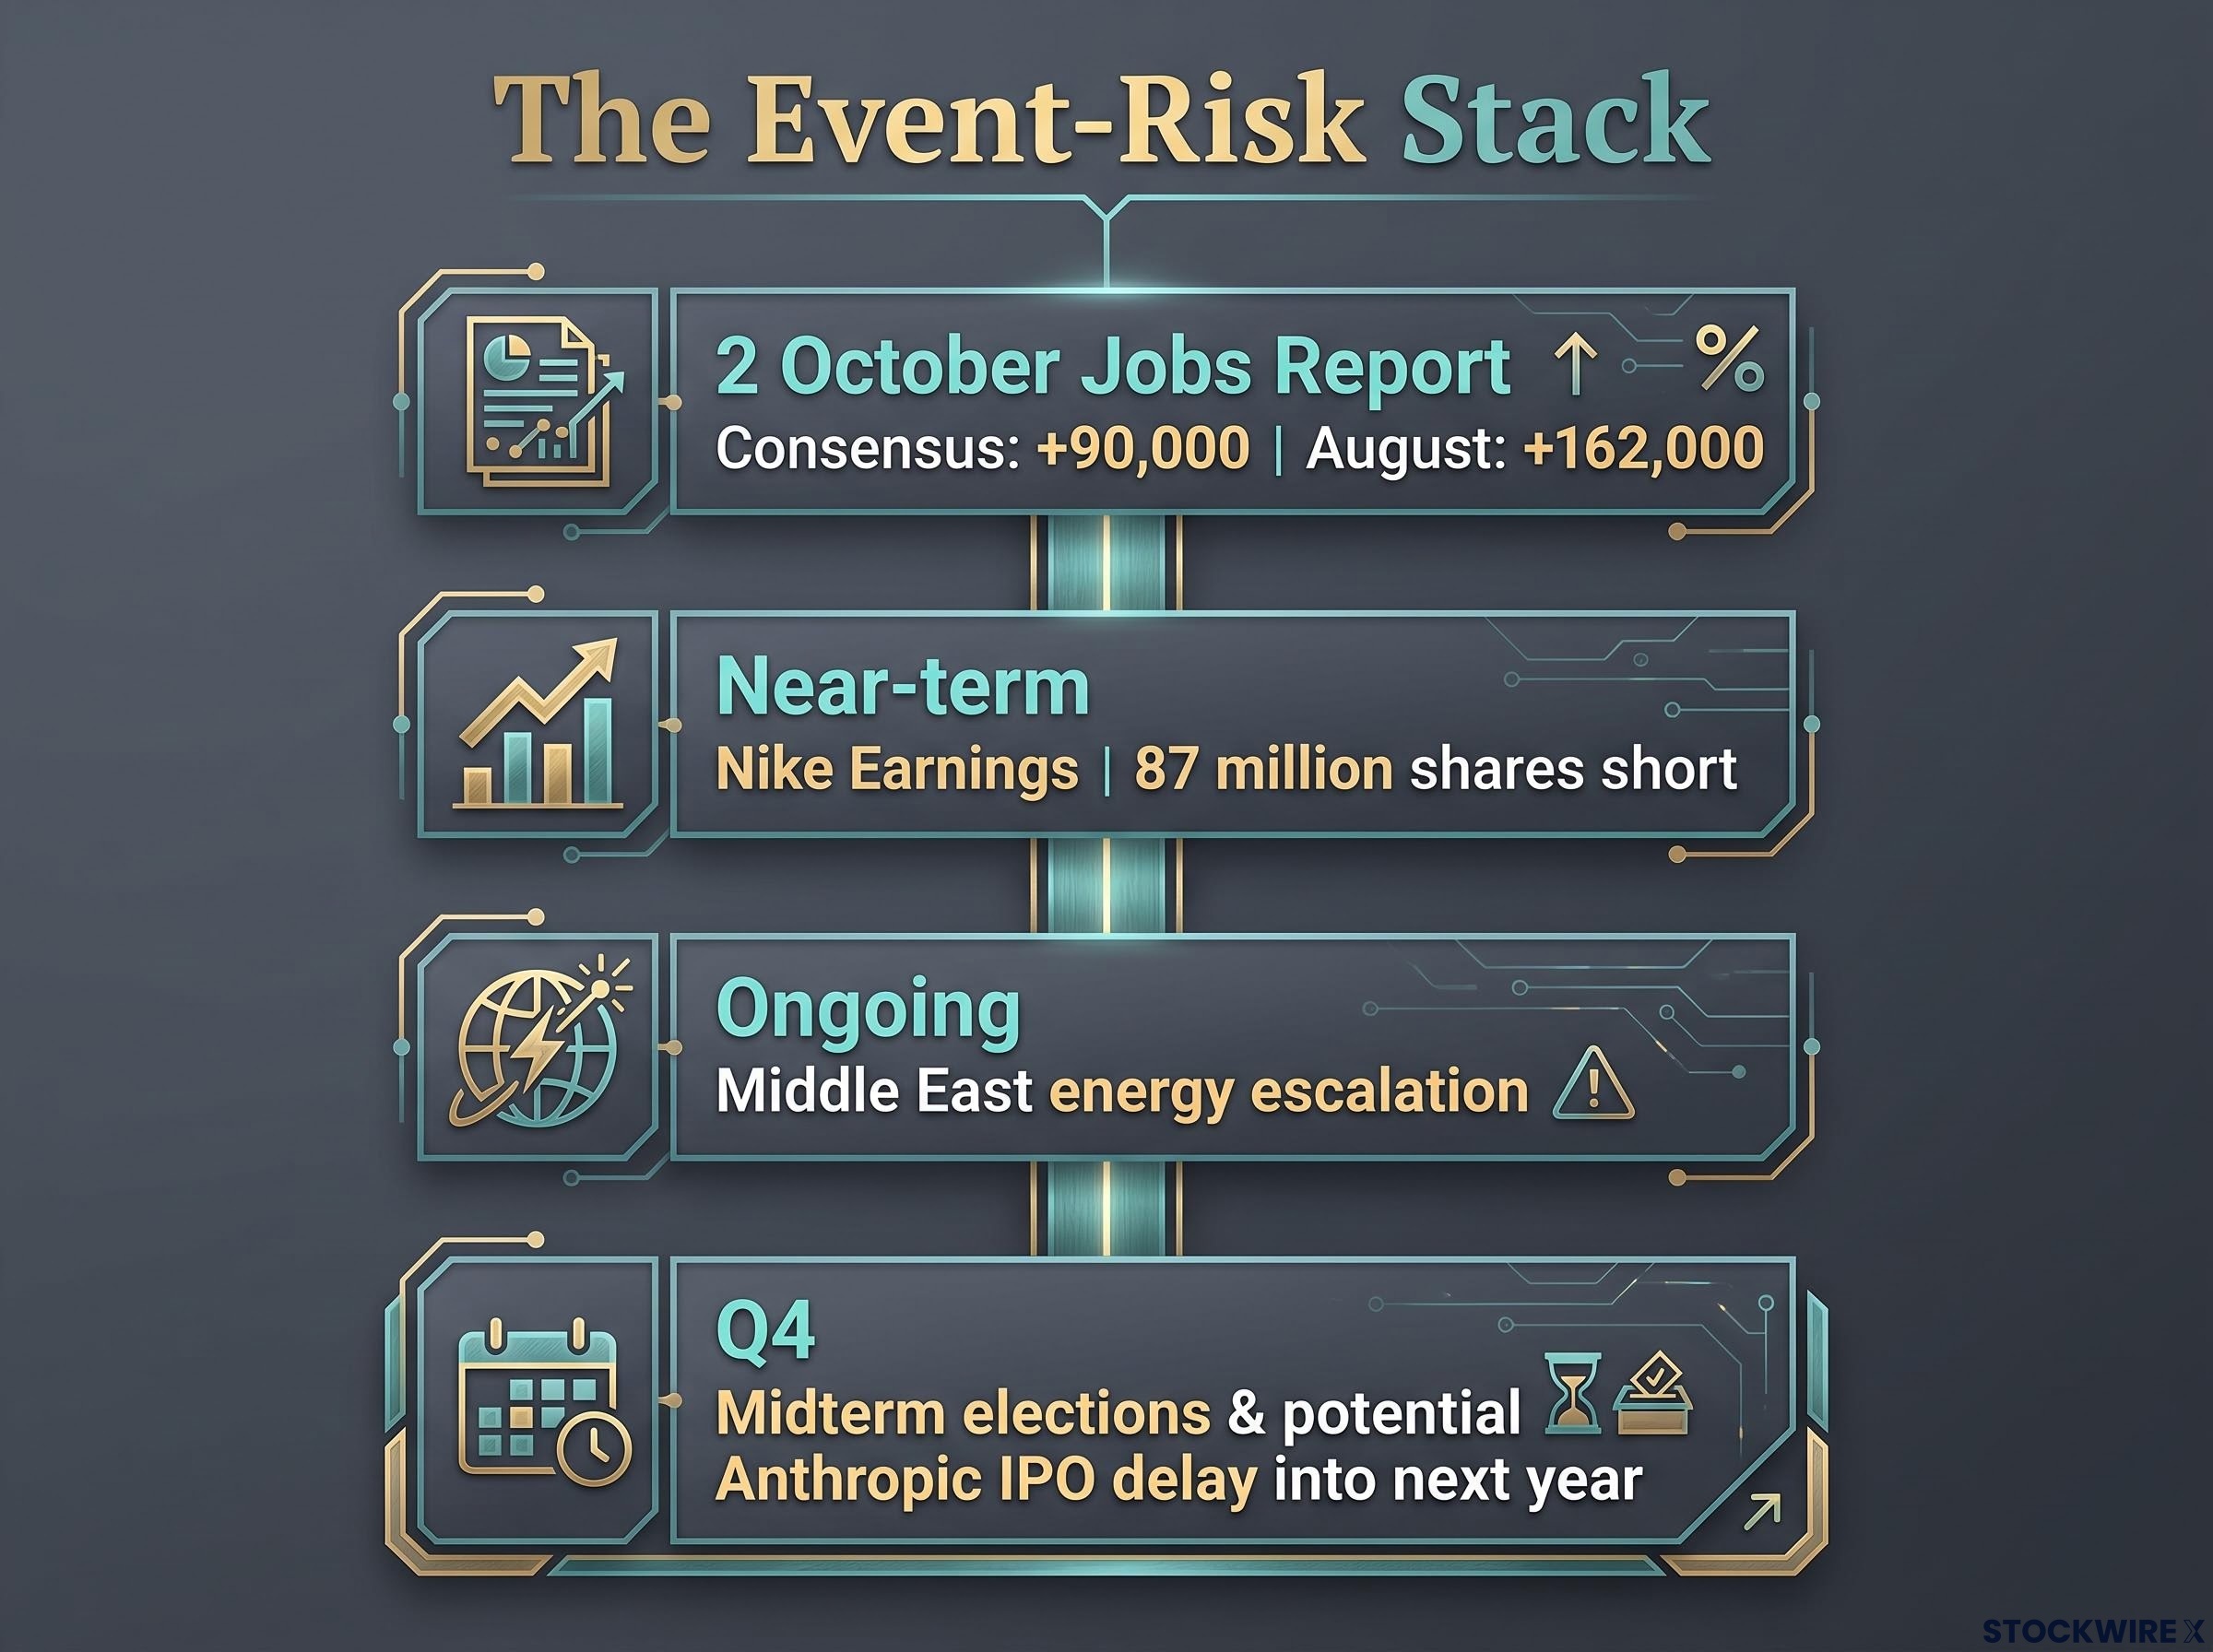
The analyst also flagged the midterm elections as a further Q4 variable, describing the quarter as likely to be an exceptionally notable one for markets and noting that post-election developments could delay an anticipated Anthropic IPO into next year. That is a signal this week sits at the front edge of a more volatile stretch, not in isolation.
Election-cycle volatility, measured by full-year S&P 500 realised volatility in election years averaging just 14.8% against a 14.1% non-election-year baseline, is a smaller structural factor than most investors assume, though the midterm window the analyst flagged can compress liquidity and amplify reactions to coincident catalysts like the payrolls print.
What all three threads tell you is that position sizing calibrated for a single-event week may be the wrong size once the full density is accounted for. The practical read is to know your exit levels before each catalyst arrives rather than reacting to outcomes in real time.
This article is for informational purposes only and should not be considered financial advice. Investors should conduct their own research and consult with financial professionals before making investment decisions. Financial projections and forward-looking statements are speculative and subject to change based on market conditions and various risk factors.
Three catalysts, one risk management lesson
Nike’s decline, the oil spike, and the pre-payrolls de-risking are each significant on their own terms. Their convergence in a single week is the real story, and it argues for treating each as part of a broader event-risk stack rather than a standalone headline.
The jobs print lands Friday morning. How markets absorb it will shape whether the energy trade extends, whether Nike shorts press further ahead of earnings, and whether Q4 opens with the volatility the analyst anticipates heading into the midterms.
The takeaway is not a hedge. Knowing your risk posture before binary events, rather than scrambling after them, is what separates deliberate portfolio management from reactive trading. This week offers three clean tests of exactly that discipline.
For investors wanting to understand the specific options structures professionals use ahead of market-moving data releases, our dedicated guide to hedging binary events covers calendar spreads, diagonal adjustments, and hard-asset allocations with worked examples showing how each structure manages time decay across a volatile window.