Most volatility traders spend their days watching the VIX. Cem Karsan thinks that is the wrong screen to be looking at right now.
Equity index implied volatility has compressed sharply through 2025 and sits near multi-year lows heading into 2026. Yet Karsan, managing partner at Kai Volatility Advisors, has built a structured cross-asset view that cuts against the equity-first instinct: rate and foreign exchange volatility are the opportunity, equity index vol is the near-term trap, and a severe equity dislocation is likely within roughly nine months.
The view is not simply directional. It rests on the mechanics of how volatility is manufactured, suppressed, and eventually released across different asset classes.
This piece walks through the architecture of that thesis, from the cross-asset volatility hierarchy to the structural role of JPMorgan’s hedged equity rolls. By the time you finish, you will have a clear framework for where volatility opportunity and volatility risk currently sit, and why the two are not in the same place at the same time.
Why rate and FX volatility are beating equity vol right now
On the surface, 2025 looked like a story of synchronised movement. The three major volatility complexes, equity, rate, and currency, spiked together in early 2025 and then declined together through the rest of the year.
The Cboe VIX (equity volatility), the ICE BofA MOVE Index (Treasury options volatility), and the Deutsche Bank FX Volatility Indicator all jumped during the February to March 2025 stress episode, then trended lower with occasional elevations in May, September, and October. Cross-asset co-movement that tight tells you the three markets were reacting to the same macro pulse.
The divergence hides inside the normalisation.
| Volatility index | Start of 2025 | 2025 peak | Year-end 2025 | Decline from start |
|---|---|---|---|---|
| VIX (equity) | ~28 | ~48 | ~14-14.17 | ~50% |
| MOVE (rates) | ~95 | ~135 | ~58-58.5 | ~38% |
| DB FX Vol (currency) | ~8.7 | ~10.5 | ~6.73-7 | ~23% |
Equity vol fell hardest and fastest relative to where it started. The VIX roughly halved, while MOVE declined around 38% and FX vol only around 23%. By year-end, equity vol sat closer to its long-run troughs than either rate or FX vol, even though all three were well below their intra-year peaks.
That gap matters for you if you are positioning for volatility exposure today. The equity index is where the market has priced out the most risk, which makes rate and FX vol the comparatively underpriced categories. This is the foundation of Karsan’s hierarchy: FX volatility is his preferred category over both the next year and the next several years, rate vol is rising and expected to eventually close its gap sharply, and equity index vol is structurally suppressed in the near term.
There is a reason this hierarchy sharpens under stress. Research on the macro-to-FX transmission chain finds a regime-dependent relationship between equity and rate vol.
Under normal conditions, the VIX leads the MOVE Index. But when both exceed their 75th percentile simultaneously, the relationship reverses: the MOVE Index leads, and rate volatility becomes the primary risk barometer.
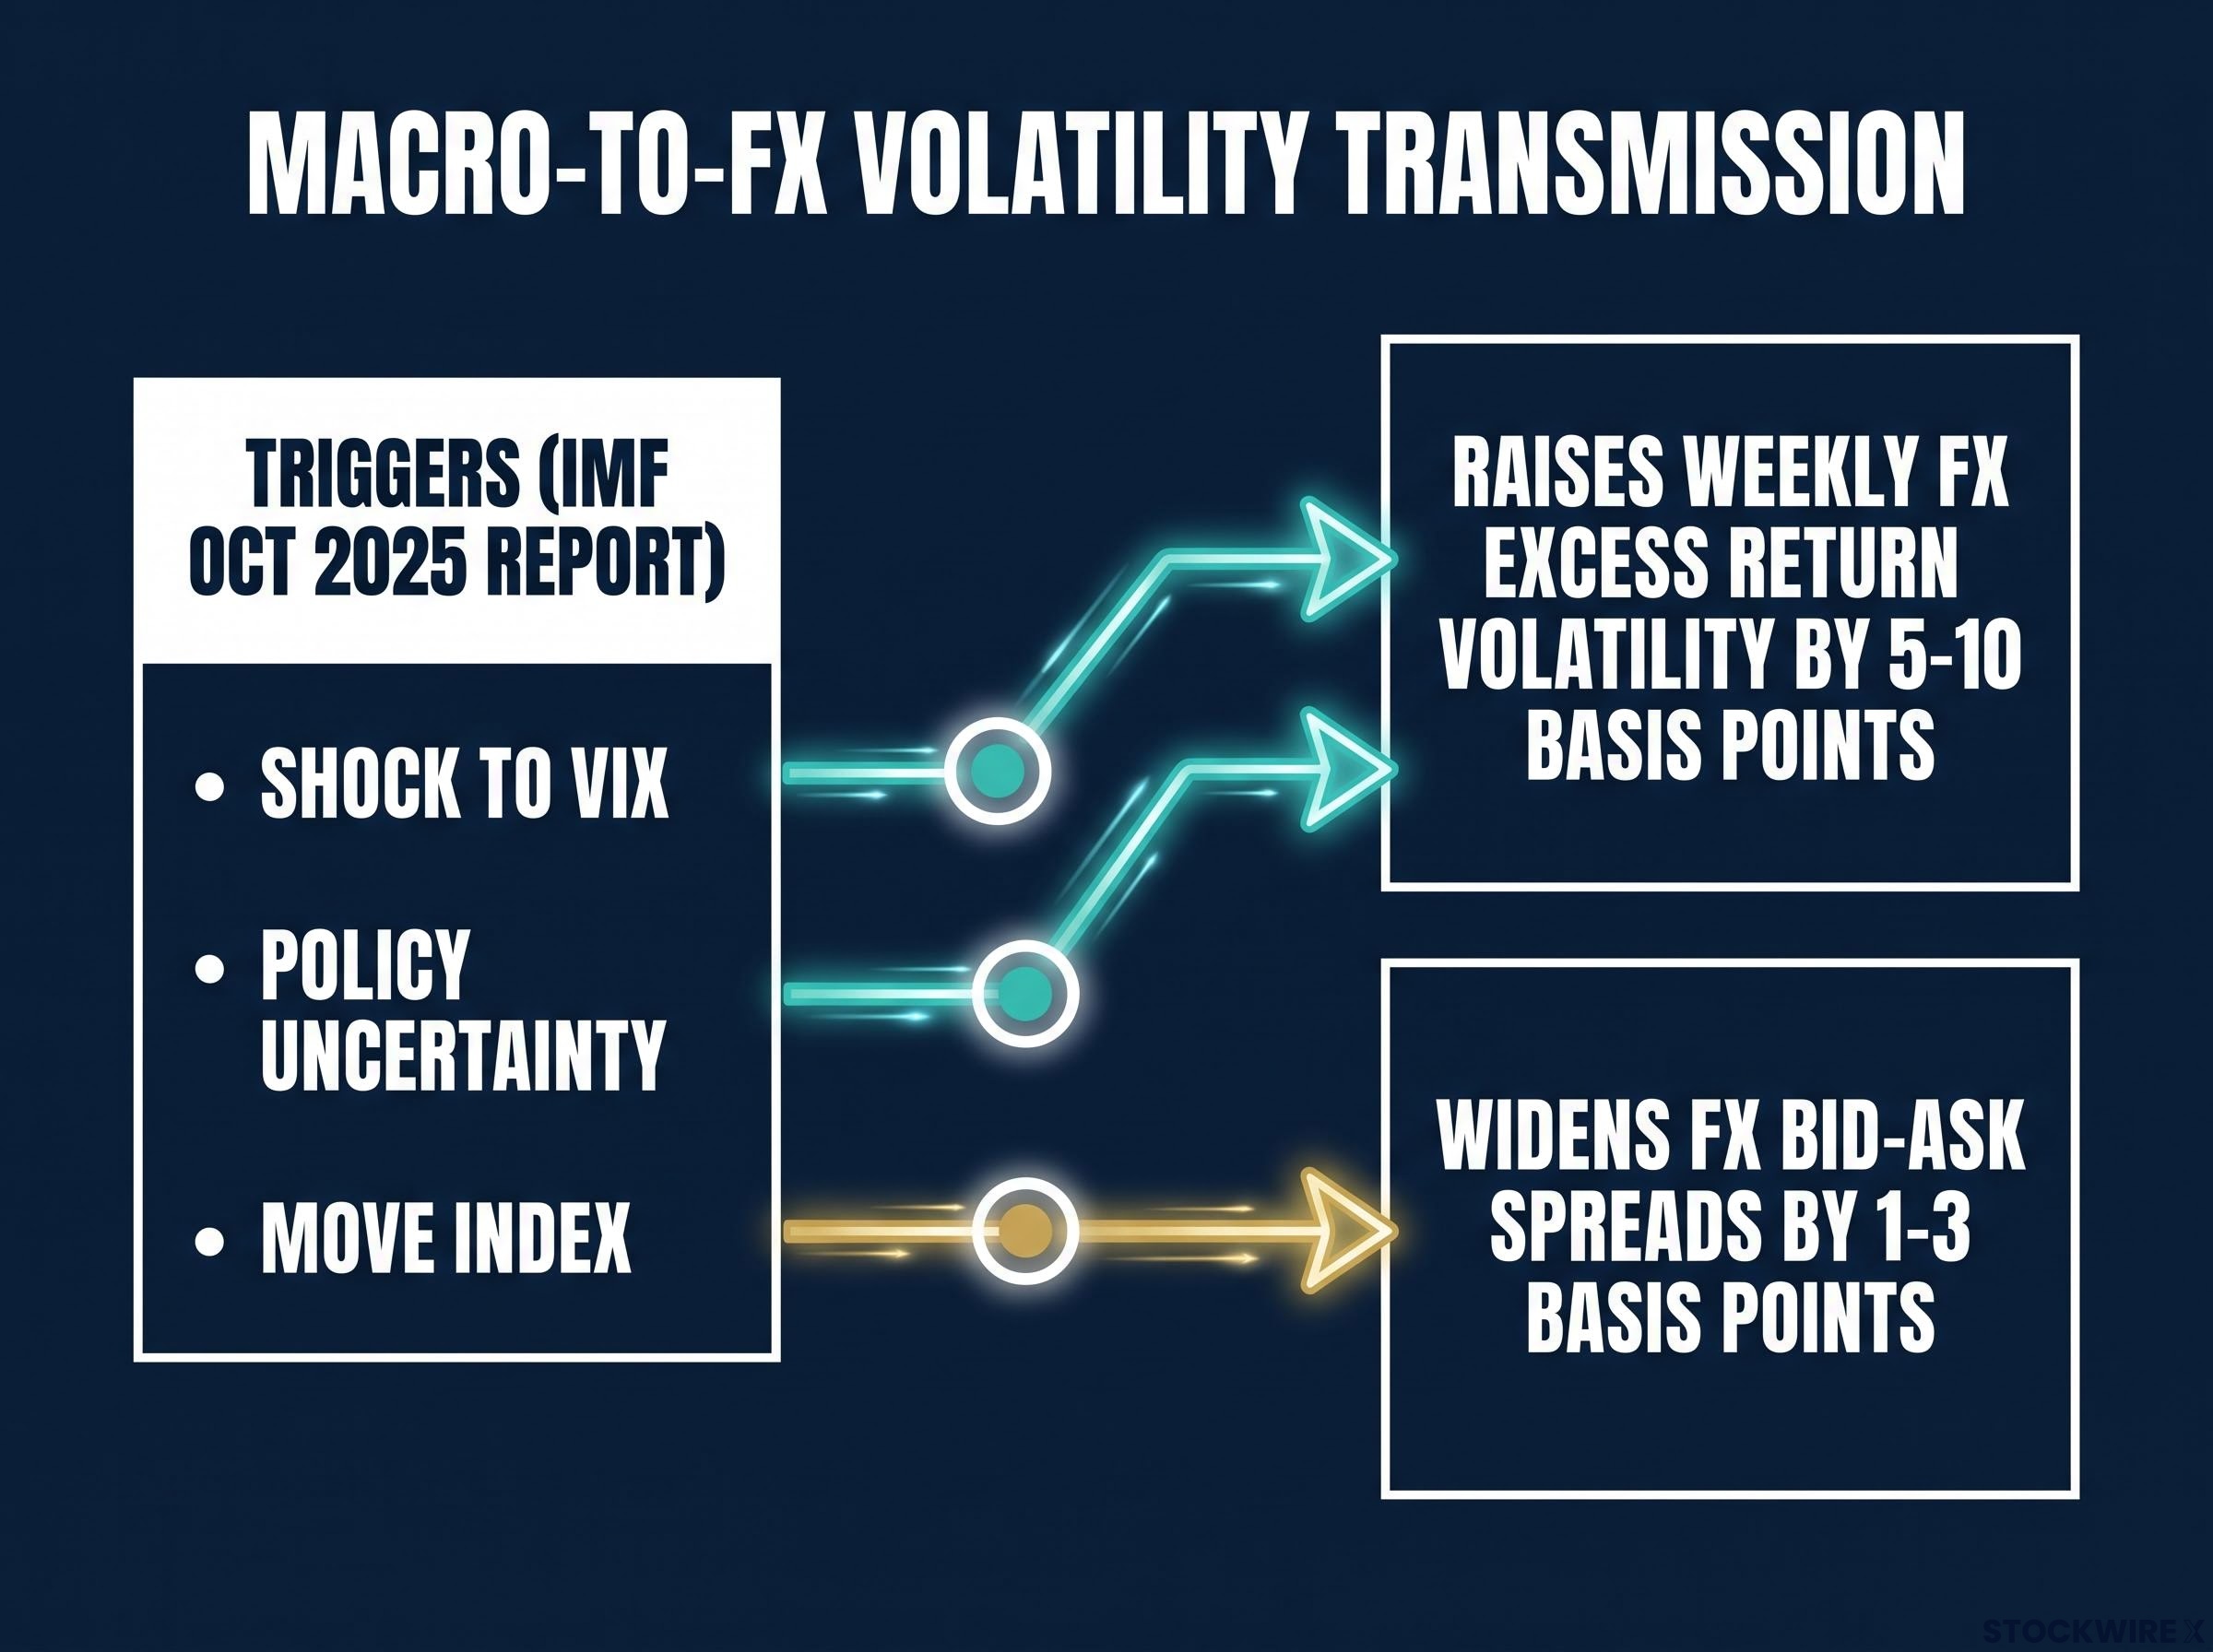
The IMF’s October 2025 Global Financial Stability Report put numbers on how this spreads. A shock to the VIX, policy uncertainty, or the MOVE index raises weekly FX excess return volatility by 5-10 basis points and widens FX bid-ask spreads by 1-3 basis points. Rate and equity stress leaks into currency markets, which is precisely why FX vol can stay relevant even after equity vol normalises.
IMF cross-asset spillover research quantifies how equity and rate stress transmits into currency markets, finding that a shock to the VIX or MOVE index raises weekly FX excess return volatility by 5-10 basis points and widens FX bid-ask spreads by 1-3 basis points, which is why FX vol can remain elevated even after equity vol normalises.
Gold vol and the credit spread signal
Karsan also includes gold volatility among his favoured holds over the coming year, sitting alongside rate and FX vol in the attractive tier.
There is a credit dimension too. Credit default swap spreads and interest rate volatility have been rising together and tend to move in correlation, which adds weight to the rate vol thesis. When the cost of insuring corporate debt climbs in step with rate uncertainty, it suggests the pressure building in fixed income is not isolated to Treasuries.
When big ASX news breaks, our subscribers know first
How the JPMorgan hedged equity machine suppresses equity index volatility
To understand why equity index vol is so compressed, start with what one of the market’s largest systematic option sellers actually does every quarter.
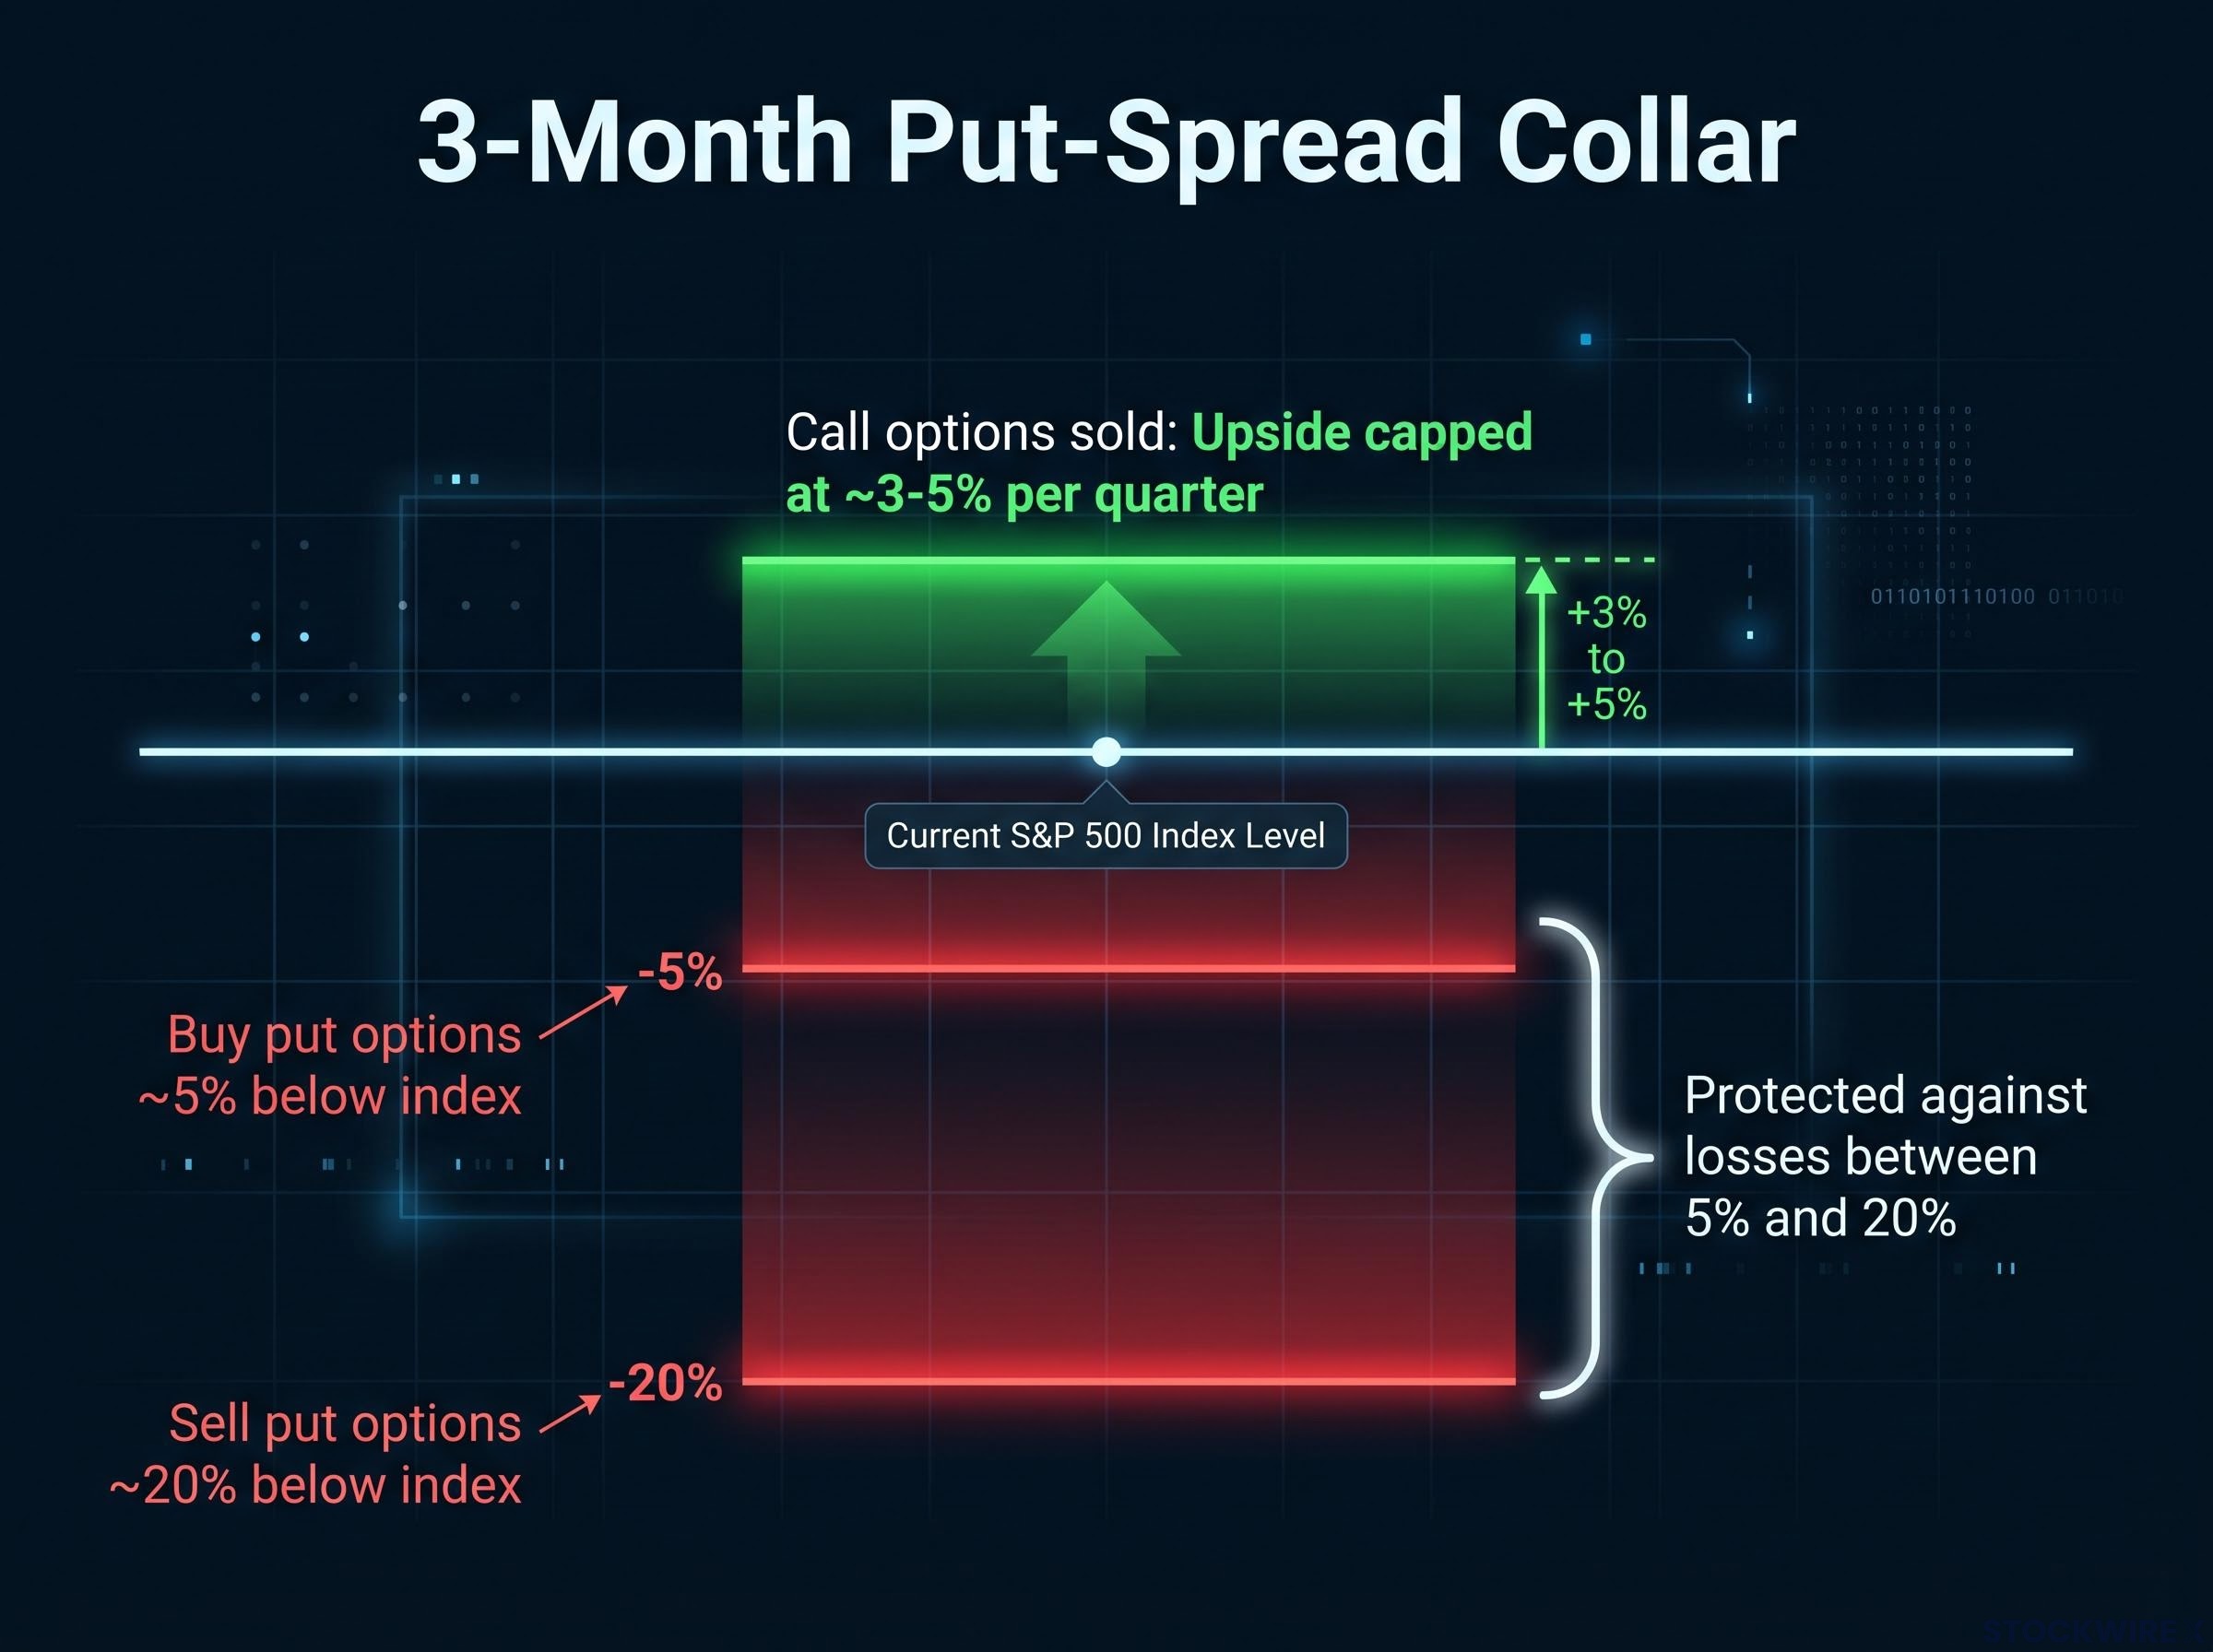
JPMorgan’s Hedged Equity Fund complex runs a three-month “put-spread collar” overlay on an equity portfolio that tracks the S&P 500 closely. The structure follows a clear sequence:
- Buy S&P 500 index put options with strikes roughly 5% below the index level, establishing downside protection.
- Sell put options approximately 20% below the index, which partially funds the purchased puts and caps protection at that lower bound.
- Sell call options to further fund the spread, which caps upside participation historically around 3-5% per quarter.
The result is a portfolio protected against losses between 5% and 20% over each three-month period, paid for by giving up most of the upside.
The scale is what makes it matter to the whole market. Karsan estimates the complex at between $30 billion and $40 billion in notional exposure across expirations. Reported flagship fund assets sit near $21 billion, with the difference reflecting total complex notional across all vehicles and expiration dates rather than a single fund’s balance sheet.
Those vehicles reset on a staggered calendar:
- Flagship Hedged Equity resets on the last business day of each quarter.
- Hedged Equity 2 resets at the end of January.
- Hedged Equity 3 resets at the end of February.
Karsan characterises the quarter-end roll as “by far the largest and most market-impactful” iteration of the trade.
Here is where the vol suppression becomes an inevitable mechanical consequence rather than a market anomaly. At each reset, the funds sell a large, predictable block of index puts and calls at known strikes and maturities. Increasing the supply of options at those specific points pushes implied volatility lower there, all else equal.
Low VIX readings have historically been misread as signals of genuine calm, but approximately $1.5 trillion in short-volatility exposure from systematic strategies and structured product issuers is mechanically manufacturing the compressed headline number without reducing underlying economic risk.
Because reset dates are public, other traders anticipate the flow. Karsan notes that implied volatility historically compressed in the week before the roll, but growing front-running has shifted the pattern so that vol now often begins rising ahead of that compression phase. For a recent reference point, the prior quarter’s strike sat around 78.90, with the anticipated December expiration strike estimated at roughly 4% to 4.5% above the market level at month-end.
For anyone trading index volatility, the roll calendar functions as a structural gravity event. Knowing where and when that gravity operates tells you when index vol is most mechanically suppressed and, just as usefully, when it is most likely to lift.
What the collar flows do to implied correlation and skew
The hedged equity funds trade index-level options, not single-stock options. That distinction is the key to the second-order effects.
Because the supply pressure falls on index vol rather than single-name vol, it mechanically widens the gap between the two and tends to push implied correlation lower. Index vol gets suppressed while single-name vol stays where it is.
There is a skew effect as well. Persistent supply of out-of-the-money index puts can flatten downside skew at the index level, which can make index tail hedges relatively cheaper than they would otherwise be. That is a quiet gift to anyone looking to buy index protection, provided other hedging flows do not overwhelm it.
What implied volatility actually is, and why its structure across maturities matters
Before the tail risk thesis and the correlation trade make sense, you need the vocabulary the trades are built on. Start with implied volatility itself.
Implied volatility is the market’s forward-looking expectation of how much an asset’s price will move, embedded in the price of its options. It is distinct from realised volatility, which is backward-looking and measured from actual price history.
Implied volatility is the market’s forward-looking expectation of how much an asset’s price will move, embedded in the price of its options, and if the mechanics of how that number is derived from live option prices are unfamiliar, the explainer on implied volatility covers the reverse-engineering process from first principles.
- Implied volatility: forward-looking, derived from what traders are willing to pay for options today.
- Realised volatility: backward-looking, calculated from how much prices have actually moved.
Options prices do not carry a single implied volatility figure. Near-dated options typically price at different implied vol levels than longer-dated ones, and the shape of that curve across maturities is the volatility term structure. The slope of the curve carries information about how the market is pricing risk over different horizons.
Then there is implied correlation. This is the average correlation among an index’s constituent stocks that is implied by the relationship between index volatility and single-name volatility.
The mechanics are precise. Index variance equals a weighted sum of single-name variances plus correlation-weighted cross terms. So when index vol is suppressed while single-name vol stays elevated, implied correlation falls. According to Cboe’s implied correlation framework, that falling correlation is exactly when dispersion trades, which are long single-name vol and short index vol, become more attractive. Cboe describes this as “selling correlation” through options.
Dispersion trades, which are long single-name vol and short index vol, have become a primary vehicle for extracting value from this structural gap, with calendar spreads the preferred structure when near-term index vol is mechanically pinned but longer-dated vol remains available at a premium.
Here is why this ties directly back to the previous section. When you see equity index vol suppressed by structural collar flows while single-name vol holds up, you are watching implied correlation fall in real time. That falling correlation is both the signal for and the source of the dispersion trade Karsan has favoured until now.
Term structure as a signal, not just a price
The shape of the term structure is itself a message. A flat or inverted curve, where near-dated vol sits at or above longer-dated vol, signals near-term uncertainty. A steeply upward-sloping curve, where longer-dated vol is elevated relative to the near term, signals the market is pricing tail risk further out on the horizon.
This is where Karsan’s positioning becomes a specific bet on the curve. Near-term equity vol is suppressed, but six-month to one-year vol is described as a strong buy. In plain terms, that is a wager on the term structure steepening, with the market eventually pricing in the risk that current flows are holding down.
The nine-month tail risk thesis and the transition from dispersion to index vol
This is where the framework turns from opportunity to warning. Karsan anticipates a sharp and severe equity market drawdown within approximately nine months, with early 2027 cited as a likely timing candidate.
The anticipated event is characterised as potentially comparable in severity to the COVID-related market dislocation of 2020.
The near-term and medium-term pictures split cleanly. While near-dated equity index vol is structurally compressed, six-month to one-year index volatility is described as a strong buy, with a preference for left-tail put options. Skew is already relatively elevated, yet Karsan still views a steep, rapid drawdown as likely within the forecast window.
The recommended positioning is sequenced rather than immediate. The idea is to wait until later in 2026 or early 2027 before shifting from long dispersion into a combined trade that sells implied correlation and uses the proceeds to fund index vol purchases. Karsan ties the transition to midterm elections as the inflection reference.
The logic rests on correlation. A COVID-comparable shock is expected to drive equity correlations toward unity, which is the environment where the combined short-correlation, long-index-vol trade pays off. Karsan describes this combined structure as offering favourable risk-reward with limited time decay cost, provided it is entered at the right point.
That proviso is everything. History shows what happens when correlation-spike risk is mistimed:
- COVID 2020: correlations moved close to one across sectors and regions, and many dispersion strategies suffered as diversification collapsed; a short-correlation leg paid off only if the long-vol exposure was large and timely enough.
- February 2018 “Volmageddon”: crowded short-correlation and short-vol positions accelerated the move to high correlation and high index vol, inflicting rapid mark-to-market losses before any long-vol exposure could deliver.
The trade Karsan is describing is not simply “buy puts.” It is a time-sequenced, cross-asset structure where the entry point and the balance between the short-correlation leg and the long-vol leg determine whether the position performs or becomes the crowded trade that loses money before it wins.
What can go wrong with the correlation-to-index-vol trade
The core vulnerability is path dependency. The short-correlation leg can suffer large losses precisely when the index vol leg is needed most, if a macro shock drives correlation to unity faster than the long-vol position can pay off.
The conditions matter in both directions:
- Attractive when: index vol is suppressed by systematic collar supply, single-name vol stays elevated, and the dispersion premium stays wide.
- Attractive when: the catalyst is near enough to justify holding the short-correlation risk.
- Attractive when: the long-vol leg is sized large enough to dominate the short-correlation loss during a spike.
- Dangerous when: correlation surges to unity before the position is fully built or the catalyst arrives.
- Dangerous when: the trade becomes crowded, as it was in 2018, accelerating the very move it is meant to profit from.
There is a structural wrinkle specific to today’s market. The hedged equity collar complex is a large systematic index option seller, so even in a high-vol regime its supply could partially offset index vol repricing. That creates a timing mismatch risk: the short-correlation leg could bleed while the collar supply delays the long-vol leg from delivering.
The institutional research adds a note of caution worth holding onto. The IMF and the Central Bank of Ireland frame cross-asset volatility transmission as meaningful but not catastrophic in isolation, and they treat vol indices as risk indicators rather than deterministic crisis predictors.
This article is for informational purposes only and should not be considered financial advice. Investors should conduct their own research and consult with financial professionals before making investment decisions.
Past performance does not guarantee future results. Financial projections are subject to market conditions and various risk factors, and the forward-looking views described here are speculative and subject to change based on market developments.
What the cross-asset vol hierarchy means before markets price in the next regime
Pull the three layers together and the playbook resolves into a sequence rather than a single call. Rate and FX vol are the current opportunity. Structural equity vol suppression is the near-term constraint. Longer-dated left-tail index puts are the medium-term hedge.
For anyone constructing or reviewing a volatility exposure strategy today, the practical takeaway is ordered: rate and FX vol now, longer-dated equity index left-tail positioning later in the year, and the correlation trade only when the catalyst is close enough to justify the short-correlation risk.
The thesis is observable enough that you can track it yourself. A handful of signals will tell you whether it is confirming or breaking down:
- MOVE and FX vol holding elevated relative to the VIX, keeping the cross-asset hierarchy intact.
- Implied correlation continuing to fall as hedged equity collar supply persists.
- Equity vol term structure steepening at the six-to-twelve-month tenor, confirming the medium-term bet.
- The MOVE-to-VIX ratio staying structurally wide.
That last signal is worth watching closely. At year-end 2025, with MOVE near 58 and VIX near 14, the ratio sat around 4:1, structurally higher than the roughly 3.4:1 reading at the start of 2025 when MOVE was near 95 and VIX near 28. That widening is consistent with Karsan’s view that rate vol has compressed less than equity vol on a relative basis.
The caveats remain real. The IMF and the Central Bank of Ireland frame elevated vol readings as risk indicators, not deterministic triggers, and the history of crowded short-correlation trades shows that timing the transition is the strategy’s primary vulnerability. Cross-asset frameworks like this one are rare in mainstream commentary, but their value lies in giving you observable variables to monitor, not a guaranteed outcome to bet on.
For investors translating the cross-asset vol hierarchy into concrete portfolio action, our full explainer on downside protection strategies covers the three-layer structure that professionals use, combining value equity selection, a tail-risk sleeve of deep out-of-the-money index puts, and a liquidity buffer to address different failure modes across a full market cycle.