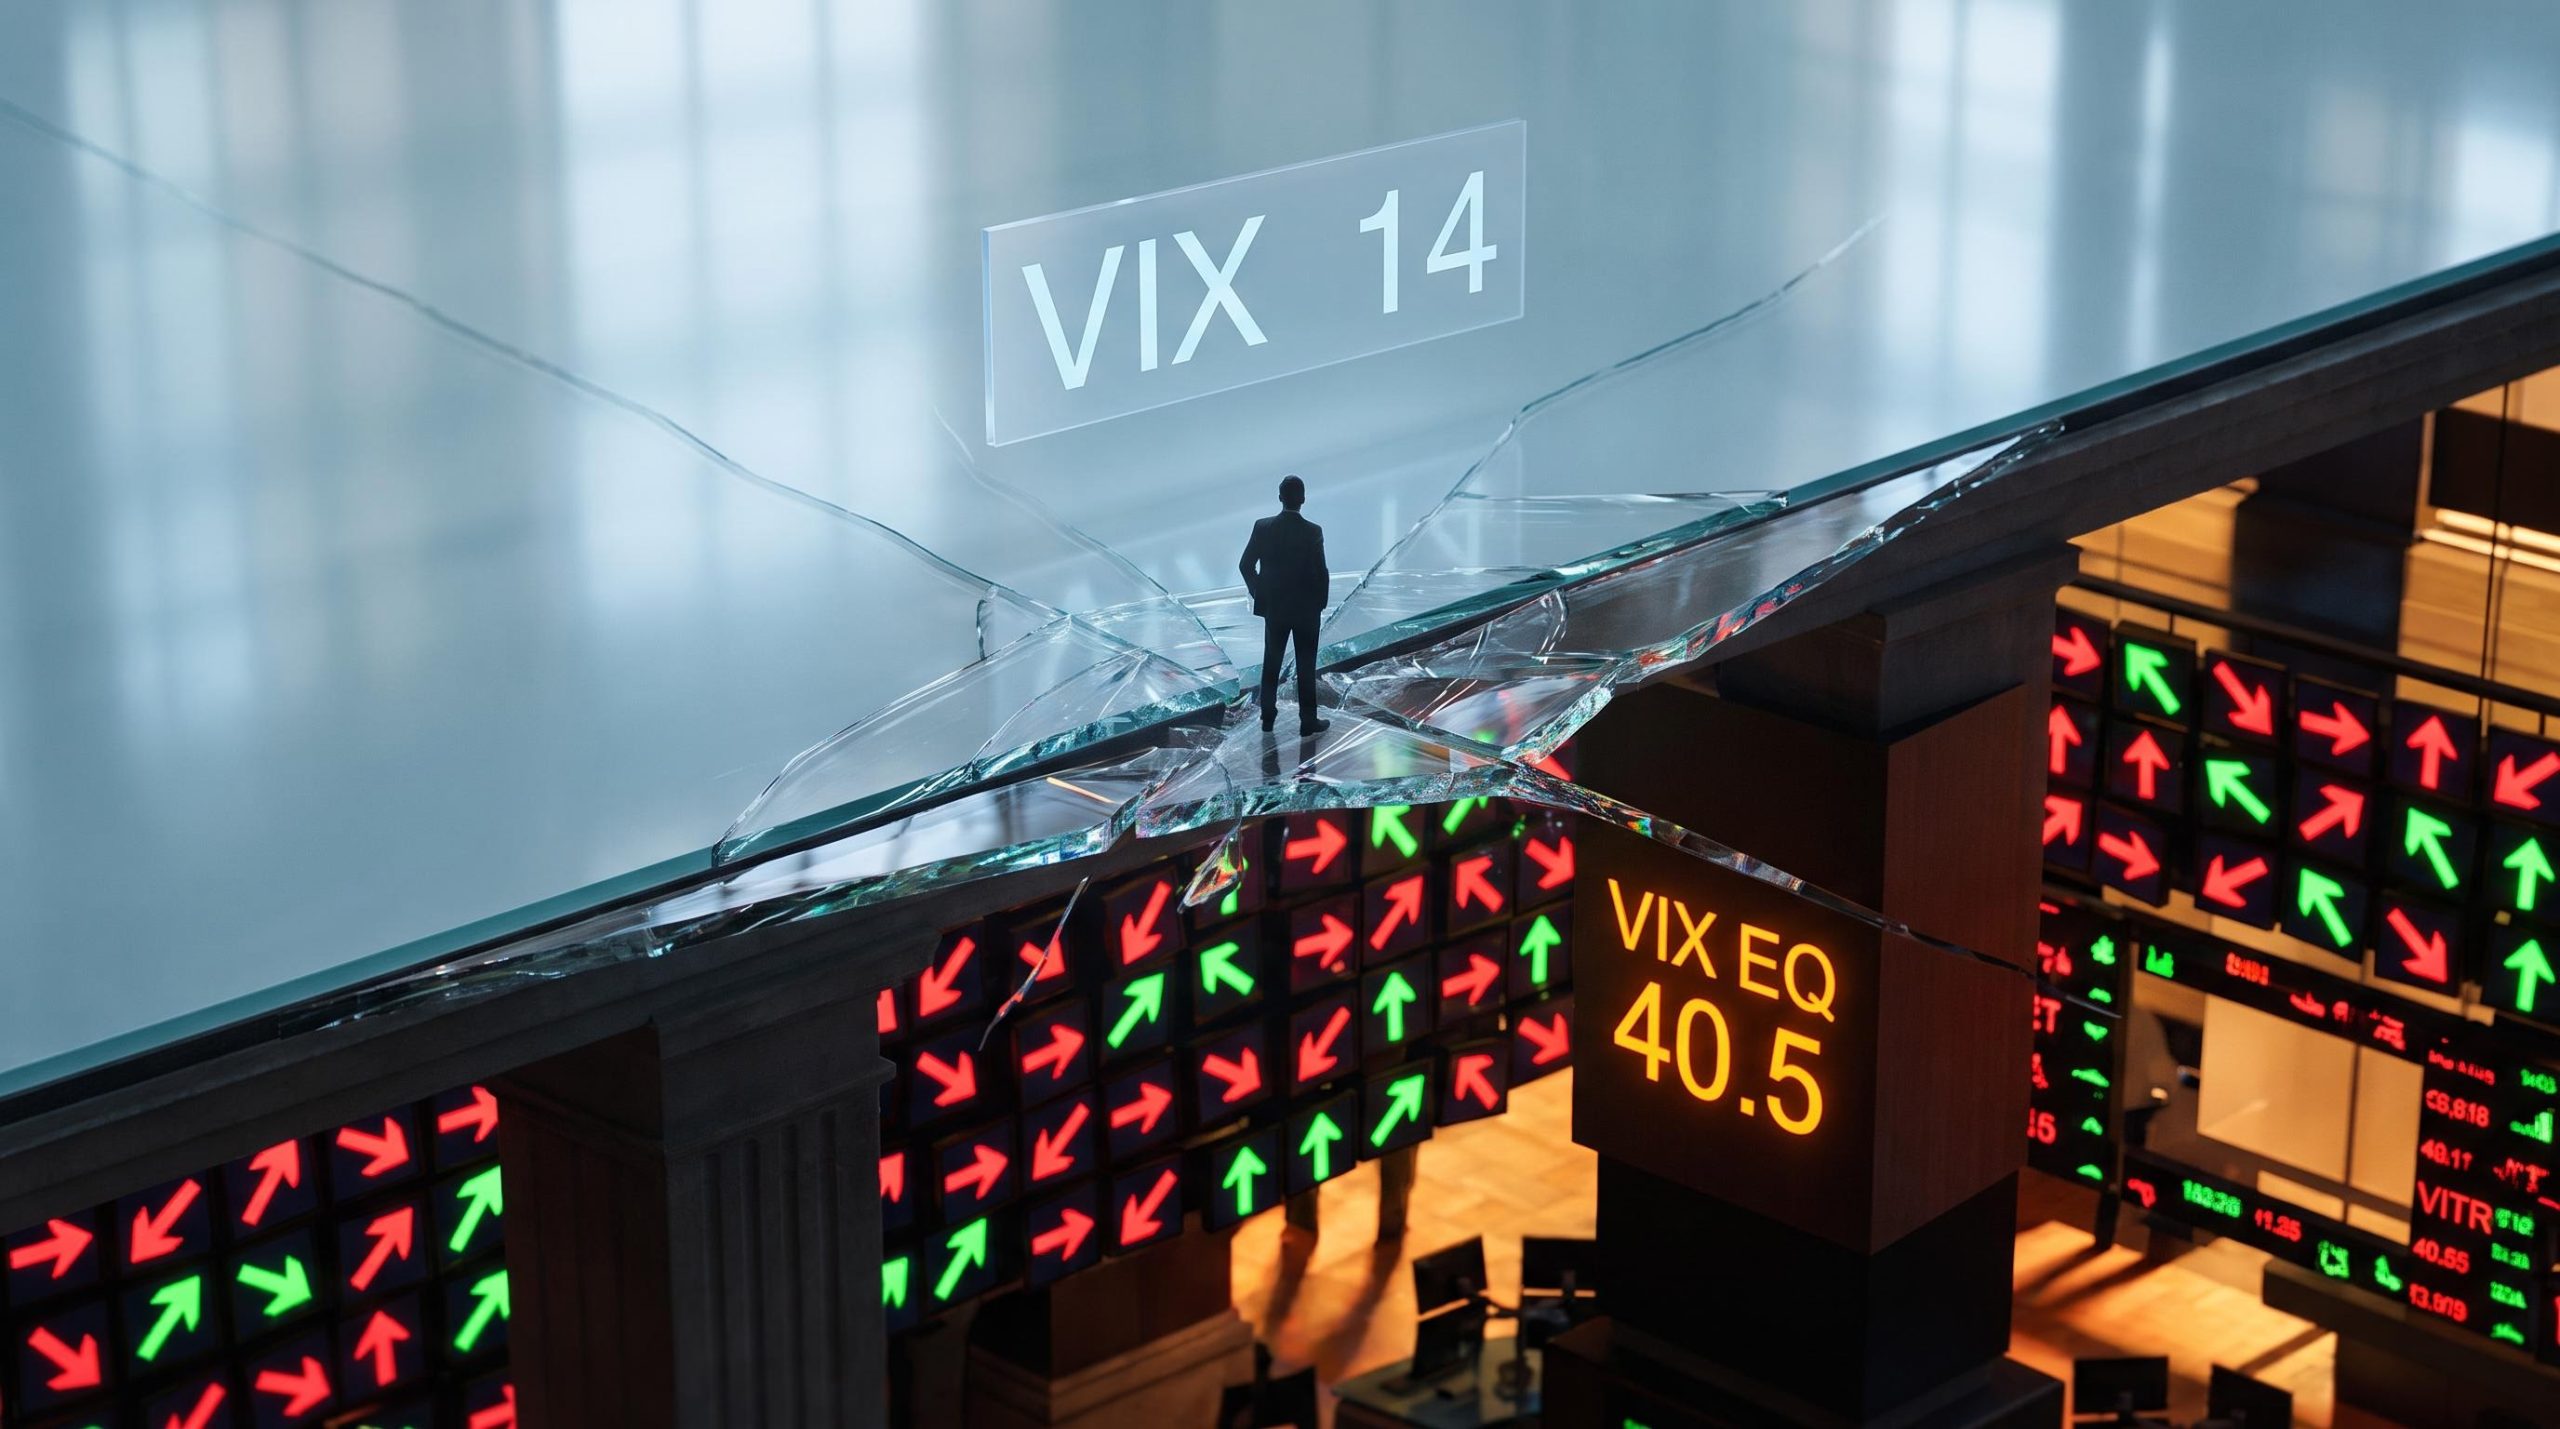
The S&P 500 looks calm. Through September 2026, the VIX has drifted around the 14-15 mark, near the low end of its range for the year. On paper, that reads as a market at rest.
Look one layer down and the picture changes completely. The headline index is being carried by a small cluster of mega-cap technology names, while a large share of individual stocks quietly struggles. The calm is real at the index level and an illusion everywhere else.
This gap between a placid headline number and chaotic single-stock behaviour is exactly what an options strategy built around market dispersion is designed to capture. Professionals are not fighting this environment. They are positioning to profit from it.
Here is what this covers: how dispersion mechanics suppress the VIX even as individual stocks swing violently, the metric professionals use to measure it, and the specific options structures (calendar spreads and VIX call spreads) that turn this divergence into a defined trade. You will finish knowing how to read a flat index correctly and what the professionals are actually doing beneath it.
The breadth divergence hiding in plain sight
A single trading session in September 2026 told the whole story. Meta shares climbed roughly 4.5%. A MAG 7 exchange-traded fund tracking the largest technology names rose about 0.67%. Yet the Invesco S&P 500 Equal Weight ETF (RSP), which weights every constituent equally rather than by size, fell around 0.4% on the same day.
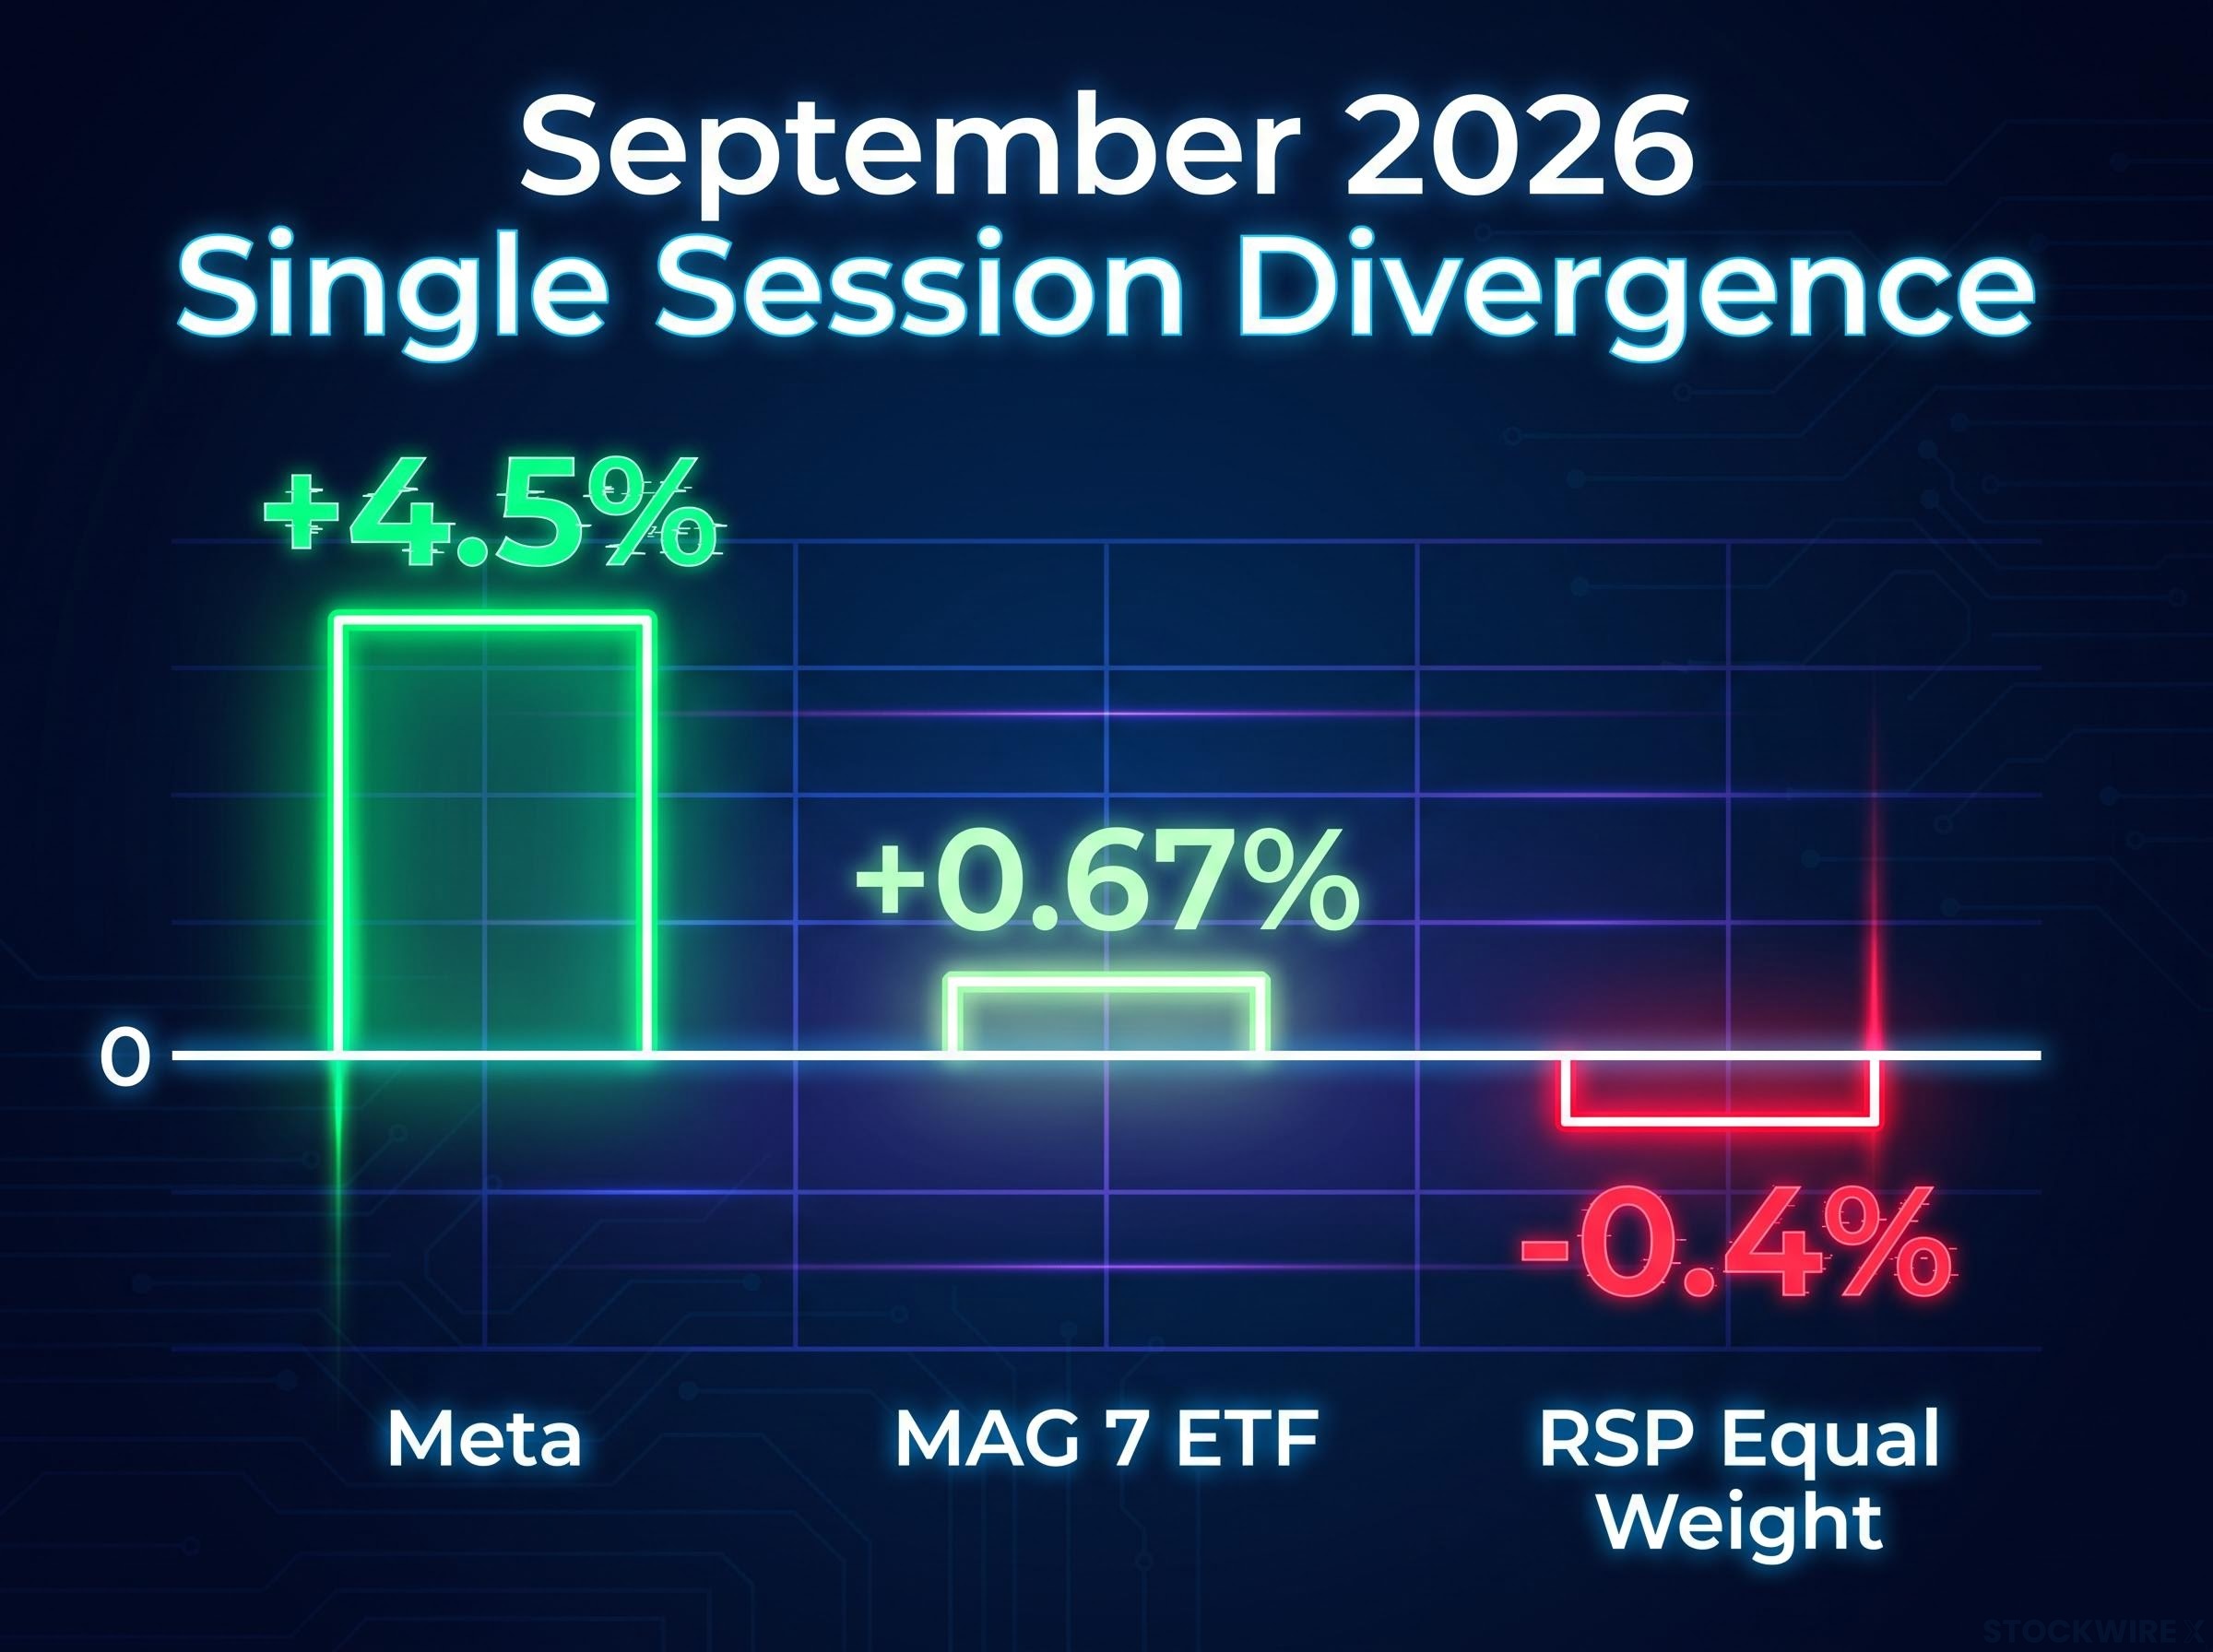
Read those three numbers together and the divergence is impossible to miss. The heavyweights were up. The average stock was down.
That is the breadth problem in miniature. When a handful of giants drive the index higher, the headline number tells you almost nothing about how the other 490-plus companies are actually performing.
Market breadth deterioration of this scale has historically preceded pullbacks: only 22% of S&P 500 stocks outperformed the index over the 30 days through early May 2026, the lowest breadth reading in 30 years, with historical data linking sub-25% breadth to 5-15% drawdowns roughly 80% of the time within 60 days.
The volatility data confirms it. According to JPMorgan Asset Management’s March 2026 note, “What’s happening to stocks beneath the index?”, the VIX EQ (a measure of implied volatility at the individual S&P 500 stock level) sat at 40.5. For the five years before the pandemic, that same gauge averaged 25.6. Single-stock fear was running hot even as index fear stayed cool.
The reason the two can diverge so sharply comes down to correlation. JPMorgan’s data showed the rolling three-month average pairwise correlation among S&P 500 stocks had collapsed to just 13%, lower than it had been 98% of the time since 2022. When stocks stop moving together, their individual swings cancel out at the index level.
Record-low stock correlation is not merely a volatility phenomenon: the COR3M implied correlation index hit 7.19 on 10 July 2026, and one-month realised correlation printed as low as 0.4% in late July, confirming the current environment as the most extreme low-correlation regime since the index was created.
| Volatility gauge | Current reading (2026) | Historical average |
|---|---|---|
| Headline index (VIX) | 14-15 | Roughly in line with long-term average |
| Single-stock (VIX EQ) | 40.5 | 25.6 (five years pre-pandemic) |
| Pairwise correlation | 13% | Near record low since 2022 |
Here is what this means for you directly. If you are judging your portfolio’s risk by the VIX alone, you are reading the wrong instrument. The headline number is telling you the index is calm while the stocks you actually own may be swinging far harder than that figure implies. In this kind of market, traditional diversification does less work than you think, because the thing keeping the index steady is not stability. It is offsetting chaos.
When big ASX news breaks, our subscribers know first
How equity dispersion mechanics actually work
The natural question is how a market this internally chaotic produces such a serene headline number. The answer sits in the mathematics of how index volatility is built from its parts.
Equity dispersion measures how differently individual stocks move relative to each other and to the index. High dispersion means the constituents are scattering in different directions. Low dispersion means they are marching together.
Here is the core mechanical reality. When one stock jumps sharply while another falls just as sharply, those two moves partly cancel at the index level. Multiply that across hundreds of names moving in different directions and the net index move shrinks, even though the underlying stocks are anything but quiet.
Cboe makes this point directly: higher dispersion tends to lower index volatility even when realised volatility is rising across many individual stocks. That is why the VIX has trended lower through 2026 while single-stock volatility has climbed. The index is not calm. It is cancelling itself out.
For a dispersion strategy to be genuinely attractive, three conditions need to line up:
- Low index volatility, currently reflected in the VIX around 14-15
- Depressed correlations, with pairwise correlation near 13% and close to a post-2022 record low
- Elevated single-stock volatility, with VIX EQ at 40.5 and climbing
When all three hold, index options look cheap relative to single-stock options. The gap between what the index implies and what individual stocks imply becomes the opportunity. Traders attempt to capture the structural difference between implied correlation (what the market is pricing in) and realised correlation (what actually happens).
Understanding this changes how you read a quiet market. A flat index no longer means safety by default. It might simply mean the components are busy neutralising each other, which distorts options pricing in ways you can learn to spot.
Tracking the DSPX
To measure all this in real time, Cboe launched the S&P 500 Dispersion Index (DSPX) in September 2023. Think of it as a VIX-style gauge, but instead of measuring expected index swings, it measures the expected gap between how single stocks move and how the index moves.
The DSPX is calculated from option prices and reflects expected 30-day dispersion between major S&P 500 constituents and the index itself. When the DSPX rises, it signals that traders expect individual stocks to scatter further apart while the index stays comparatively steady.
For you, the DSPX is the number that puts a value on the divergence you would otherwise only sense. A rising DSPX alongside a flat VIX is the clearest confirmation that the market’s calm is dispersion-driven rather than genuine, and that single-stock volatility is the risk you should be watching.
Exploiting the volatility term structure with calendar spreads
Knowing the environment is one thing. Trading it is another. This is where professionals move from theory to a specific structure, and in September 2026 the structure of choice is the calendar spread.
A calendar spread involves selling a near-term option and buying a longer-dated option at the same strike price. The near-term option you sell decays faster in value, and that decay helps finance the longer-dated option you hold.
According to Noel Smith of Convex Asset Management, calendar spreads were favoured over outright straddle purchases and short condor structures in the current environment, a view corroborated by analyst Tom Preston. The logic is straightforward. Buying a straddle outright means paying full premium and then bleeding value every day through time decay. A calendar spread lets you hold long volatility exposure while someone else’s premium pays part of the freight.
The mechanism hinges on the term structure of volatility, meaning how implied volatility differs across expiration dates. Calendar spreads work best when that structure is upward-sloping, so longer-dated options carry higher implied volatility. In that setup, the trader effectively buys longer-dated exposure at a relative discount, financed by the faster time decay (theta) harvested on the short near-term leg.
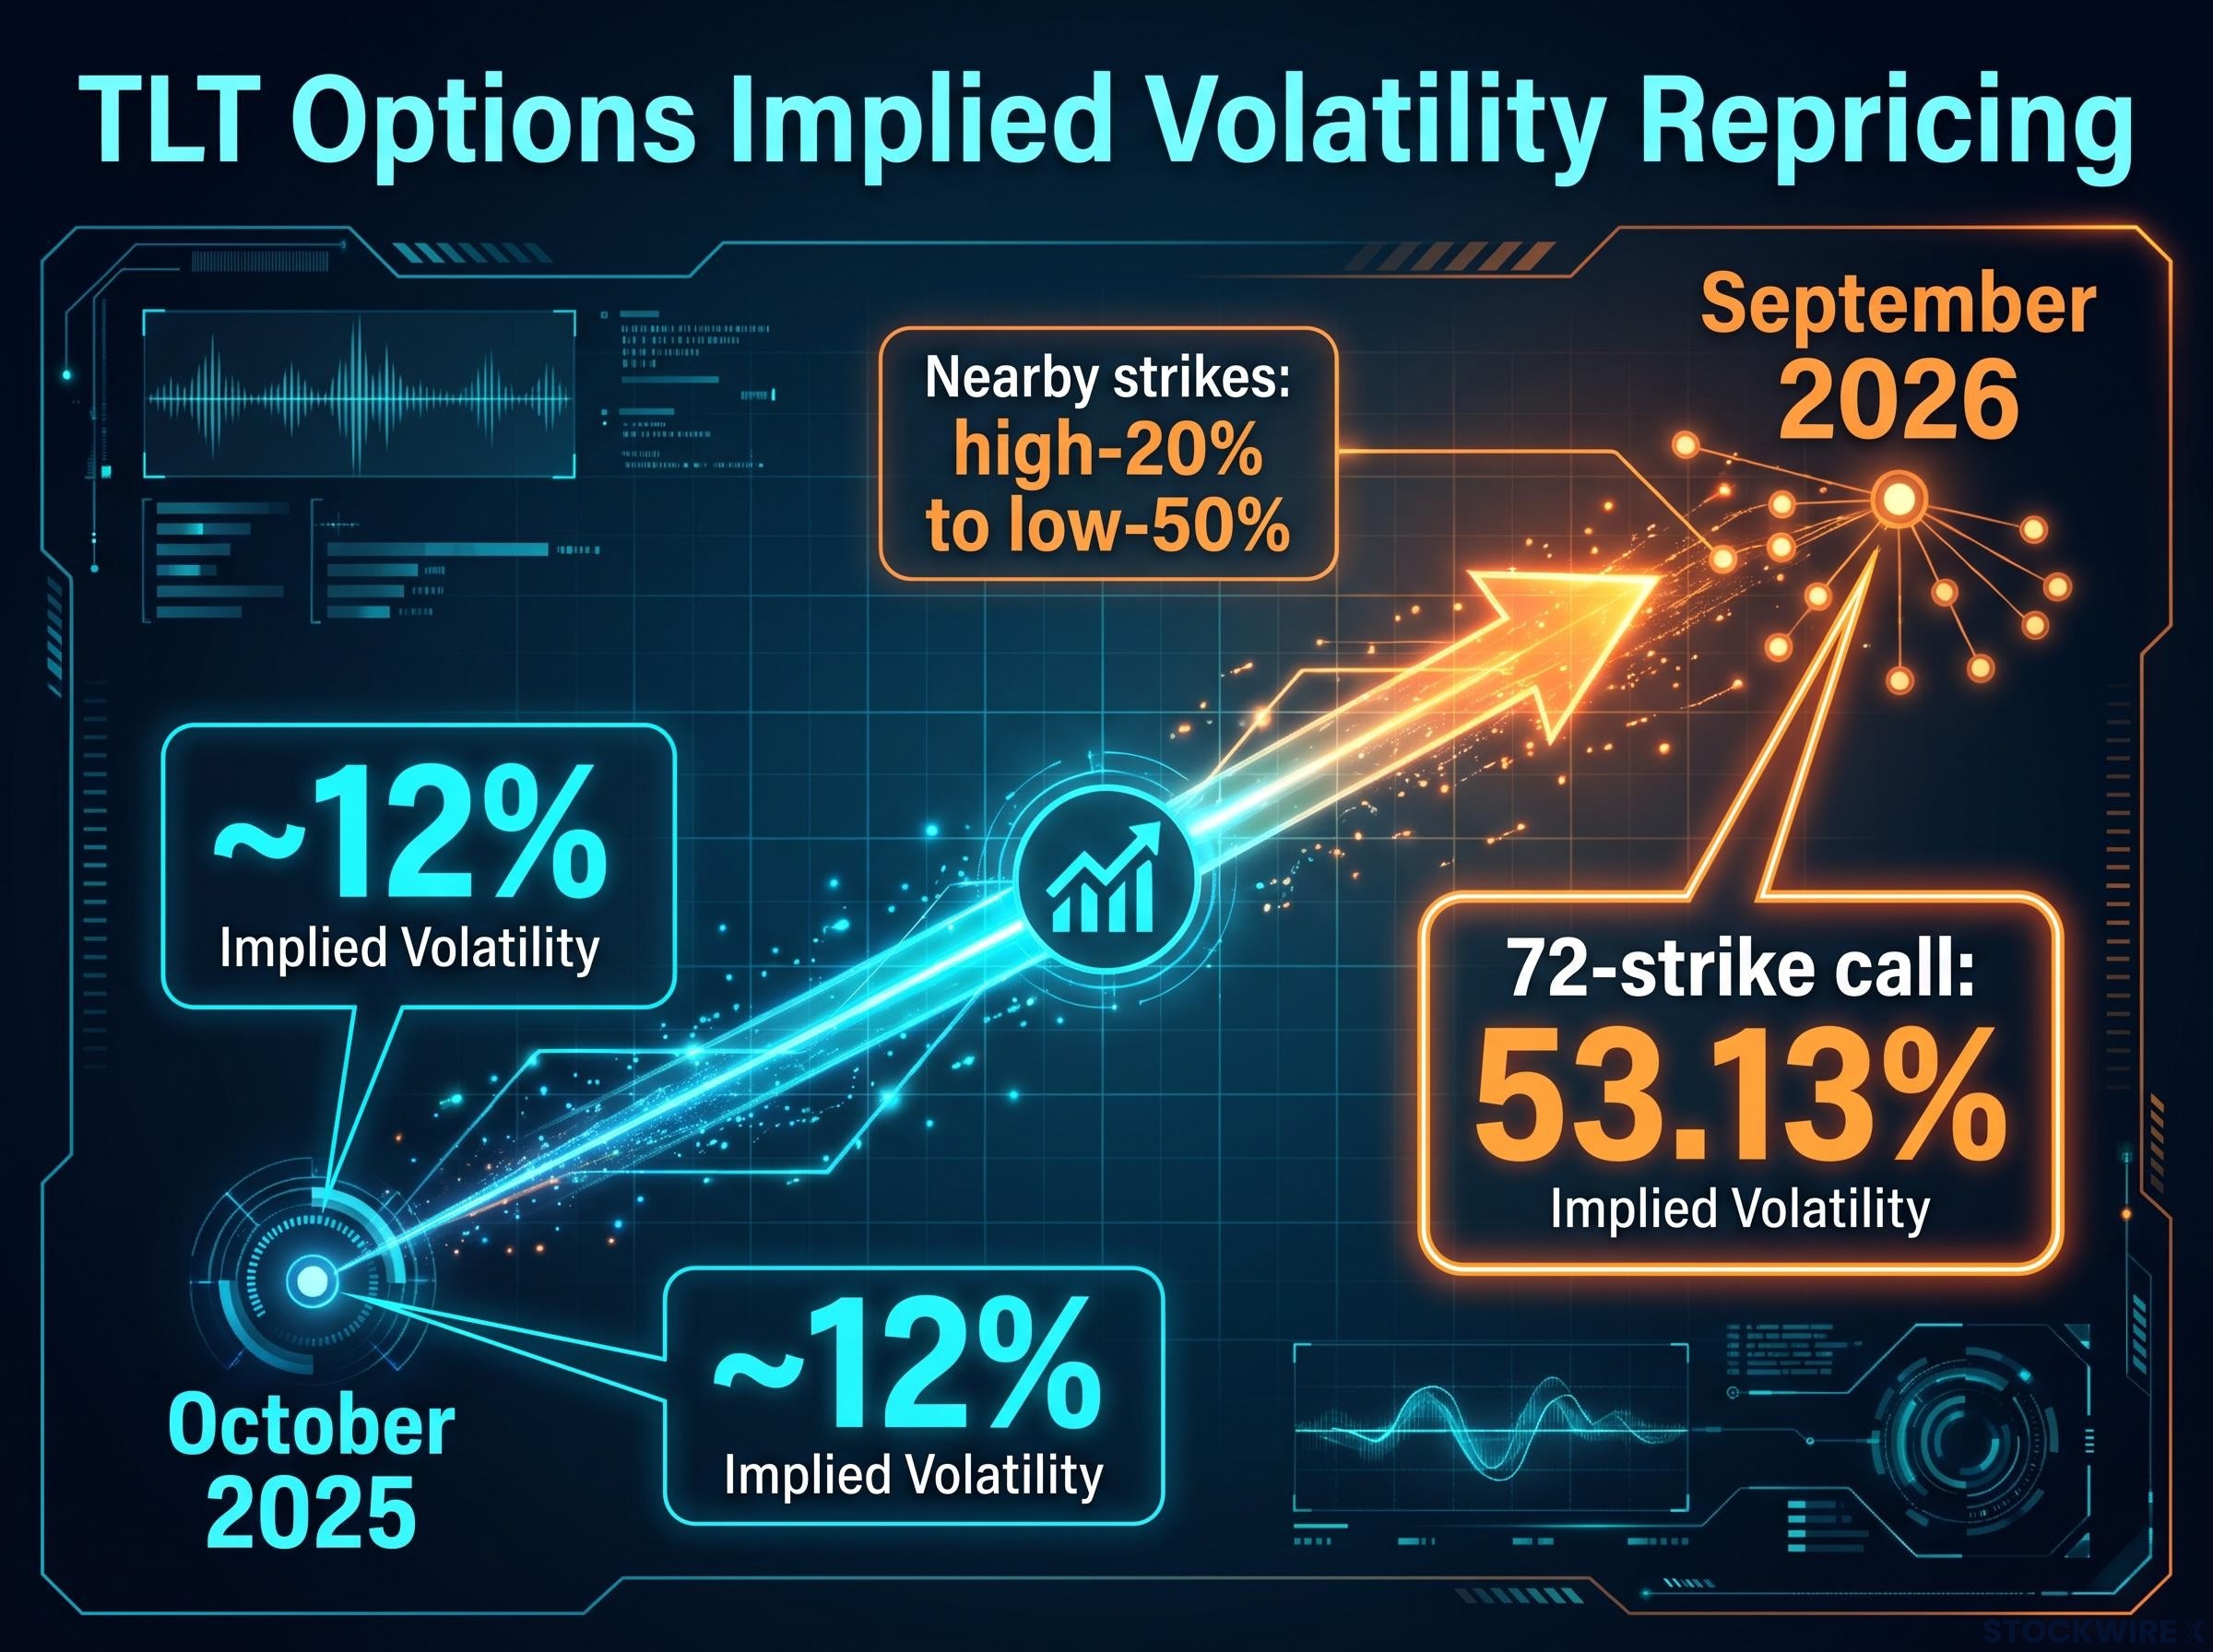
The speed at which options pricing can shift makes this matter. In October 2025, implied volatility on TLT (the long-term Treasury bond ETF) November options sat at roughly 12%, according to Investor’s Business Daily. By September 2026, Yahoo Finance’s TLT options chain showed nearby strikes ranging from the high-20% to low-50% area, with one 72-strike call carrying implied volatility of 53.13%. That is a dramatic repricing in under a year.
Here is how a calendar spread typically plays out step by step:
- Sell a near-term option at a chosen strike to collect premium.
- Buy a longer-dated option at the same strike, using the collected premium to reduce your net cost.
- Harvest time decay on the short leg as it approaches expiration faster than the long leg.
- Manage the short leg by rolling or closing it ahead of key events to avoid assignment.
- Retain the long-dated option for continued exposure to a potential volatility spike.
The structural advantage for you is meaningful. A calendar spread lets you stay long volatility in a rangebound but elevated regime without absorbing the brutal daily decay of an outright option purchase. You are collecting short-term premium to fund long-term exposure, which is a very different risk profile from simply buying and hoping for a move.
The trade is not free of danger. A sharp directional move can push the short leg deep in-the-money, creating gamma and assignment risk, while near-term event shocks can spike short-dated volatility and flatten the term structure that gave you the edge in the first place.
The OIC calendar spread mechanics framework details exactly how assignment risk and gamma exposure intensify on the short leg when a sharp directional move pushes the underlying toward your strike — the specific dangers described immediately above.
Managing tail risk with VIX call spreads
Every dispersion trade shares one nightmare scenario. A sudden macro shock sends every stock falling at once, correlations spike toward one, and the low-correlation environment the whole trade depends on evaporates in a session. That is the risk professionals hedge before they ever put the core trade on.
The tool of choice is a VIX upside call spread, often financed by selling downside puts. Noel Smith of Convex Asset Management described exactly this structure: buy VIX call spreads to profit if volatility surges, and sell VIX puts to fund the position so you are not paying full premium for the protection.
VIX call spread mechanics interact with the futures curve in ways that matter for sizing: VIX calls are priced off VIX futures rather than spot VIX, so a rising spot reading during a slow selloff does not translate into gains unless the futures strip also moves, and contango dominated roughly 85% of trading days from 1990 to 2025.
The financing logic depends on a view about the floor for volatility. Smith noted that VIX was not expected to collapse to very low levels heading into the midterm elections, which limited the downside risk on selling the put. If extreme VIX compression is not your base case, selling that downside put becomes a reasonable way to pay for your disaster insurance.
The midterm election cycle is currently acting as a volatility anchor, keeping the VIX from collapsing entirely while also making a sustained spike politically inconvenient. Market participants broadly expect steps to ease market concerns before the vote, reinforcing a rangebound mid-teens VIX.
This is not a novel manoeuvre. During the AI-driven mega-cap rally of 2023-2024, traders used VIX call spreads to cheaply hedge the risk that concentrated leadership would eventually give way to a systemic shock, while keeping their primary exposure in the underlying dispersion trades. The low-volatility regime of 2017 followed the same template, with VIX call spreads serving as tail hedges that let traders keep selling index volatility while capping their risk.
The takeaway for you is simple but non-negotiable. Even a mathematically sound trade needs strict downside protection, because the correlation spike that breaks a dispersion book tends to arrive without warning. Learning how professionals finance that protection through short puts gives you a template for defending your own positions without paying away all your returns to do it.
Positioning for the next volatility regime
Strip everything back and one conclusion holds. The stability of the headline index right now is a facade, masking aggressive single-stock rotation beneath a VIX that says nothing is wrong.
That leaves you with a genuine decision. You can actively trade the dispersion through structures like calendar spreads and VIX call spreads, or you can simply recognise the risk and hedge your existing long equity exposure against a correlation spike. Either is defensible. Doing nothing while reading the VIX as an all-clear is not.
Watch the signals that would end this regime. A sustained rise in pairwise correlation, a jump in the DSPX alongside a spiking VIX, or a broadening of market leadership beyond the mega-caps would each mark the point where dispersion stops paying and diversification suddenly matters far more than it does today.
For readers wanting to see both strategy types mapped against current market conditions with defined-risk examples, our full explainer on butterfly and calendar spread structures walks through real NDX and single-stock setups, including cost-per-position data and the payoff logic behind pairing bearish and bullish structures across a two-session scenario.
This article is for informational purposes only and should not be considered financial advice. Investors should conduct their own research and consult with financial professionals before making investment decisions. Past performance does not guarantee future results, and options strategies carry substantial risk, including the potential loss of the entire premium and losses beyond the initial outlay.