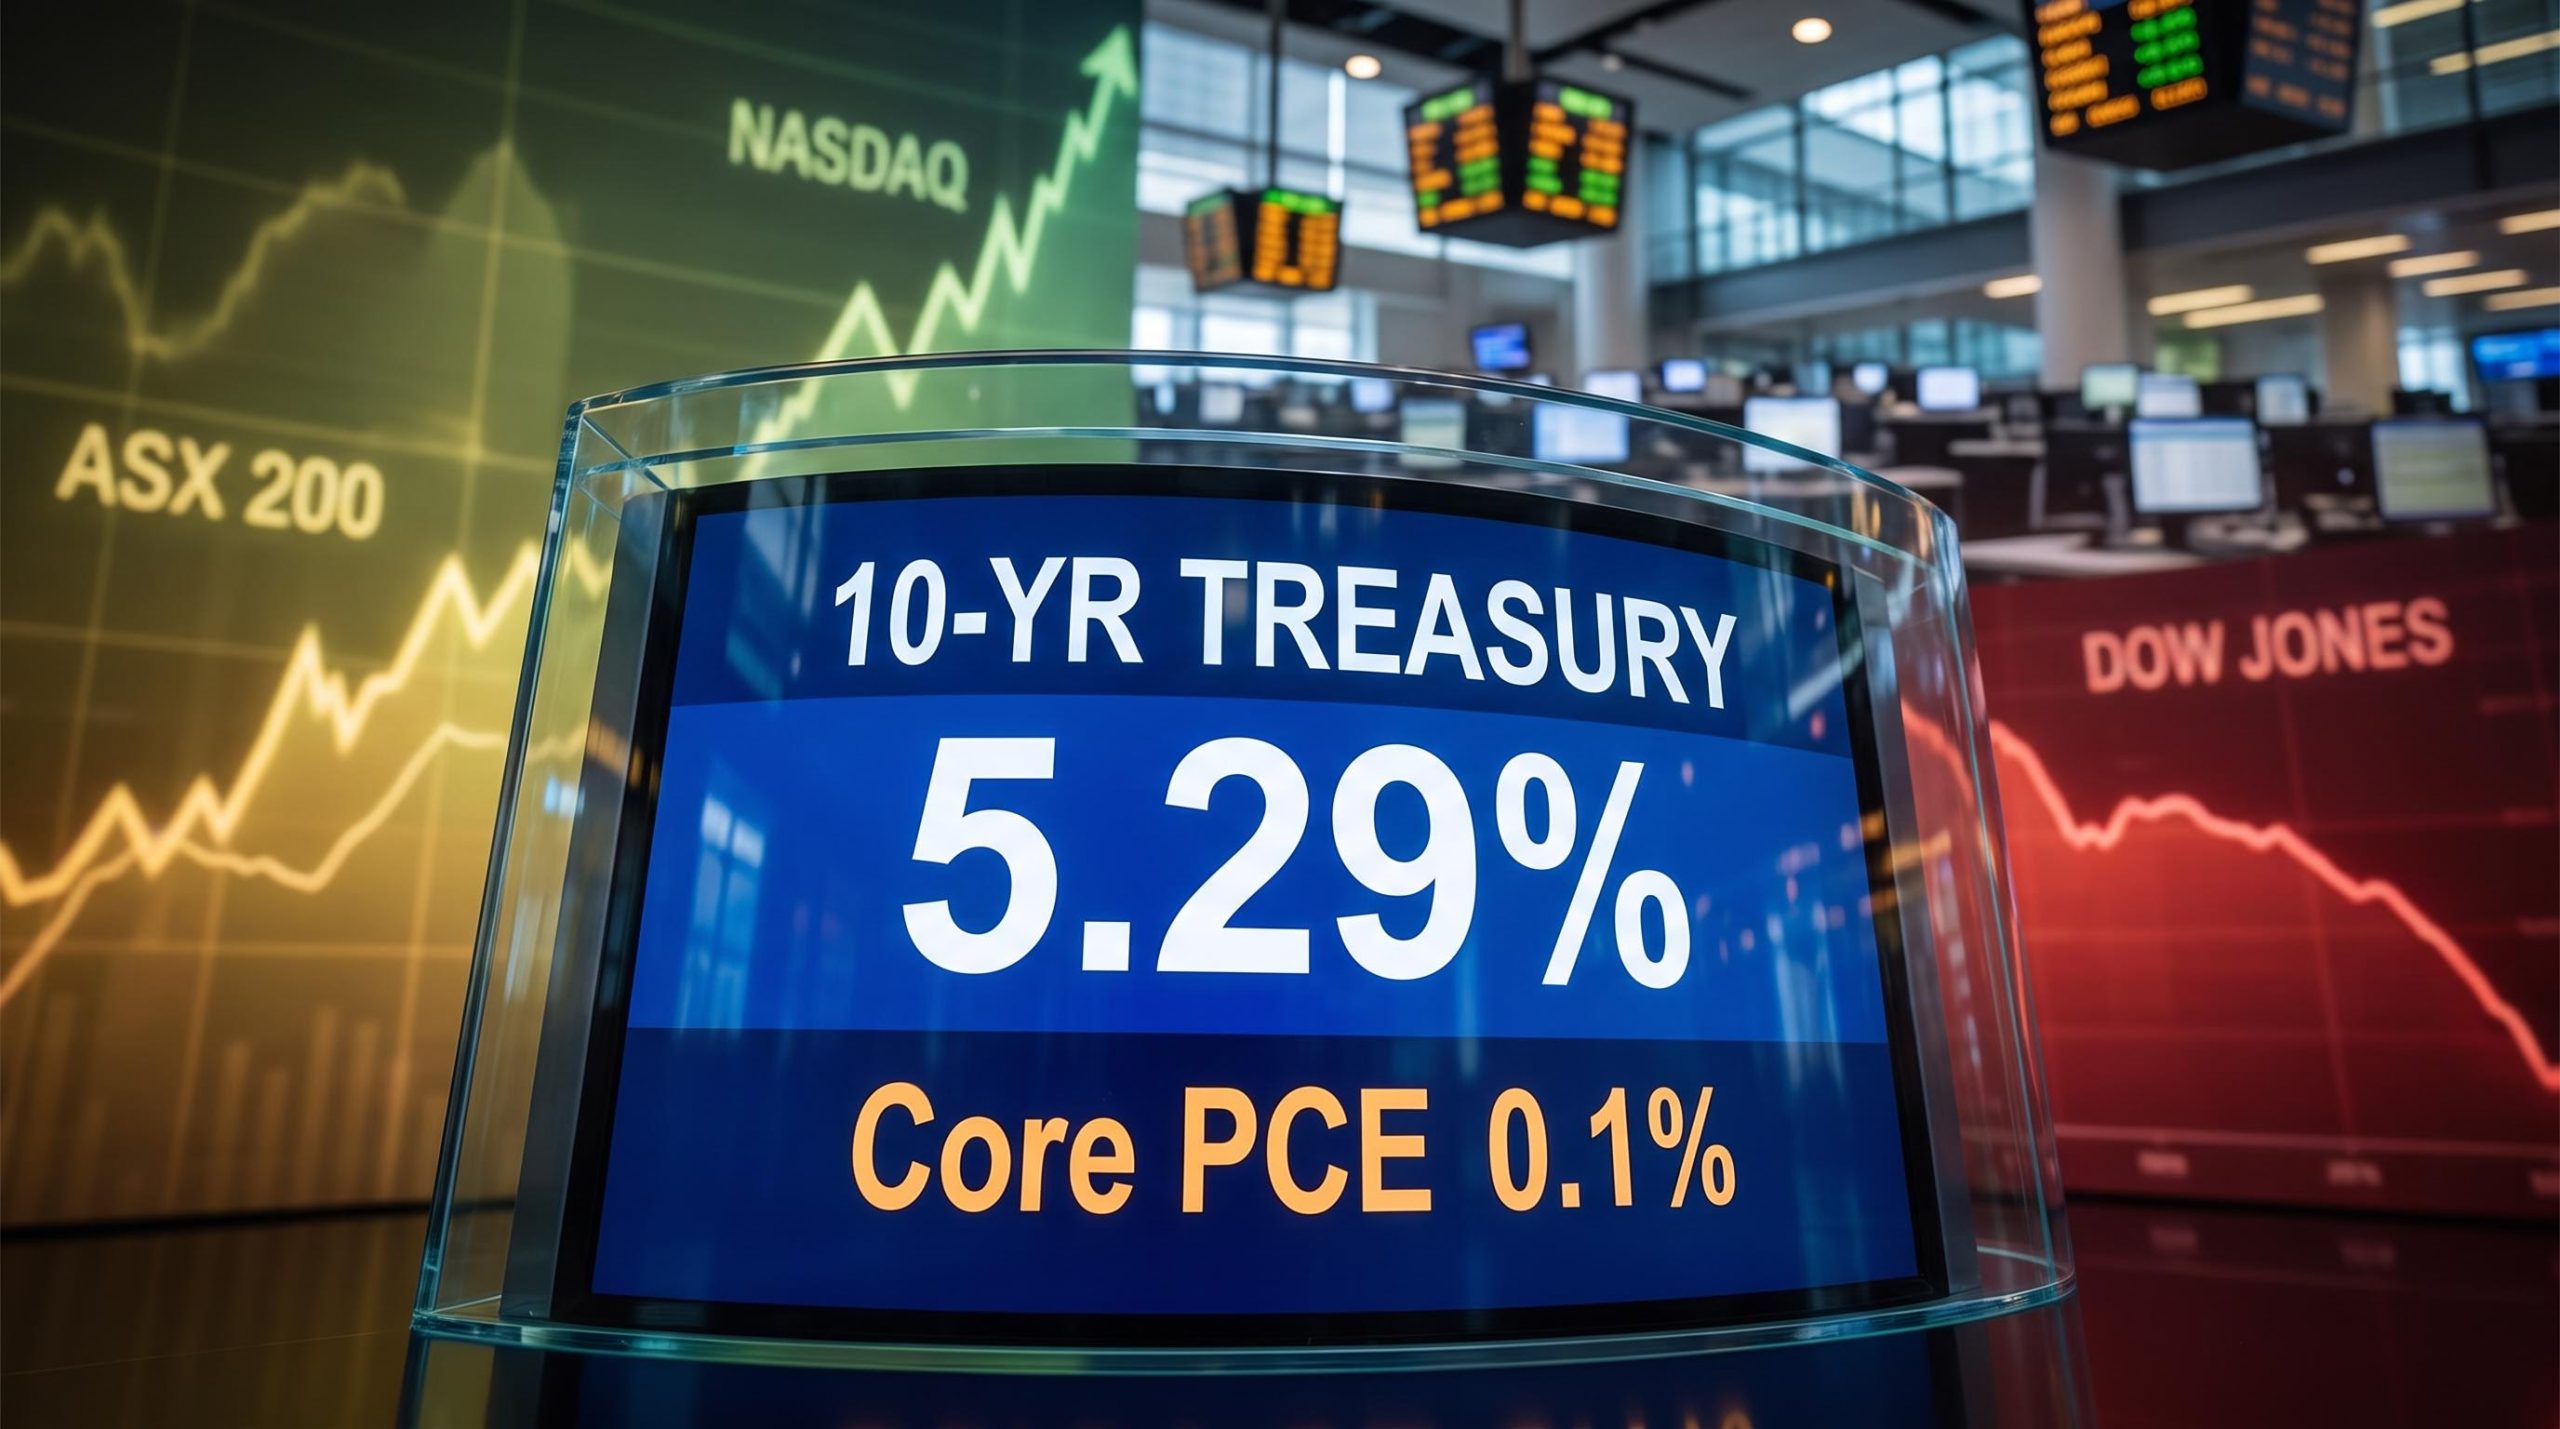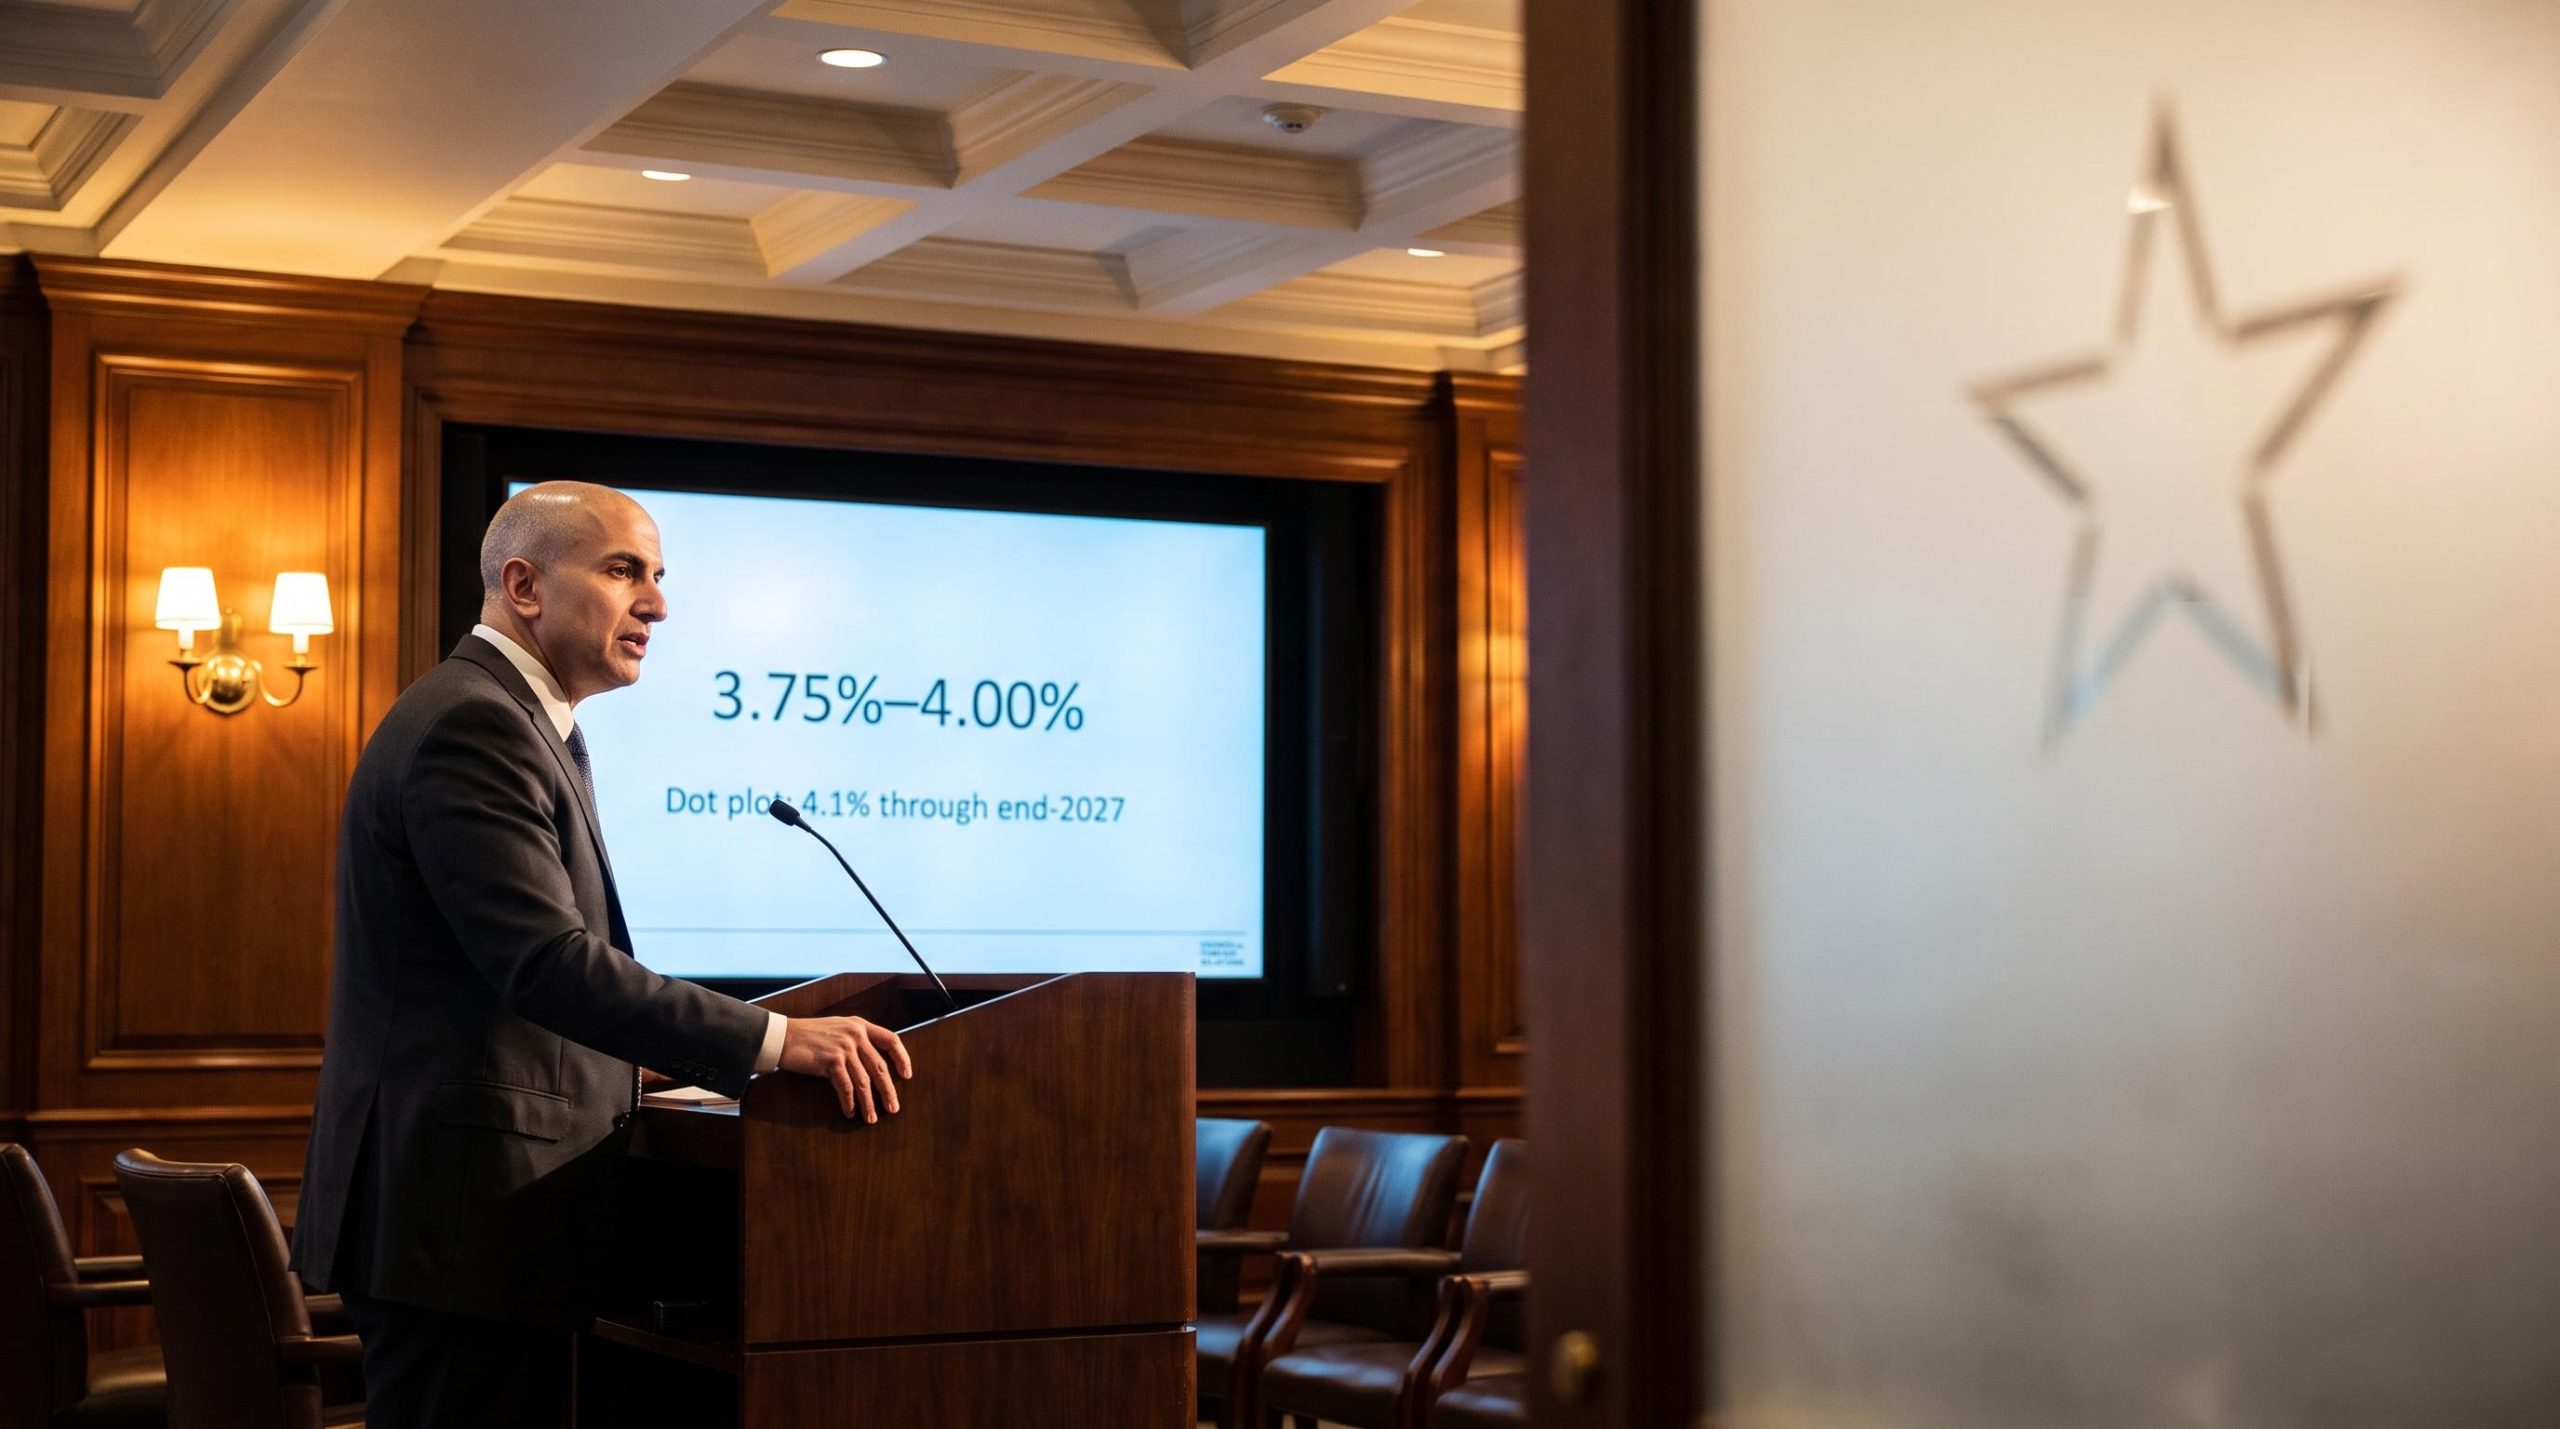
On 30 September 2026, Minneapolis Fed President Neel Kashkari stood before the Council on Foreign Relations and put a number on the table that unsettled the room: at least one more rate hike in 2026, another in 2027, with inflation still hovering near 3% and the policy rate already sitting at 3.75%-4.00%. The dissonance is hard to miss. If the economy is genuinely resilient, why is the Fed still pressing harder?
The gap tells the story. Rates are at 3.75%-4.00% today. The Fed’s own dot plot has them at 4.1% through the end of 2027. Kashkari’s remarks push the horizon for relief further still. For anyone holding a mortgage, a bond portfolio, growth stocks, or simply watching a savings account, that gap is the difference between rate cuts arriving next year and rate cuts staying a rumour.
Here is what this piece unpacks: not just what Kashkari said, but why his uncertainty about one obscure technical concept, the neutral interest rate, is the actual engine of the “higher-for-longer” regime, and what that means for specific portfolio decisions running into 2027.
What Kashkari actually said, and why it caught markets’ attention
The signal was blunt. Speaking at the Council on Foreign Relations on 30 September 2026, Kashkari made clear that newly released data had not softened his view: inflation near 3% remains too high relative to the Fed’s 2% target, and more tightening is warranted.
Specifically, he anticipates at least one more increase in 2026, on top of the 25 basis point move on 16 September 2026 that lifted the target range to 3.75%-4.00%. He expects a further hike in 2027. That amounts to two total hikes for 2026 in his projections, with one more to follow.
“Inflation at around 3% is still too high,” Kashkari indicated, framing the distance to the 2% goal as the anchor for everything that follows.
What made this land as hawkish was the backdrop. The August 2026 Consumer Price Index (CPI), published on 11 September 2026, showed headline inflation at 3.4% year-over-year, unchanged from July, with core inflation (which strips out volatile food and energy prices) at just 2.4%. Monthly headline came in at 0.4%. With core inflation that close to target, some market participants expected a gentler tone. They did not get one.
Notably, Kashkari framed his preference as measured rather than aggressive tightening. That matters for how you read the pace ahead: this is deliberate continuation, not a shock pivot. The Fed is signalling patience in method, not in destination.
The takeaway for investors is uncomfortable. Even as inflation has improved meaningfully from its 2022 peaks, the Fed’s threshold for declaring victory is further away than many assumed, and that threshold is being set by an unresolved question about where rates naturally belong, not by the inflation number alone.
The Fed’s shifting stance on restraint illustrates how quickly the same rate level can move from neutral to insufficiently tight, with Cleveland Fed President Beth Hammack documenting exactly that arc across the first half of 2026 as incoming data changed the committee’s assessment of where policy actually stood.
How the dot plot maps the path ahead
The Fed’s Summary of Economic Projections, known as the dot plot, is a collective snapshot of where the twelve FOMC officials individually see rates going. It is not a commitment. It is a forecast that shifts with the data.
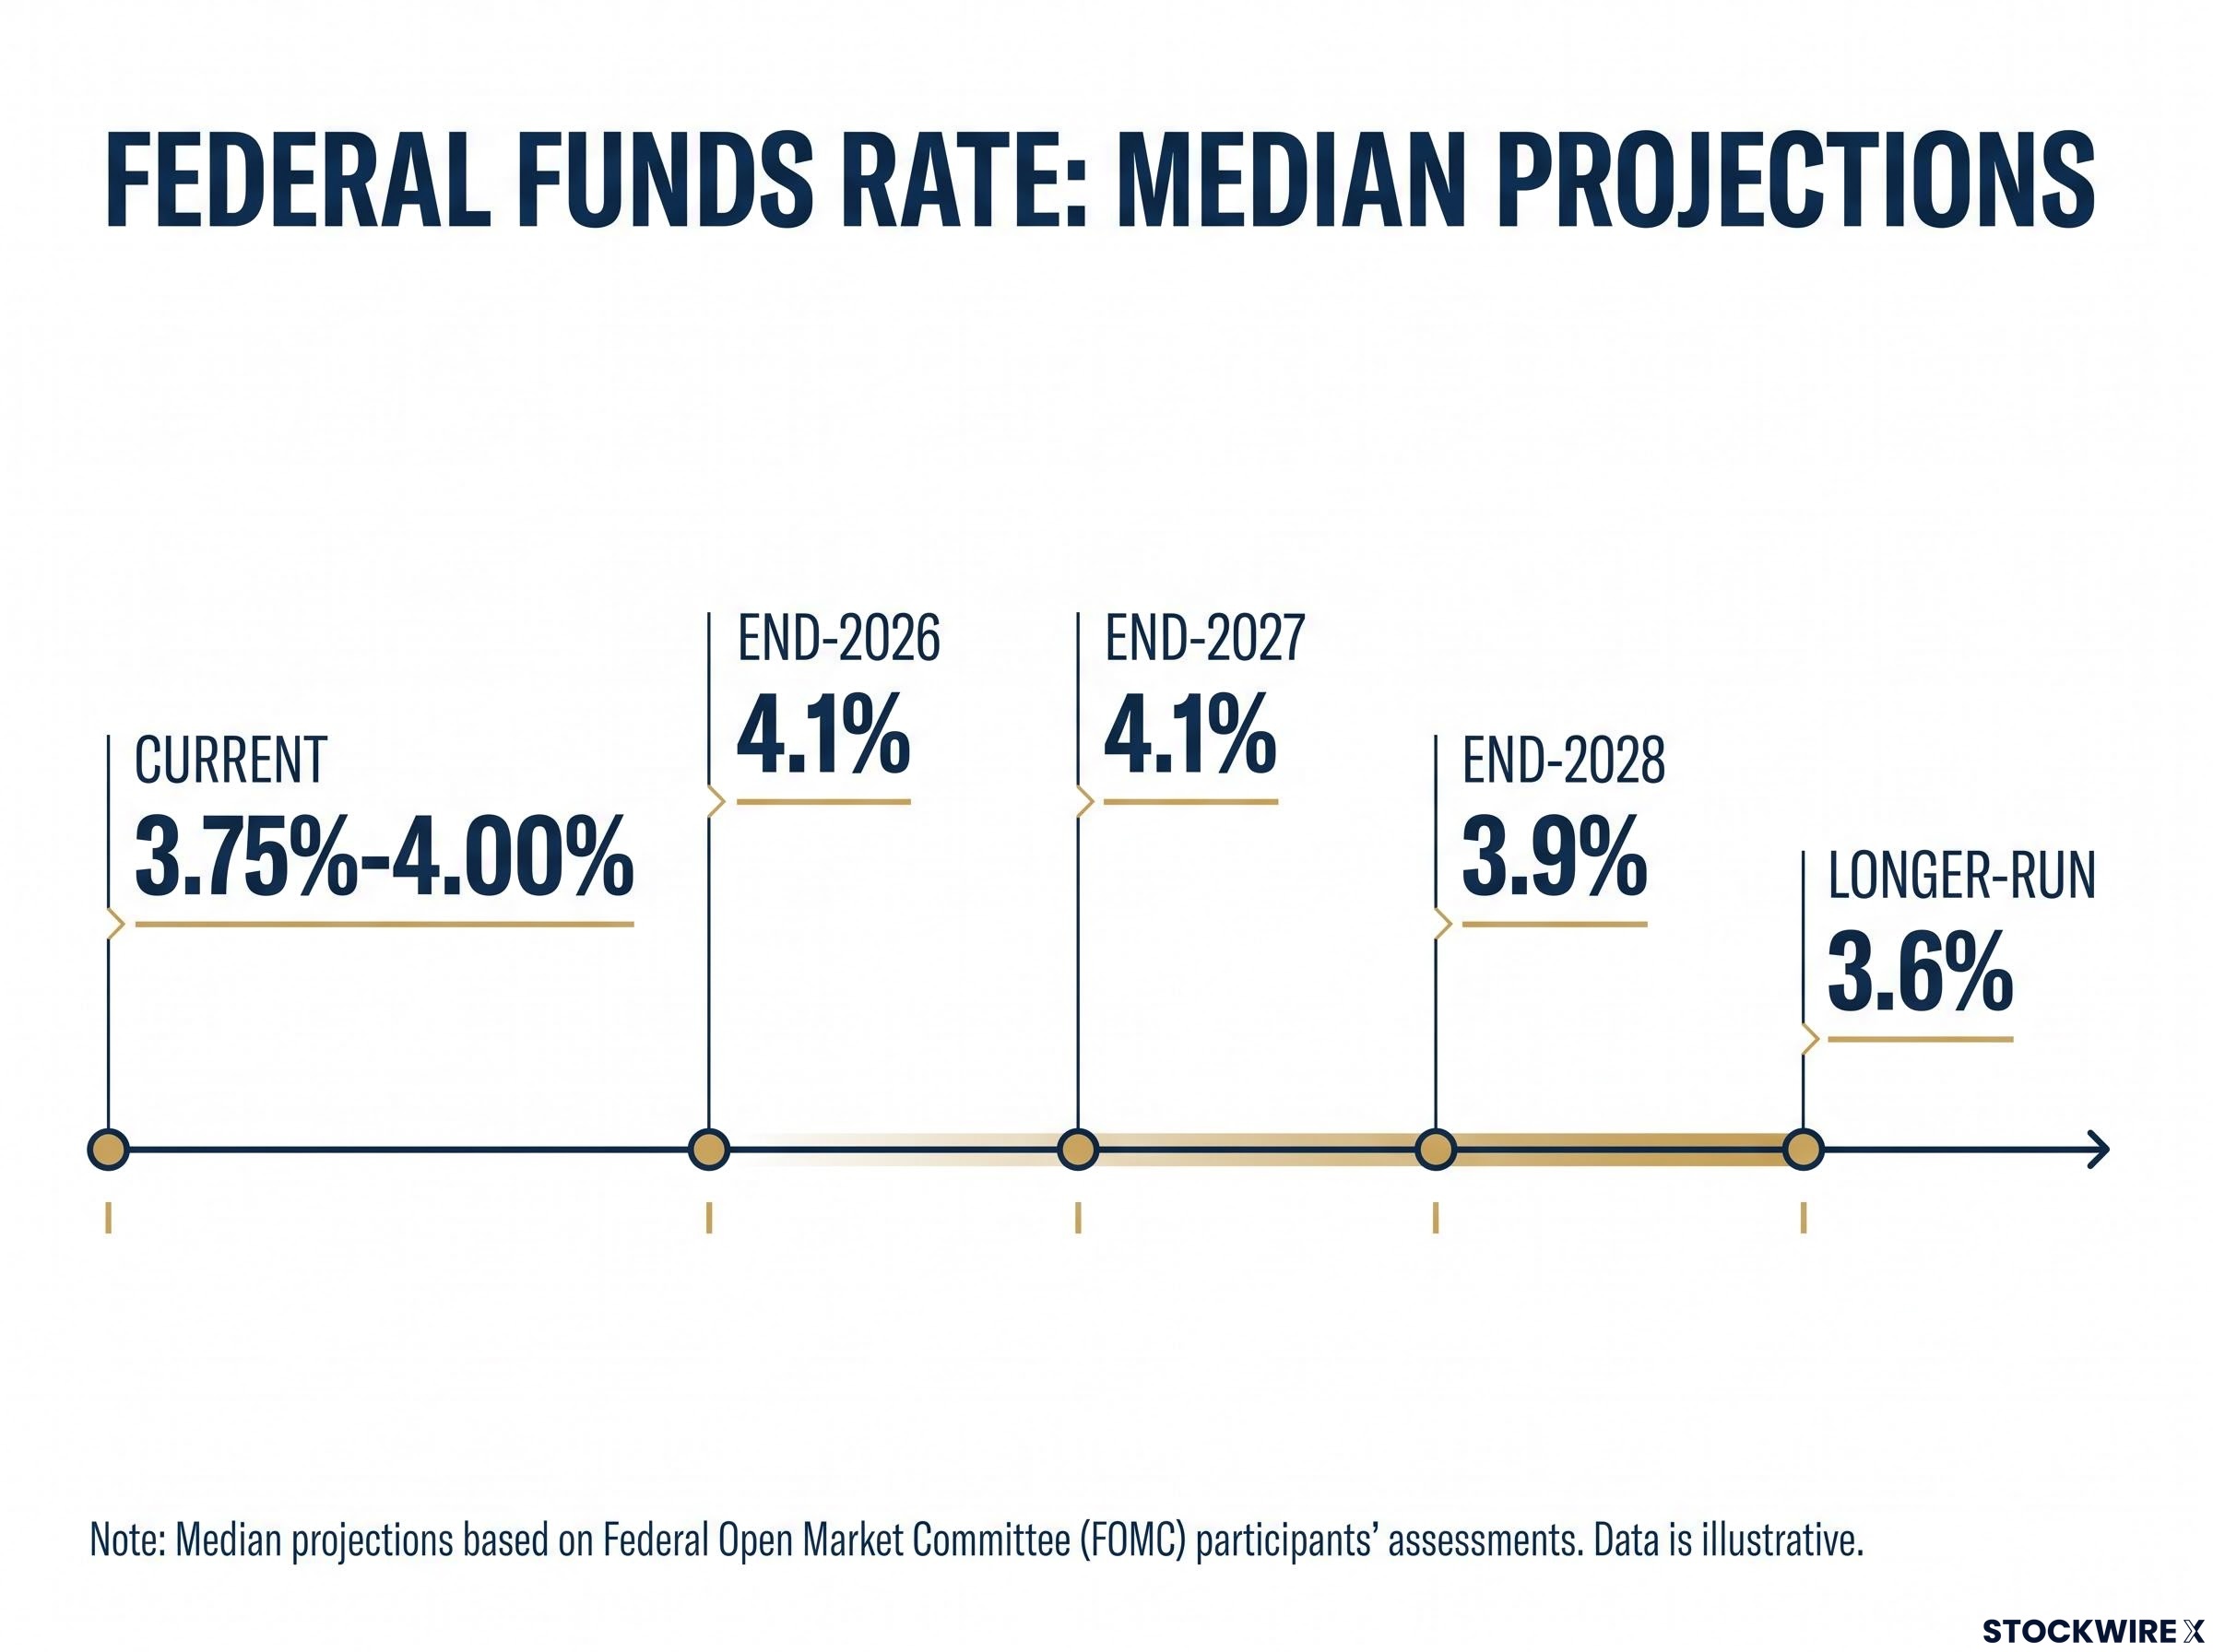
As of the 16 September 2026 meeting, the median projections were:
- Federal funds rate, end-2026: 4.1%
- Federal funds rate, end-2027: 4.1%
- Federal funds rate, end-2028: 3.9%
- Longer-run (steady-state) level: 3.6%
Kashkari’s implied path, at least one more 2026 hike and one 2027 hike on top of current levels, sits at or above these medians. The gap between his trajectory and the collective one is the question every market participant is now trying to price. The next CPI release, due 14 October 2026, is the first test.
When big ASX news breaks, our subscribers know first
The concept at the centre of everything: what is the neutral interest rate?
Kashkari kept returning to a single admission: he is uncertain. Not about inflation, not about employment, but about something harder to see. That something is the neutral interest rate, and his uncertainty about it is not a communication slip. It is a genuine technical problem with real consequences for your money.
The neutral interest rate, often called r-star, is the policy rate at which the economy runs at its potential without the Fed either stimulating growth or restraining it. It is the setting where monetary policy is neither pressing the accelerator nor the brake. Every central bank is steering toward it, yet none can see it directly.
That is the core difficulty: r-star cannot be measured. It has to be inferred from macroeconomic data using statistical models. The Fed’s primary framework is the Holston-Laubach-Williams (HLW) model, developed at the Federal Reserve Bank of New York, which filters GDP, inflation, and interest rate data to estimate the underlying neutral rate.
Because that model leans on historical data and assumptions about how output and inflation respond to rates, its estimates are highly sensitive to structural breaks like the pandemic, to data revisions, and to modelling choices. Academic work by Thomas Laubach, John Williams, Lukasz Rachel, and Lawrence Summers underscores that r-star depends on slow-moving forces: demographics, global savings, and fiscal policy, none of which reveal themselves cleanly at any given moment.
The Holston-Laubach-Williams model estimates published by the Federal Reserve Bank of New York show how sensitive r-star calculations are to structural breaks in the data, a sensitivity that has made post-pandemic estimates particularly wide-ranging and contested among Fed officials.
Kashkari’s stated view is that r-star is probably higher than typical historical benchmarks, at least for the foreseeable future. Three structural forces may have pushed it up since the pandemic:
- Larger fiscal deficits, which increase the government’s demand for capital.
- Stronger investment demand, which competes for the same pool of savings.
- Supply chain restructuring, which has raised the appetite for capital across the economy.
The mechanistic point is what makes this urgent. If r-star has risen, then the current 3.75%-4.00% funds rate may be less restrictive than it appears, which justifies continued hikes even with core inflation at 2.4%. The same data supports very different policy conclusions depending on where r-star actually sits.
| Scenario | Implied r-star | What it means for current policy | Key driver |
|---|---|---|---|
| R-star still low | Around 0.5%-1% real | Current rates are clearly restrictive; further hikes risk overtightening | Abundant global savings, compressed risk premia |
| R-star moderately higher | Around 1.5%-2% real | Policy is restrictive but with less room than assumed | Higher trend investment demand |
| R-star substantially higher | Around 3% real | Current settings only modestly restrictive; more hikes justified | Large fiscal deficits, structural shifts post-pandemic |
For you as an investor, r-star uncertainty is not an academic footnote. It is the reason the Fed cannot credibly give an “all clear” even when inflation is falling, because officials genuinely do not know how high rates must go to restrain the economy rather than merely hold it steady. Disagreements among Fed officials are not noise. They reflect a real problem at the heart of policy, and it will not resolve quickly.
How a higher-for-longer Fed reshapes your portfolio
One rate decision does not stay in one place. It propagates. To understand what Kashkari’s stance means for your holdings, follow the chain from Treasury yields through mortgages and into equity valuations, ending with the dollar that ties the whole system to the rest of the world.
It starts with bond yields. When the Fed signals more hikes, short-maturity Treasury yields rise directly as investors price in additional increases and a later start to any easing. Longer-term yields lift too, driven by both expected future rates and the term premium.
That upward pressure on rates flows straight into equities. Higher discount rates compress the value of future cash flows, which hits long-duration growth stocks hardest, the ones whose value depends on earnings years out. Strategists at BlackRock and J.P. Morgan Asset Management have repeatedly noted that higher-for-longer rhetoric tends to rotate leadership away from high-duration tech toward cash-generative value sectors.
Equity performance during rate hikes follows a more complicated pattern than headline volatility suggests: Goldman Sachs data shows the S&P 500 has averaged roughly 9% in the 12 months following the first hike of a tightening cycle, with 2022 identified as an outlier driven by emergency-pace tightening and elevated starting valuations rather than a template for what tightening typically produces.
The recent past shows how forceful this can be. Between 2022 and 2023, the Fed raised rates by more than 500 basis points from near zero, producing one of the worst years on record for both Treasuries and long-duration equities, alongside regional bank stresses.
| Channel | Mechanism | Practical impact for US investors |
|---|---|---|
| Bond yields | Higher expected policy rates lift short and long Treasury yields | Existing long-duration bonds fall in price; new buyers get higher income |
| Equity valuations | Higher discount rates compress price-to-earnings multiples | Growth and tech names face the steepest valuation pressure |
| Mortgage rates | 30-year rates track intermediate Treasury yields plus a spread | Housing affordability tightens; refinancing and purchases slow |
| US dollar | Wider rate differentials attract carry and safe-haven flows | Firmer dollar weighs on unhedged foreign and EM exposure |
There is a competing read worth holding. If r-star has risen toward a 3% real rate, current policy may be only modestly restrictive, and financial conditions, given resilient equities and tight credit spreads, may not be as tight as the Fed assumes. That is precisely why Kashkari is comfortable adding hikes.
Mohamed El-Erian and various bank research teams have stressed that the post-2022 campaign broke inflation but exposed real financial-stability costs, from regional bank stresses to a housing slowdown, a reminder that steep tightening carries a bill.
The dollar and international exposure
The dollar is where the domestic story becomes a global one. A more hawkish Fed widens interest rate differentials against other major central banks, and that gap draws capital toward dollar assets through carry flows, money chasing the higher yield.
Currency strategists at Goldman Sachs and Citigroup have highlighted this pattern through the 2022-2023 cycle, when sustained hiking coincided with a strong dollar against both G10 and emerging market currencies.
For you, the risk is concentrated in unhedged foreign holdings. If you own emerging market or international equities without currency hedging, a firming dollar on hawkish Fed guidance can erode returns even when the underlying assets perform.
For a standard 60/40 portfolio in late 2026, the combined effect is what stings: upward pressure on equity discount rates and elevated short-term yields on the fixed income side mean neither leg is a natural refuge until the rate path becomes clearer.
The risks Kashkari’s framework is not fully pricing in
Kashkari’s case is coherent, but it rests on assumptions that credible analysts contest. Three risks deserve genuine weight, not a dismissive caveat:
- Policy lags: Monetary policy works with delays of 12-18 months or more, so prior hikes are still filtering into the economy well into 2027-2028.
- Consumer and credit stress: Signs of household fragility are already visible beneath the resilient headline data.
- Asymmetric risk: With inflation near 3% and expectations anchored, overtightening may be the more dangerous mistake.
On lags, economists at the Brookings Institution and the IMF have warned that judging policy purely by today’s inflation risks over-reacting to shocks that have already passed, damaging employment once the lagged effects of earlier hikes fully land.
On stress, research desks at Morgan Stanley and Bank of America have flagged rising credit card and auto loan delinquency rates alongside the depletion of excess savings. The headline economy looks solid; the household balance sheet underneath tells a more fragile story.
Consumer debt stress is visible in credit card and auto loan delinquency rates that have reached multi-year highs, though the aggregate picture is complicated by record household net worth and near-historic-low mortgage delinquency rates, meaning the fragility is concentrated among younger and lower-income borrowers rather than distributed across the balance sheet.
History brackets the possibilities. Three episodes are worth holding in mind:
- 1994-1995: The Fed under Alan Greenspan raised rates from 3% to 6%, inflicting sharp bond losses but achieving a soft landing with no deep recession.
- 2022-2023: More than 500 basis points of hikes broke inflation but exposed financial-stability costs.
- 2018-2019: Hikes were followed by a rapid pivot once growth faltered, proving reversals can come fast.
Once inflation sits in the 3-3.5% range with expectations reasonably anchored, many macroeconomists argue the risk of entrenching inflation is smaller than the risk of triggering a financial accident through over-tightening. That is the asymmetric case Kashkari’s framework does not fully weigh.
His willingness to add hikes even with core inflation at 2.4% implicitly assumes the lags are not yet binding and that financial conditions are not tight enough. Both assumptions are empirically contested.
The practical takeaway is not that Kashkari is wrong. It is that you should position for multiple scenarios rather than treating further hikes as certain, because the same data supporting his hawkish read can be interpreted as evidence the economy is already absorbing more restraint than the surface suggests. Strategists at PIMCO and BlackRock frame it simply: manage interest-rate risk, and avoid complacency about the pace and extent of hikes.
What to watch between now and the next FOMC decision
Forget the summary. Here is the checklist that will actually tell you which way this breaks over the coming weeks.
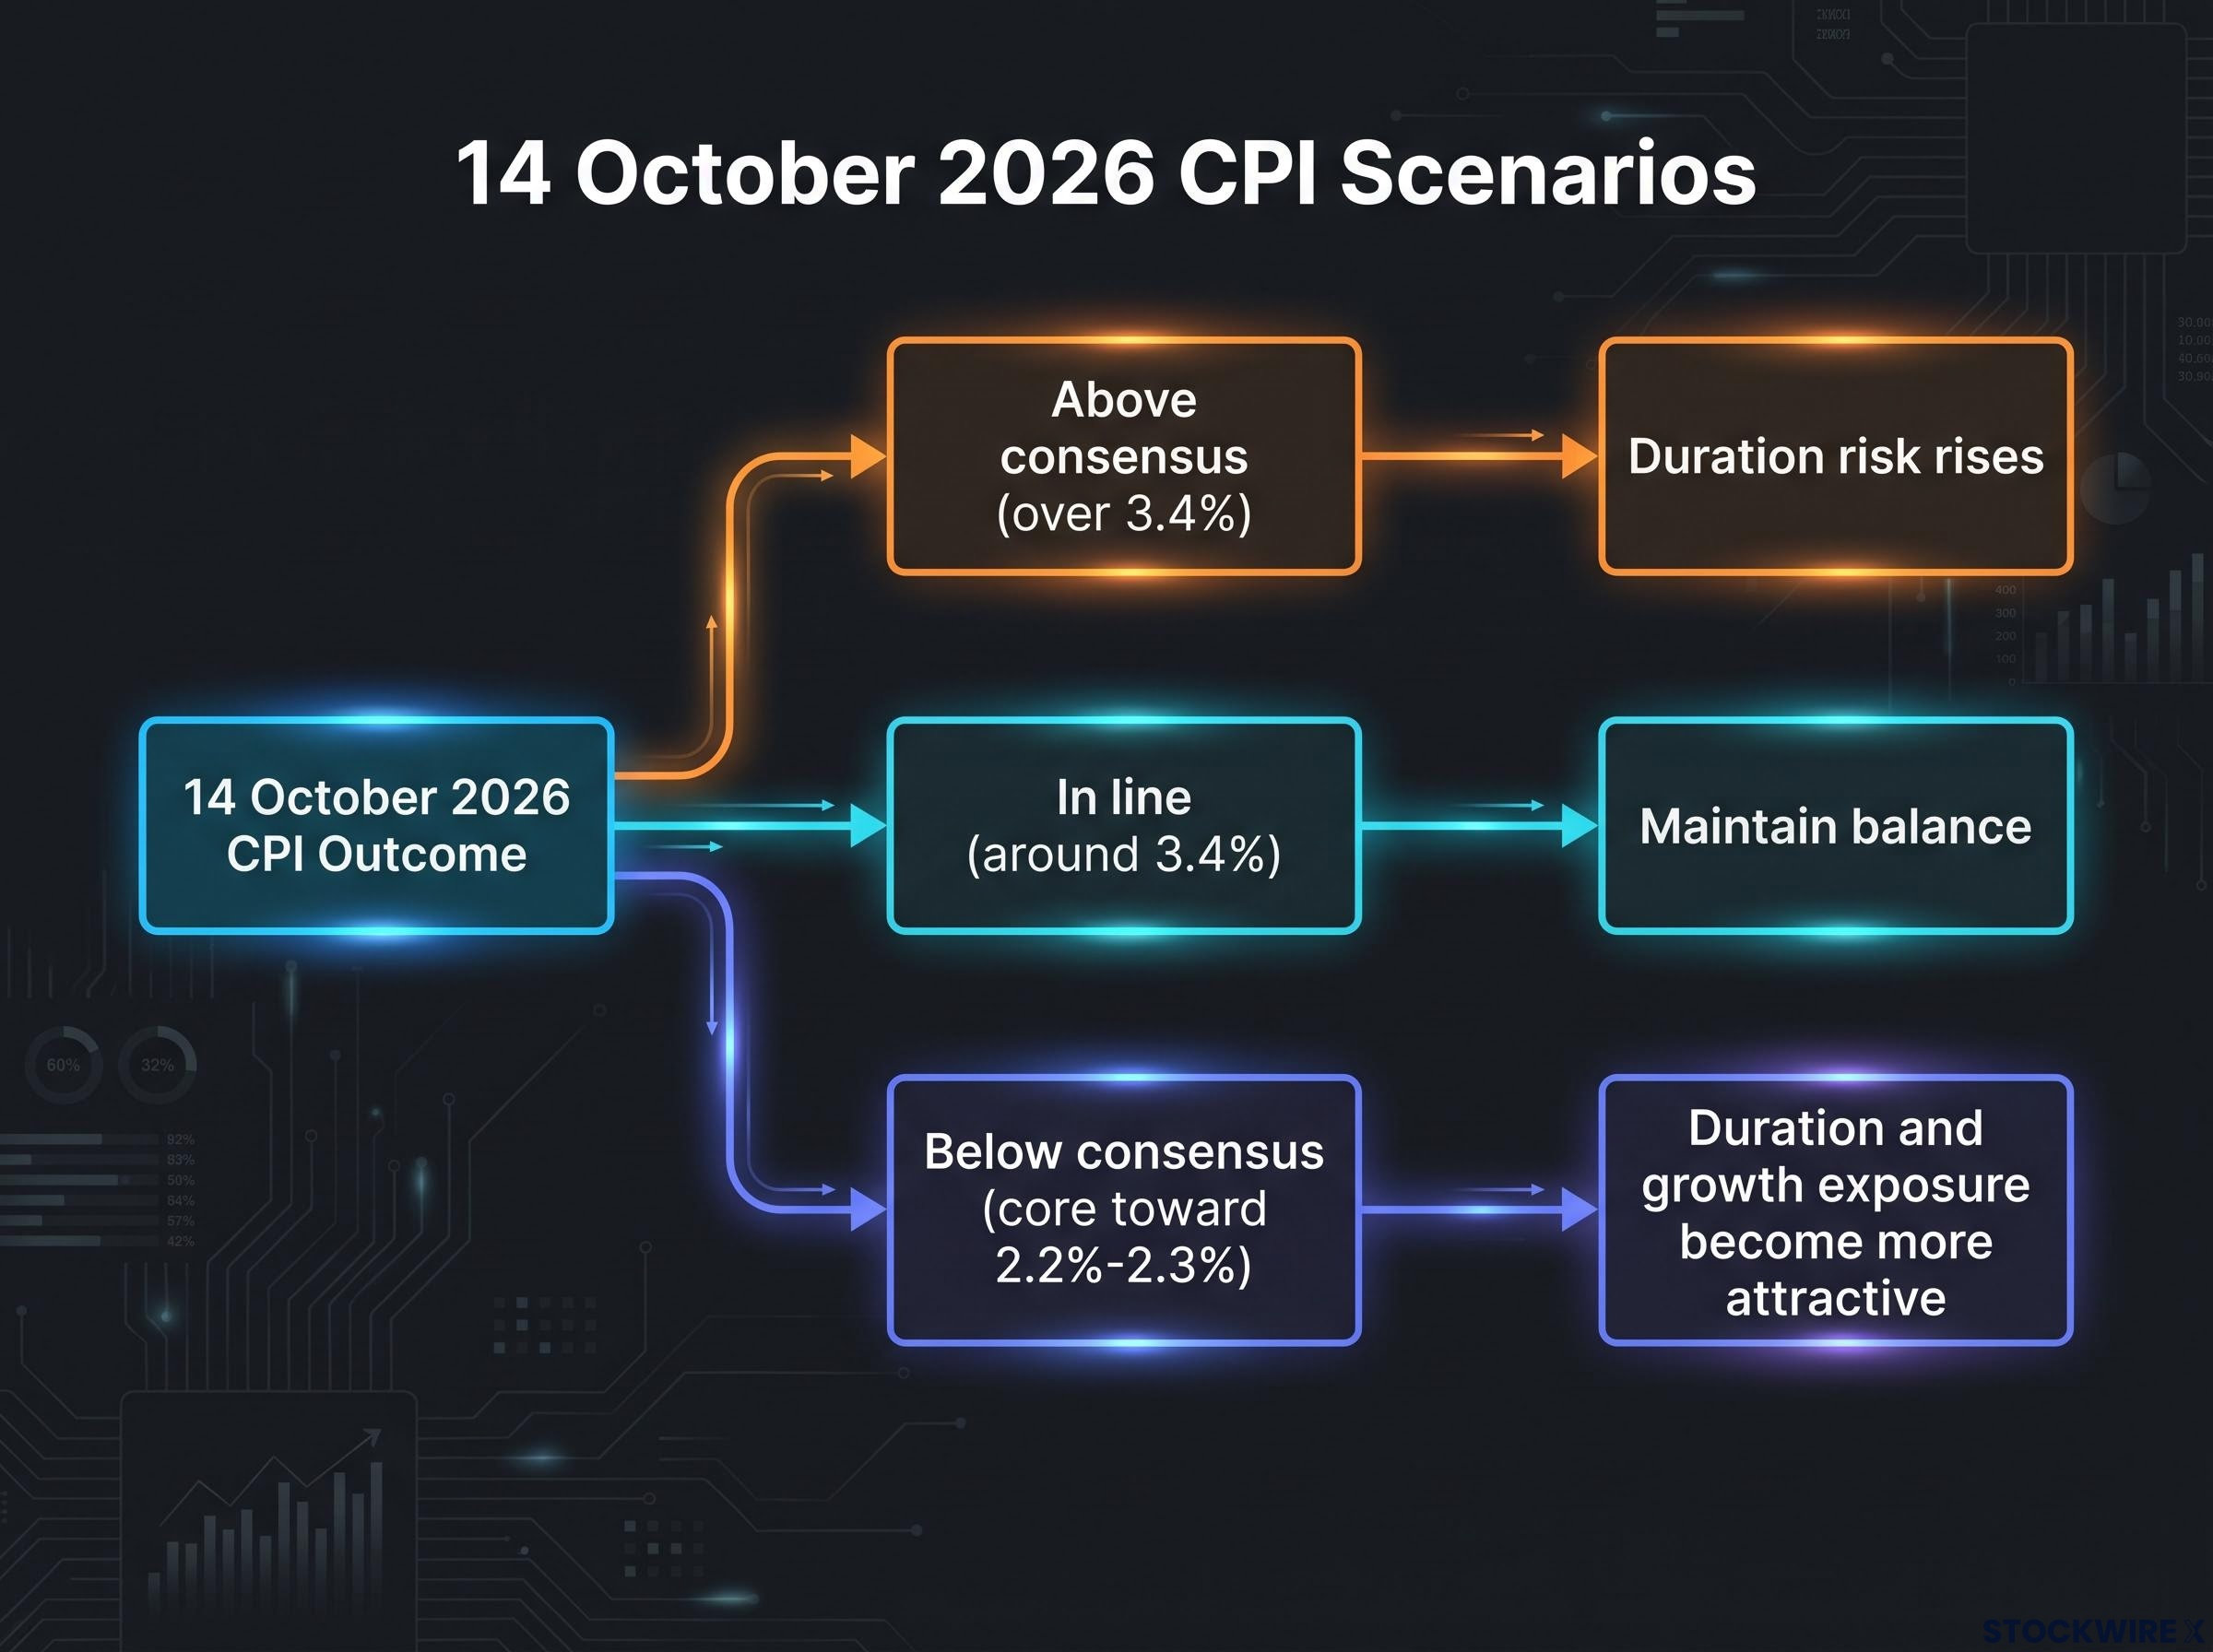
The single most important near-term data point is the 14 October 2026 CPI release. If headline inflation comes in above 3.4%, the case for Kashkari’s next projected hike firms considerably. If core continues decelerating toward 2.2%-2.3%, the dovish counterargument gains real traction.
Beyond CPI, watch the labour market. Non-farm payrolls and initial jobless claims will show whether the resilience Kashkari cites is holding or cracking. And listen to FOMC speak between now and the next scheduled meeting, remembering Kashkari’s own view that market signals should inform, not dictate, Fed decisions.
| CPI outcome (14 October) | Implied Fed signal | Portfolio implication |
|---|---|---|
| Above consensus (over 3.4%) | Kashkari’s hawkish case firms; next hike more likely | Duration risk rises; growth equities and long bonds vulnerable |
| In line (around 3.4%) | Status quo; data-dependent stance holds | Maintain balance; no strong signal either way |
| Below consensus (core toward 2.2%-2.3%) | Dovish counterargument strengthens | Duration and growth exposure become more attractive |
With r-star genuinely uncertain and the dot plot pointing to 4.1% through end-2027 before slow convergence to 3.6%, three structural disciplines are worth holding regardless of the print:
- Duration management: Favour shorter-duration fixed income; be cautious on long-maturity bonds most exposed to rising rates.
- Equity cash-flow focus: Prefer businesses with strong current cash flows and pricing power over long-duration growth.
- Foreign exposure hedging: Actively manage unhedged international and emerging market positions against a firming dollar.
Understanding what the October number needs to show to shift the trajectory puts you in a position to act rather than react.
This article is for informational purposes only and should not be considered financial advice. Investors should conduct their own research and consult with financial professionals before making investment decisions. Past performance does not guarantee future results. Financial projections are subject to market conditions and various risk factors.
Navigating a rate environment where even the Fed is not certain
Kashkari’s hawkishness is not simply about inflation being 3% rather than 2%. It runs deeper: it reflects real uncertainty over whether current rates are restrictive at all, given an unresolved question about where the neutral rate now sits. That uncertainty has a shelf life measured in months of data, not days.
The practical lesson follows directly. Treat the Fed’s rate path as fixed and you will be repeatedly surprised. Understand the data-dependency and the r-star problem underneath it, and you navigate the regime with far more discipline.
How this period resolves, whether through a soft landing, an overtightening accident, or a gradual disinflation, will be determined by data arriving over the next two to four quarters. That makes the monitoring framework above the most actionable tool you have.
For readers wanting to situate the r-star debate within the broader question of what the Fed can and cannot actually control, our full explainer on Federal Reserve limits examines how Milton Friedman’s long-and-variable-lags insight applies directly to the overtightening risk that Kashkari’s framework is accused of underweighting.
If you hold one thing in your head as you read every Fed communication over the coming six months, make it the October CPI print. It is the number that will tell you whether the higher-for-longer regime is tightening its grip or beginning to loosen.