Options markets are pricing Micron’s earnings move at roughly 7-8%, a figure that sounds straightforward until you look at what the skew is actually saying. The market is simultaneously treating a 19% upside move as significantly more likely than the equivalent downside.
Micron Technology reports fiscal Q4 2026 results today after the market close, and the structure of the options chain ahead of the print tells a more interesting story than the implied move headline suggests. The stock has compounded roughly eleven times in two years, analyst price targets cluster around $1,500 with an outlier at $2,000, and the December expiration cycle embeds meaningful probability mass well above current spot.
These are not decorative details. They are the inputs that shaped how market makers priced every strike on the board.
This piece unpacks each layer of the options signal in sequence. It starts with what the implied move tells you, moves through what the skew reveals that the headline number conceals, and ends with what the December probability distribution means for positioning. By the time you finish, you should be able to read Micron’s options chain as a structured argument rather than a collection of prices.
What the implied move headline is and is not telling you
The number circulating ahead of the print is an implied move of roughly 7-8%. That figure comes out of the at-the-money straddle, the combined cost of buying a call and a put at the current price, which is the market’s cleanest expression of how far it expects the stock to travel after earnings.
The precise figure depends on when you looked. The original source pegged the move near 7%, roughly 80 points in either direction from a spot near $1,050. Subsequent readings ran higher: GuruFocus put at-the-money straddle pricing at 7.7% on 29 September 2026, implying a trading range of $990 to $1,155, while Benzinga via TradingView reported 8.06% on 27 September. That spread is a data-timing artefact, not a contradiction. Implied volatility drifts in the days before a print, and each source captured a different moment.
The at-the-money straddle is itself a derivative of implied volatility, the single number that drives every option price and probability estimate on the chain; when IV drifts in the days before a print, the straddle price moves with it, which is why readings from different sources never quite match.
Here is where the headline stops being simple. Over the prior eight earnings cycles, the options market priced an average expected move of 8.4%, while the stock’s realised average move came in at 9.06%. In other words, Micron has historically travelled further than the options market priced it to.
MarketBeat characterised the 8-10% upper band of estimates as “unusually high event risk” for a company that has just crossed a $1 trillion market cap.
So the real question is not whether 7-8% is a big number. It is whether it is a credible one.
What a 50% exceedance rate actually means for positioning
For a normally distributed implied move, you would expect the stock to breach its own implied range roughly one-third of the time. That is the statistical baseline. Micron exceeded its implied move in four of its last eight earnings events, an exceedance rate of 50%.
That gap between 50% and the roughly 33% baseline is the number worth anchoring to. It tells you that Micron’s earnings moves have consistently punished traders who treated the implied move as a hard ceiling.
| Metric | Value |
|---|---|
| Average implied move (last 8 cycles) | 8.4% |
| Average realised move (last 8 cycles) | 9.06% |
| Exceedance rate (last 8 cycles) | 50% (4 of 8) |
| Statistical baseline exceedance rate | ~33% |
This cuts both ways. The exceedance can land on the upside or the downside, which is precisely why the skew data is the critical complement to everything you have just read.
When big ASX news breaks, our subscribers know first
The skew is where the real signal lives
The implied move tells you how far. The skew tells you which way the market is leaning, and it does so through the pricing of tail outcomes rather than the centre of the distribution. To read it, you compare the premium on a call against the premium on a put at the same distance from the current price.
Options skew is not a single number but a shape across the entire chain: the premium gradient from deep puts to deep calls encodes where institutional positioning is concentrated, and that gradient changes character entirely depending on whether the underlying asset is an index, a commodity, or an individual equity with an earnings catalyst.
Start at the money. With spot near $1,053, the implied move puts the expected post-earnings range at roughly $990 to $1,155. That is the symmetric picture. It falls apart the moment you step outside it.
Work the chain outward in three layers:
- At the money: the straddle prices a 7-8% move in either direction, the neutral starting point.
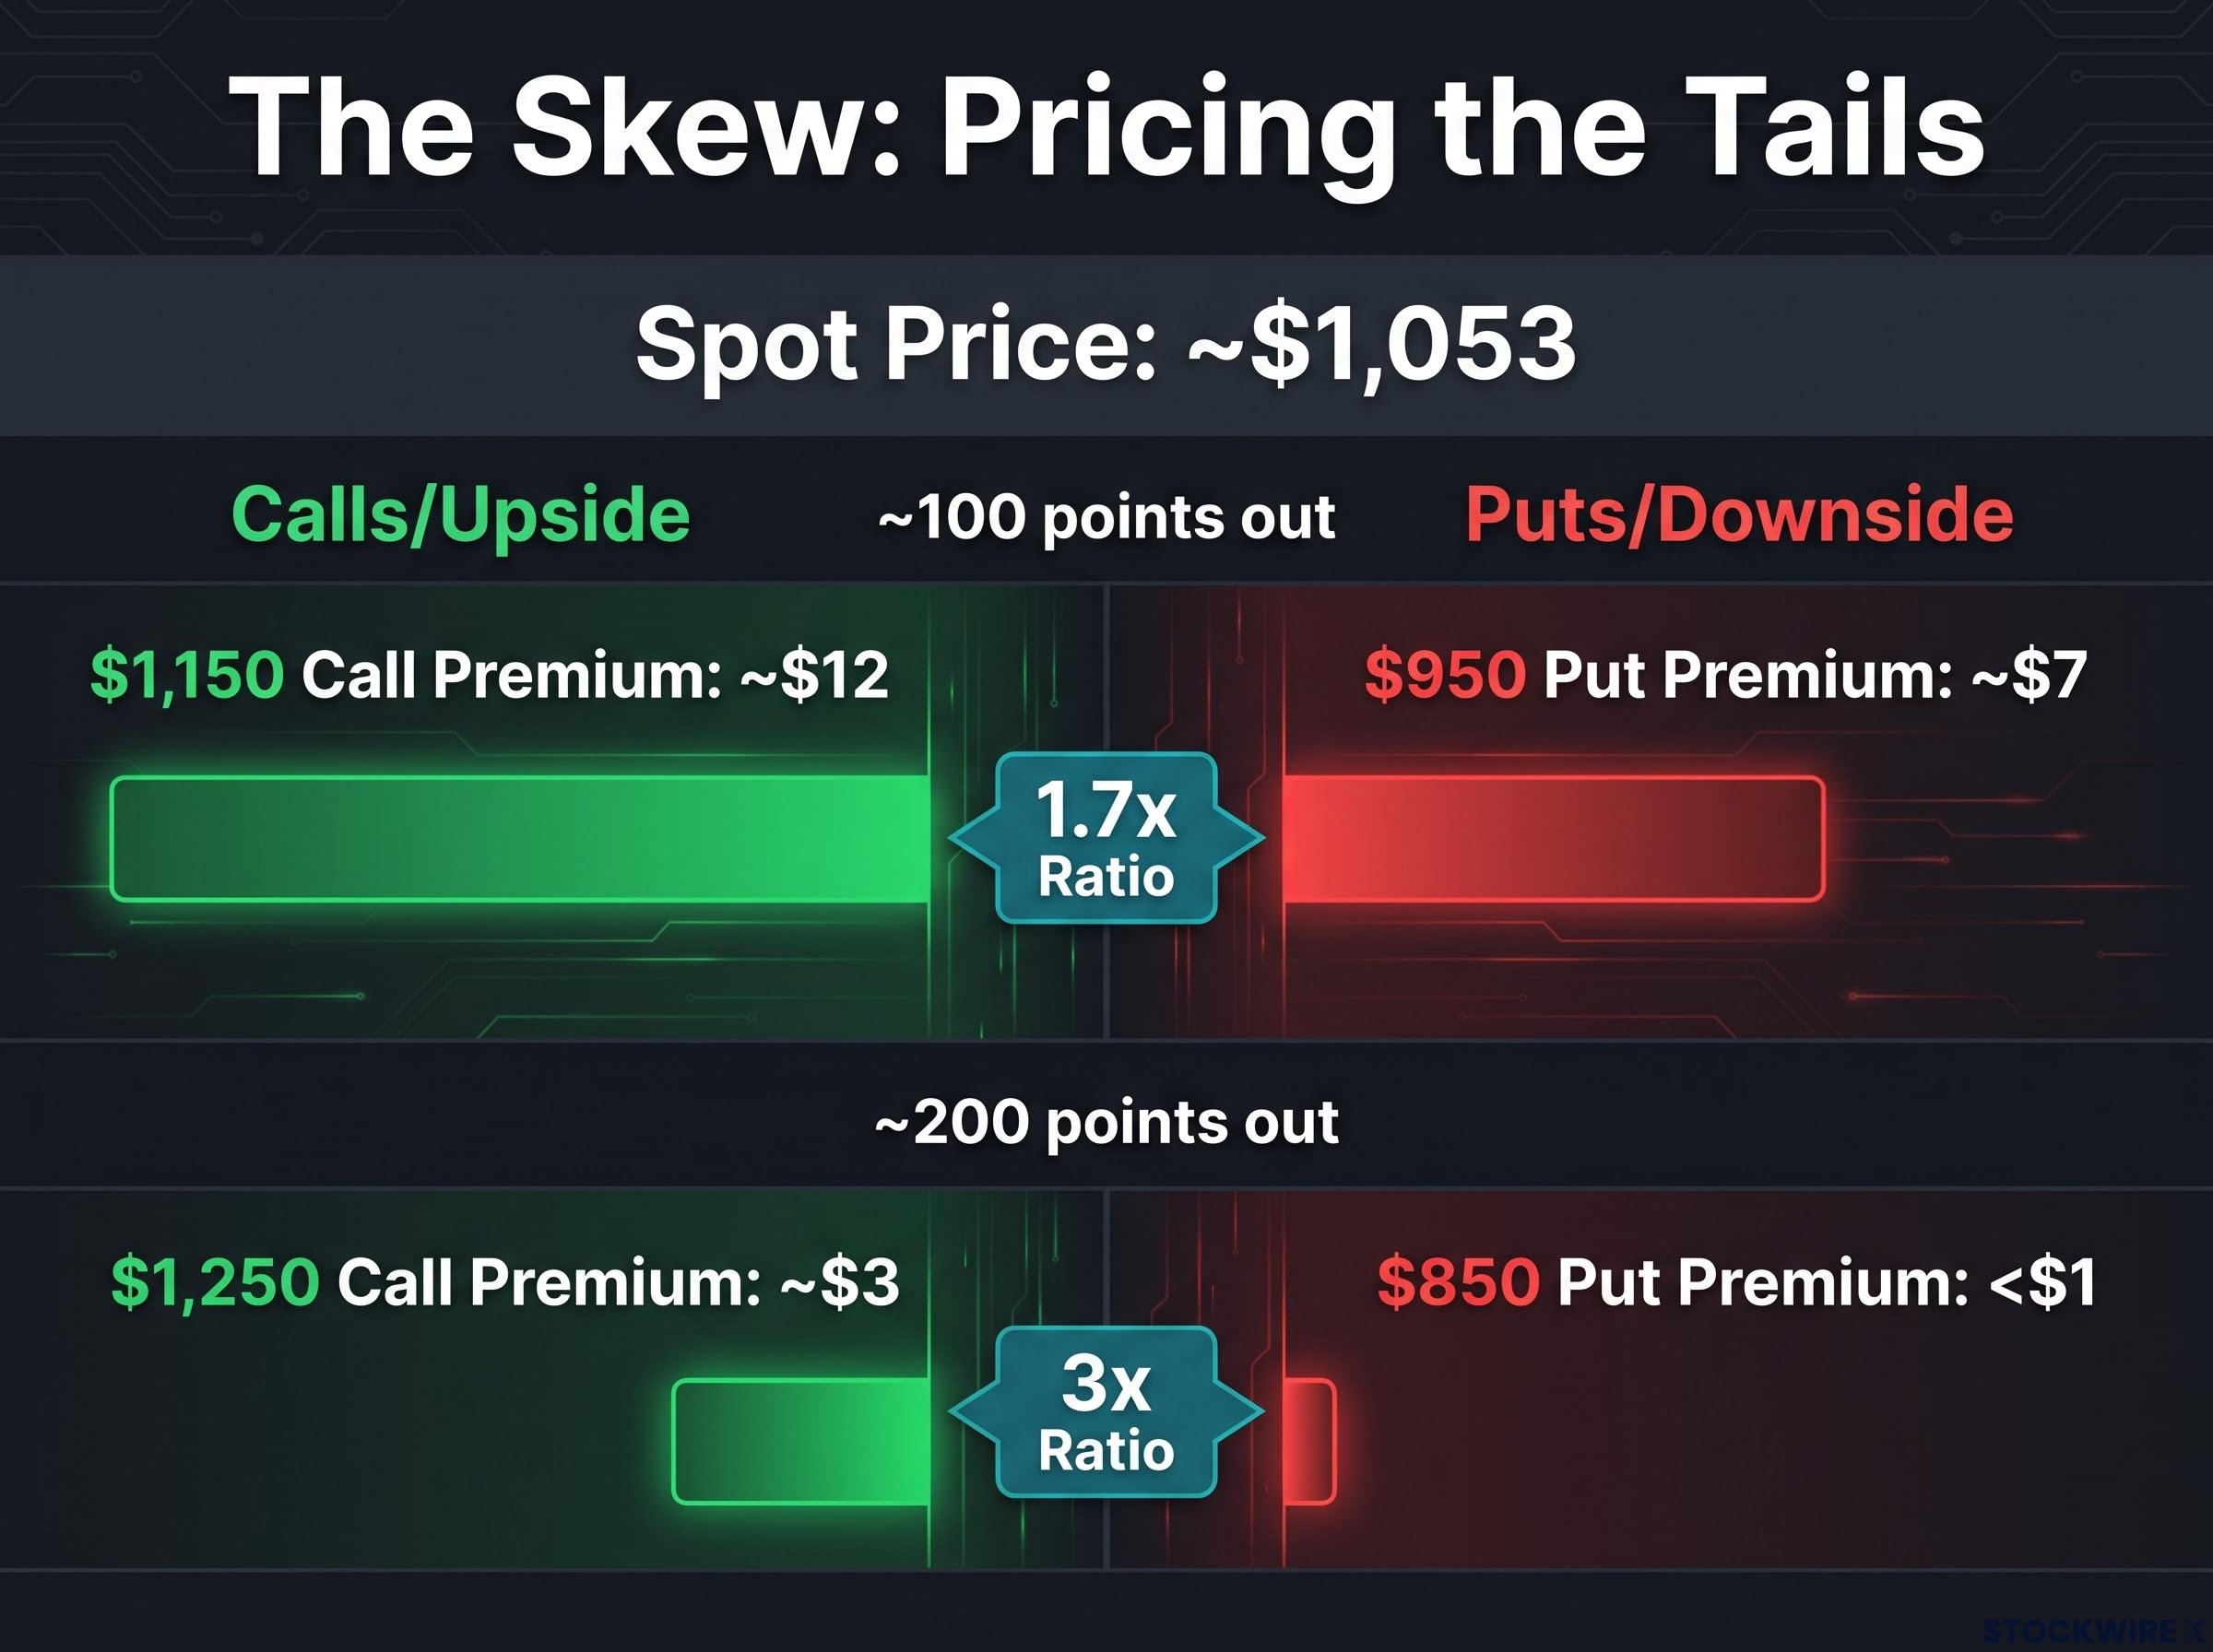
- 100 points out of the money: the $1,150 call traded near $12, while the equivalent $950 put traded near $7. That is a 1.7x asymmetry in favour of the upside.
- 200 points out of the money: the $1,250 call traded near $3, while the equivalent $850 put traded below $1 and was characterised as essentially worthless. That is roughly a 3x asymmetry.
| Strike Pair | Distance from Spot | Call Premium | Put Premium | Ratio |
|---|---|---|---|---|
| $1,150 / $950 | ~100 points | ~$12 | ~$7 | 1.7x |
| $1,250 / $850 | ~200 points | ~$3 | <$1 | ~3x |
The market priced roughly a 5% probability of the stock reaching $1,250 in the near-term four-day cycle. Read that alongside the downside: the equivalent $850 put is close to worthless, meaning the market is assigning something near zero to a move of the same magnitude in the other direction.
That is the argument embedded in every market maker’s book. Pricing a 5% chance on a 19% upside move while effectively writing off the equivalent downside is not a speculative anomaly. It reflects the structural asymmetry that analyst targets and AI-demand narratives have built into Micron’s valuation floor.
When the far upside trades at three times the far downside, the market is telling you which tail it fears more. Understanding that statement is what separates reading options data from simply observing it.
How Micron got here: the two-year run that made $1,500 feel like consensus
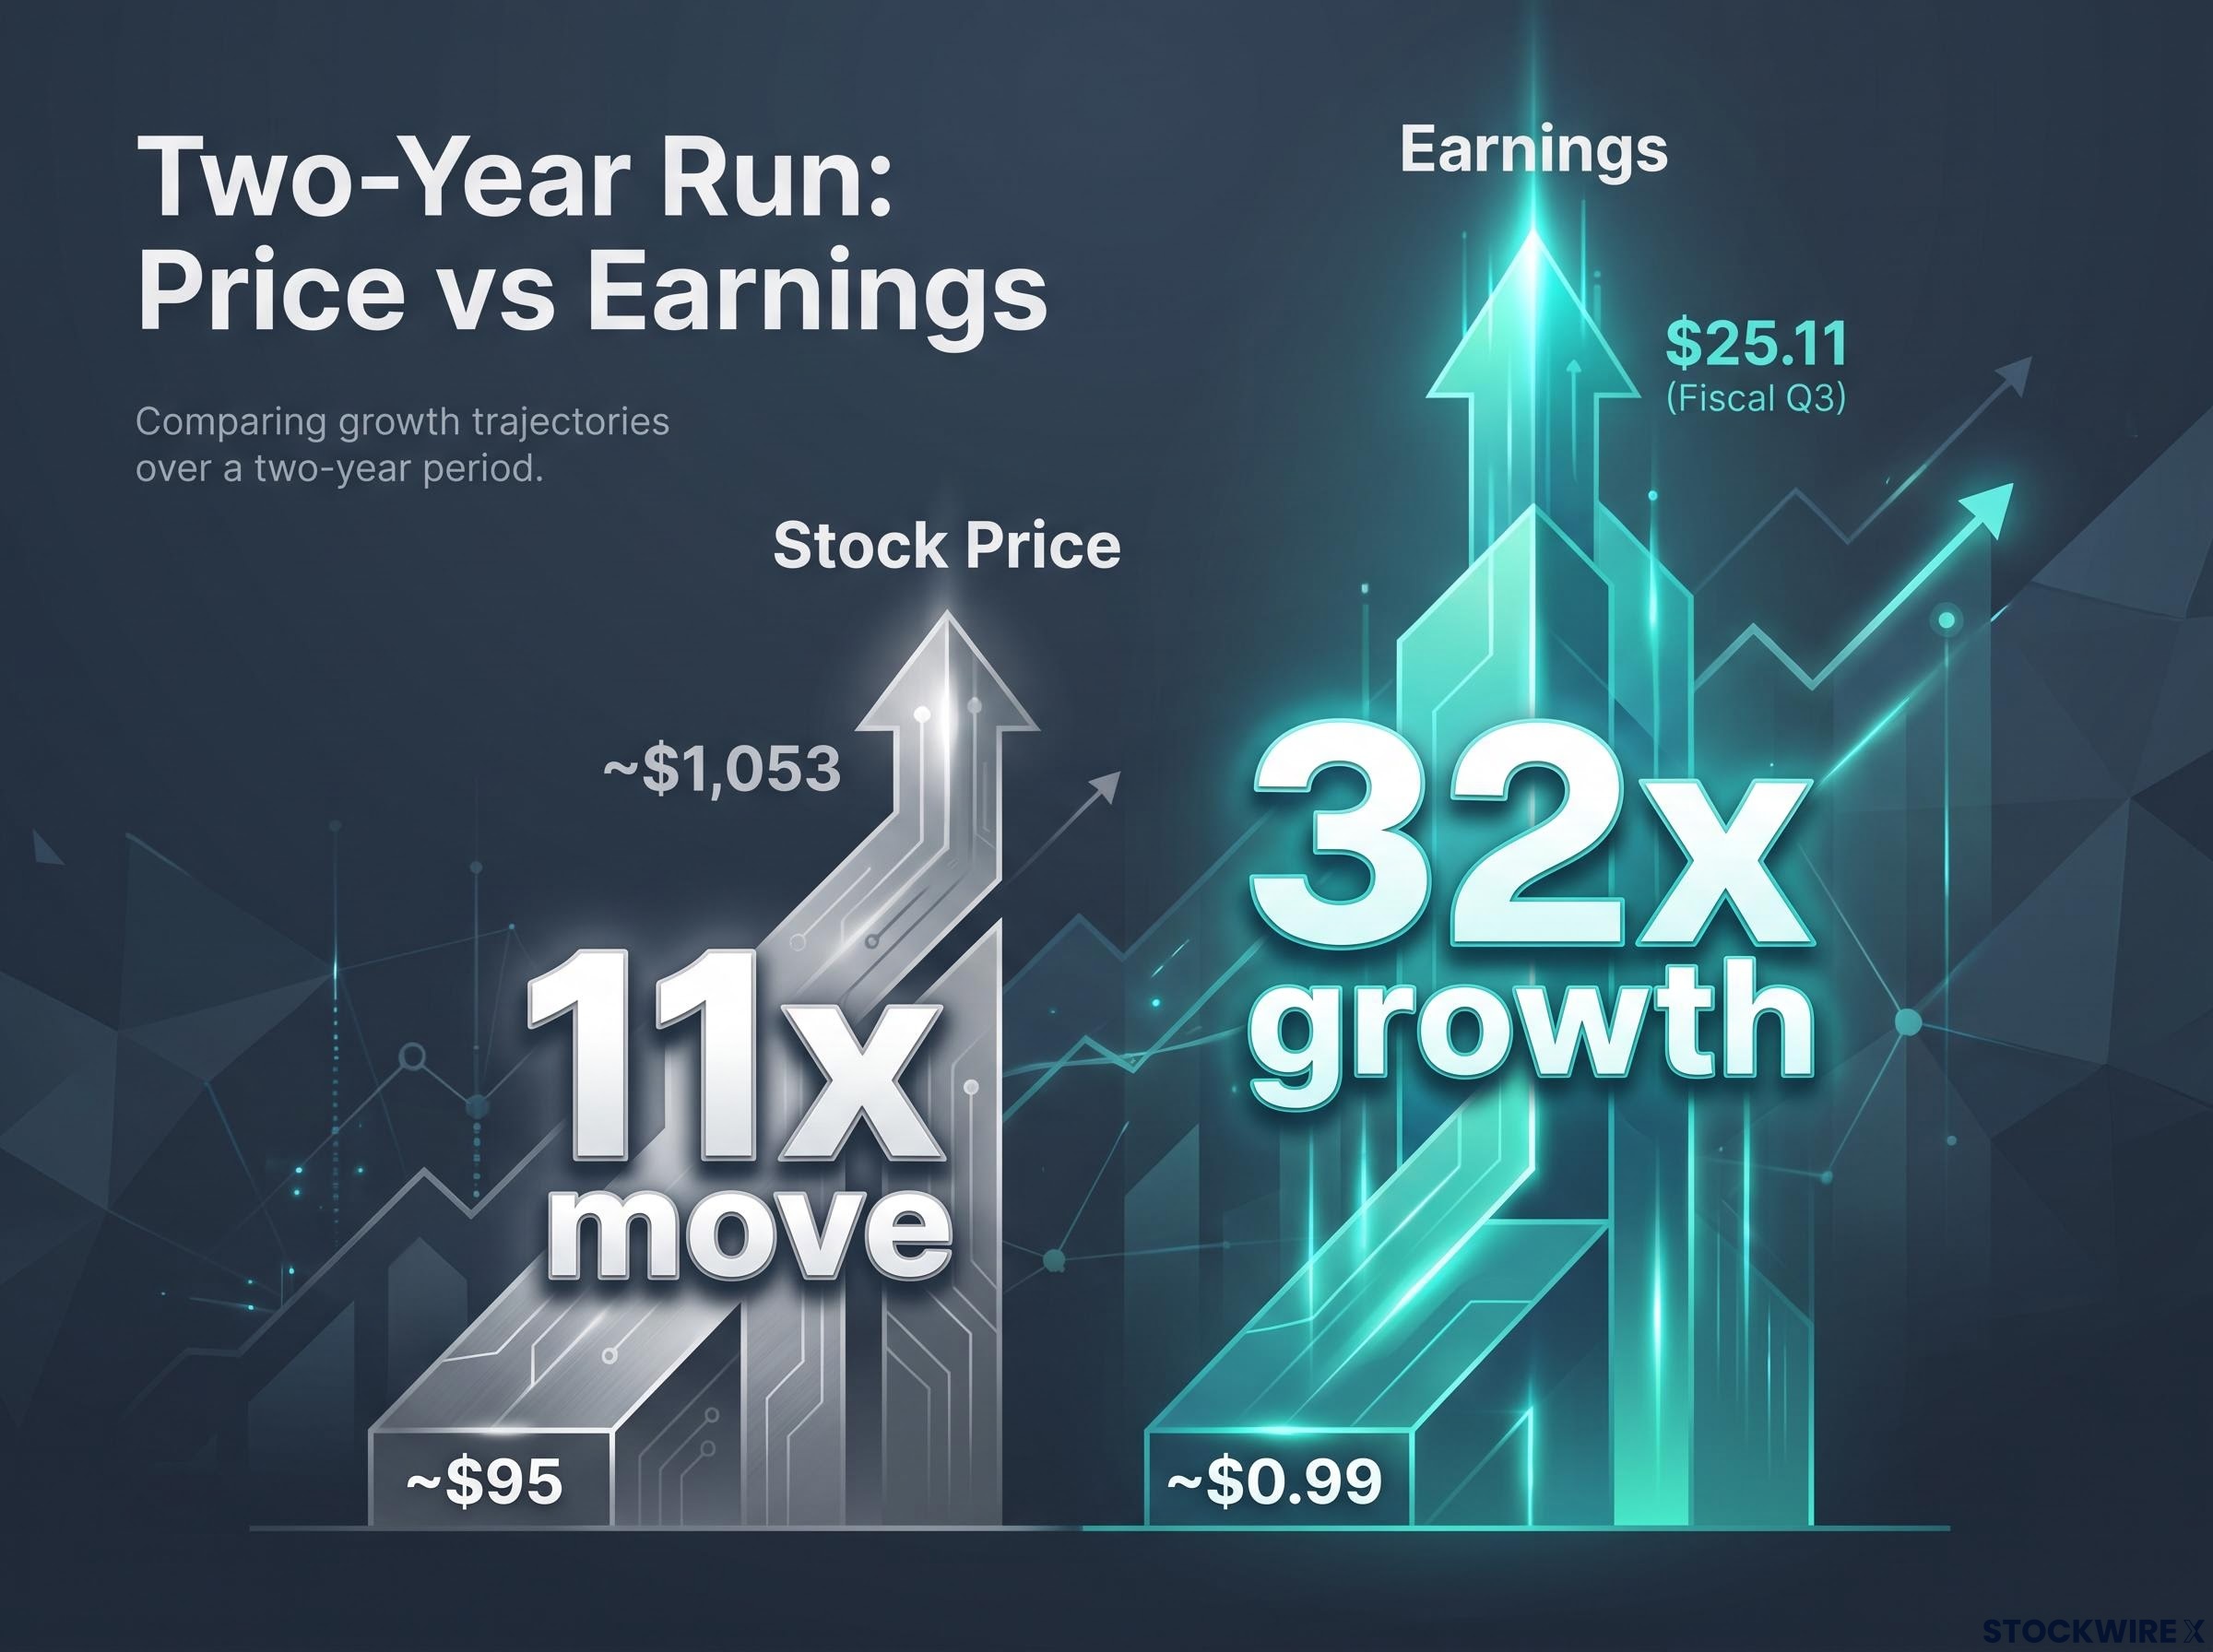
To understand why the skew leans so hard one way, you have to look at where the stock started. Two years ago, Micron reported quarterly earnings of roughly $0.99 per share and traded near $95. Today it sits near $1,053.
That is roughly an 11x move in the share price. Here is the detail that reframes the whole valuation debate: over the same period, quarterly earnings grew by roughly 32x. Earnings outpaced the stock. The run has been anchored in fundamentals rather than pure multiple expansion.
The most recent quarter made the point concrete. In fiscal Q3, Micron delivered EPS of $25.11 against a consensus of $21.39, a 17.39% surprise, on revenue of $41 billion, up 346% year over year.
The memory pricing dynamics behind Micron’s 346% revenue growth are not a one-quarter phenomenon: DRAM contract prices rose 90-95% in Q1 2026 and a further 58-63% in Q2, while HBM capacity has been sold out at major producers through 2026-2027, structural conditions that give the forward revenue and margin assumptions a supply-side anchor most earnings models cannot easily unwind.
The three structural forces behind that growth all feed the bull case:
- AI and HBM exposure: High-Bandwidth Memory (HBM), the memory stacked directly onto AI accelerator chips, has become a disproportionate driver of earnings power as AI infrastructure spending scales.
- Strategic customer visibility: Barclays flagged a new five-year strategic customer agreement, giving Micron durable revenue and margin visibility on advanced memory.
- Fiscal 2027 capacity and ASP outlook: Investor focus extends beyond near-term AI into forward capacity, average selling price (ASP) dynamics, and broader data centre demand.
Against that backdrop, the analyst target cluster stops looking aspirational. As of late September 2026, 46 analysts carried an average 12-month target of $1,520.76, with a high of $2,200 and a low of $361.
| Firm | Rating | Price Target | Date |
|---|---|---|---|
| D.A. Davidson | Buy | $2,000 | 28 Sep 2026 |
| UBS | Buy | $1,625 | Sep 2026 |
| Deutsche Bank | Buy | $1,550 | Sep 2026 |
| JPMorgan | Buy | $1,540 | 28 Sep 2026 |
One note on the data. The original source reported a Barclays target of $1,520, while subsequent research put its most recent documented figure at $1,175, raised from $675. Both cannot be current, so treat the Barclays number with caution.
D.A. Davidson reaffirmed its $2,000 target on 28 September 2026, having walked it up from an initial $1,000 in April, to $1,500 in May, to $2,000 in June.
That progression matters for options pricing. When institutional targets converge on the $1,500 level, market makers calibrating the December cycle are not ignoring it.
The earnings growth argument for elevated targets
The 32x EPS growth against 11x price appreciation is the entire argument for targets above $1,500. It says the bull case rests on earnings expanding faster than valuation, not on the market simply paying a richer multiple for the same profits.
The upcoming print is the next test. Consensus for fiscal Q4 sits at $31.55 adjusted EPS on roughly $50 billion in revenue, with gross margins approaching 86%. Clearing those numbers would compress trailing multiples further, and that is what keeps the elevated targets internally consistent.
What the December cycle’s probability distribution is actually pricing
Step out from the four-day earnings window to the December expiration, and the skew translates into something more actionable: a probability map. The options market prices roughly a 10% probability of Micron reaching $1,500 at December expiration, and roughly a 20% probability of touching $1,500 at any point before then.
Notice how tightly that aligns with the fundamentals. The average 12-month target is $1,520.76. A 10% expiration probability and a 20% touch probability are the options market’s translation of that target distribution into strike pricing you can act on. The alignment is not coincidental.
The market prices roughly a 20% probability that Micron touches $1,500 at some point before December expiration. That is the single most actionable probability statement in the longer-dated cycle.
Read that number honestly. A 20% touch probability means roughly one in five market participants running December scenarios expect Micron to reach a level requiring near-perfect HBM execution, sustained AI infrastructure spending, and no material macro disruption. The other four in five are not betting on it. That is the market’s genuine verdict, and the $1,250 peak reached during the prior rally is a reminder that $1,500 sits above any price the stock has actually printed.
The risks that explain why the bear case still has a price
Even an aggressively skewed market keeps the downside on the board for reasons worth naming:
- Cyclicality and valuation gravity: At a $1 trillion market cap, mean-reversion pressure builds. The memory market narrative still has to survive the inherently cyclical nature of semiconductors.
- HBM execution: Production shortfalls, supply constraints, or yield delays could stop Micron monetising AI demand at the scale that $1,500-plus targets assume.
- Macro and export control: Weakness in PC, smartphone, and enterprise demand outside AI remains a live concern, and Micron’s advanced memory carries direct exposure to US export-control regimes.
Export control enforcement against advanced AI chip shipments has already demonstrated its capacity to move individual semiconductor valuations in a single session: Nvidia’s approved Asian buyer list was cut by more than half in one regulatory sweep in July 2026, sending NVDA shares down 3.52% on heavy volume, a precedent that frames Micron’s own exposure as a quantifiable tail risk rather than a background concern.
Each of these is the specific condition that would reprice the December distribution. They are not general worries; they are the triggers that would pull the 20% touch probability lower.
Reading Micron’s options chain as a structured argument, not a set of prices
Pull the four threads together and the options chain reads as a single coherent statement. The implied move of 7-8% sets the expected event range, and the 50% exceedance history warns you not to treat it as a ceiling. The skew reveals the market fears the upside tail more than the downside. The analyst cluster at $1,520 anchors the December probability distribution, and the named risks explain why the bear case still commands a non-zero price.
Today’s print is the first empirical test of that thesis. The hurdle is specific: $31.55 adjusted EPS on roughly $50 billion in revenue, with gross margins near 86%. Clear it convincingly and the current skew is validated; fall short and the December probability map begins to reprice.
After the close, watch three variables in sequence:
- HBM revenue disclosure and forward guidance, the direct test of the demand narrative.
- Management commentary on ASP and fiscal 2027 capacity, which sets the ceiling on the bull case.
- Any signal on export-control exposure on the earnings call, the clearest downside tail.
The first number to check is not the beat or the miss. It is whether the December $1,500 touch probability moves up or down, because that figure is the market’s verdict on whether the structural bull thesis survived the print.
This article is for informational purposes only and should not be considered financial advice. Investors should conduct their own research and consult with financial professionals before making investment decisions.
Past performance does not guarantee future results. Financial projections are subject to market conditions and various risk factors. Probability figures derived from options pricing are estimates and subject to change based on market developments and company performance.