
Most income investors know the covered call by heart: buy a stock, sell a call against it, collect the premium. Far fewer know that entering the very same trade from the other side, by selling a put first, quietly changes the odds of how you get in.
That gap between what most retail investors actually do and what a full wheel is built to do is worth understanding right now. Treasury yields sitting near 4% mean the cash you park behind a cash-secured put is no longer dead money; it earns income of its own while you wait, compressing the cost of patience that used to make the strategy feel like a drag.
The Peerless Option Income Wheel ETF (WEEL) is one vehicle packaging this whole machine for investors who like the logic but do not want to run the mechanics themselves. After reading this, you will know whether the options wheel strategy’s trade-offs actually suit your income goals, and what a fund like WEEL adds, or does not add, beyond doing it yourself.
What the options wheel strategy actually does, step by step
Open your brokerage screen after the first trade and you will see something that looks deceptively simple: a short put position with a premium already credited to your account. You have been paid, and you own no stock yet. That single line is the entry point to a three-phase loop, and the loop is why it is called a wheel rather than just “selling options.”
Here is the cycle in sequence:
- Phase 1: Sell a cash-secured put. You sell a put option on a stock or ETF you would be willing to own, and you hold the full purchase price in cash. You collect the premium immediately. “Cash-secured” is the structural rule here: the entire notional value must sit in cash or equivalents, never borrowed, which is exactly why institutional versions park that cash in Treasury bills.
- Phase 2: Accept assignment, or let the put expire. If the stock stays above your strike price, the put expires worthless, you keep the premium, and you go back to Phase 1. If the stock falls below the strike, you are assigned the shares at that strike price.
- Phase 3: Sell a covered call. Now that you own the shares, you sell a call option against them, collecting another premium. If the shares get called away, you are back to cash and the wheel turns again to Phase 1.
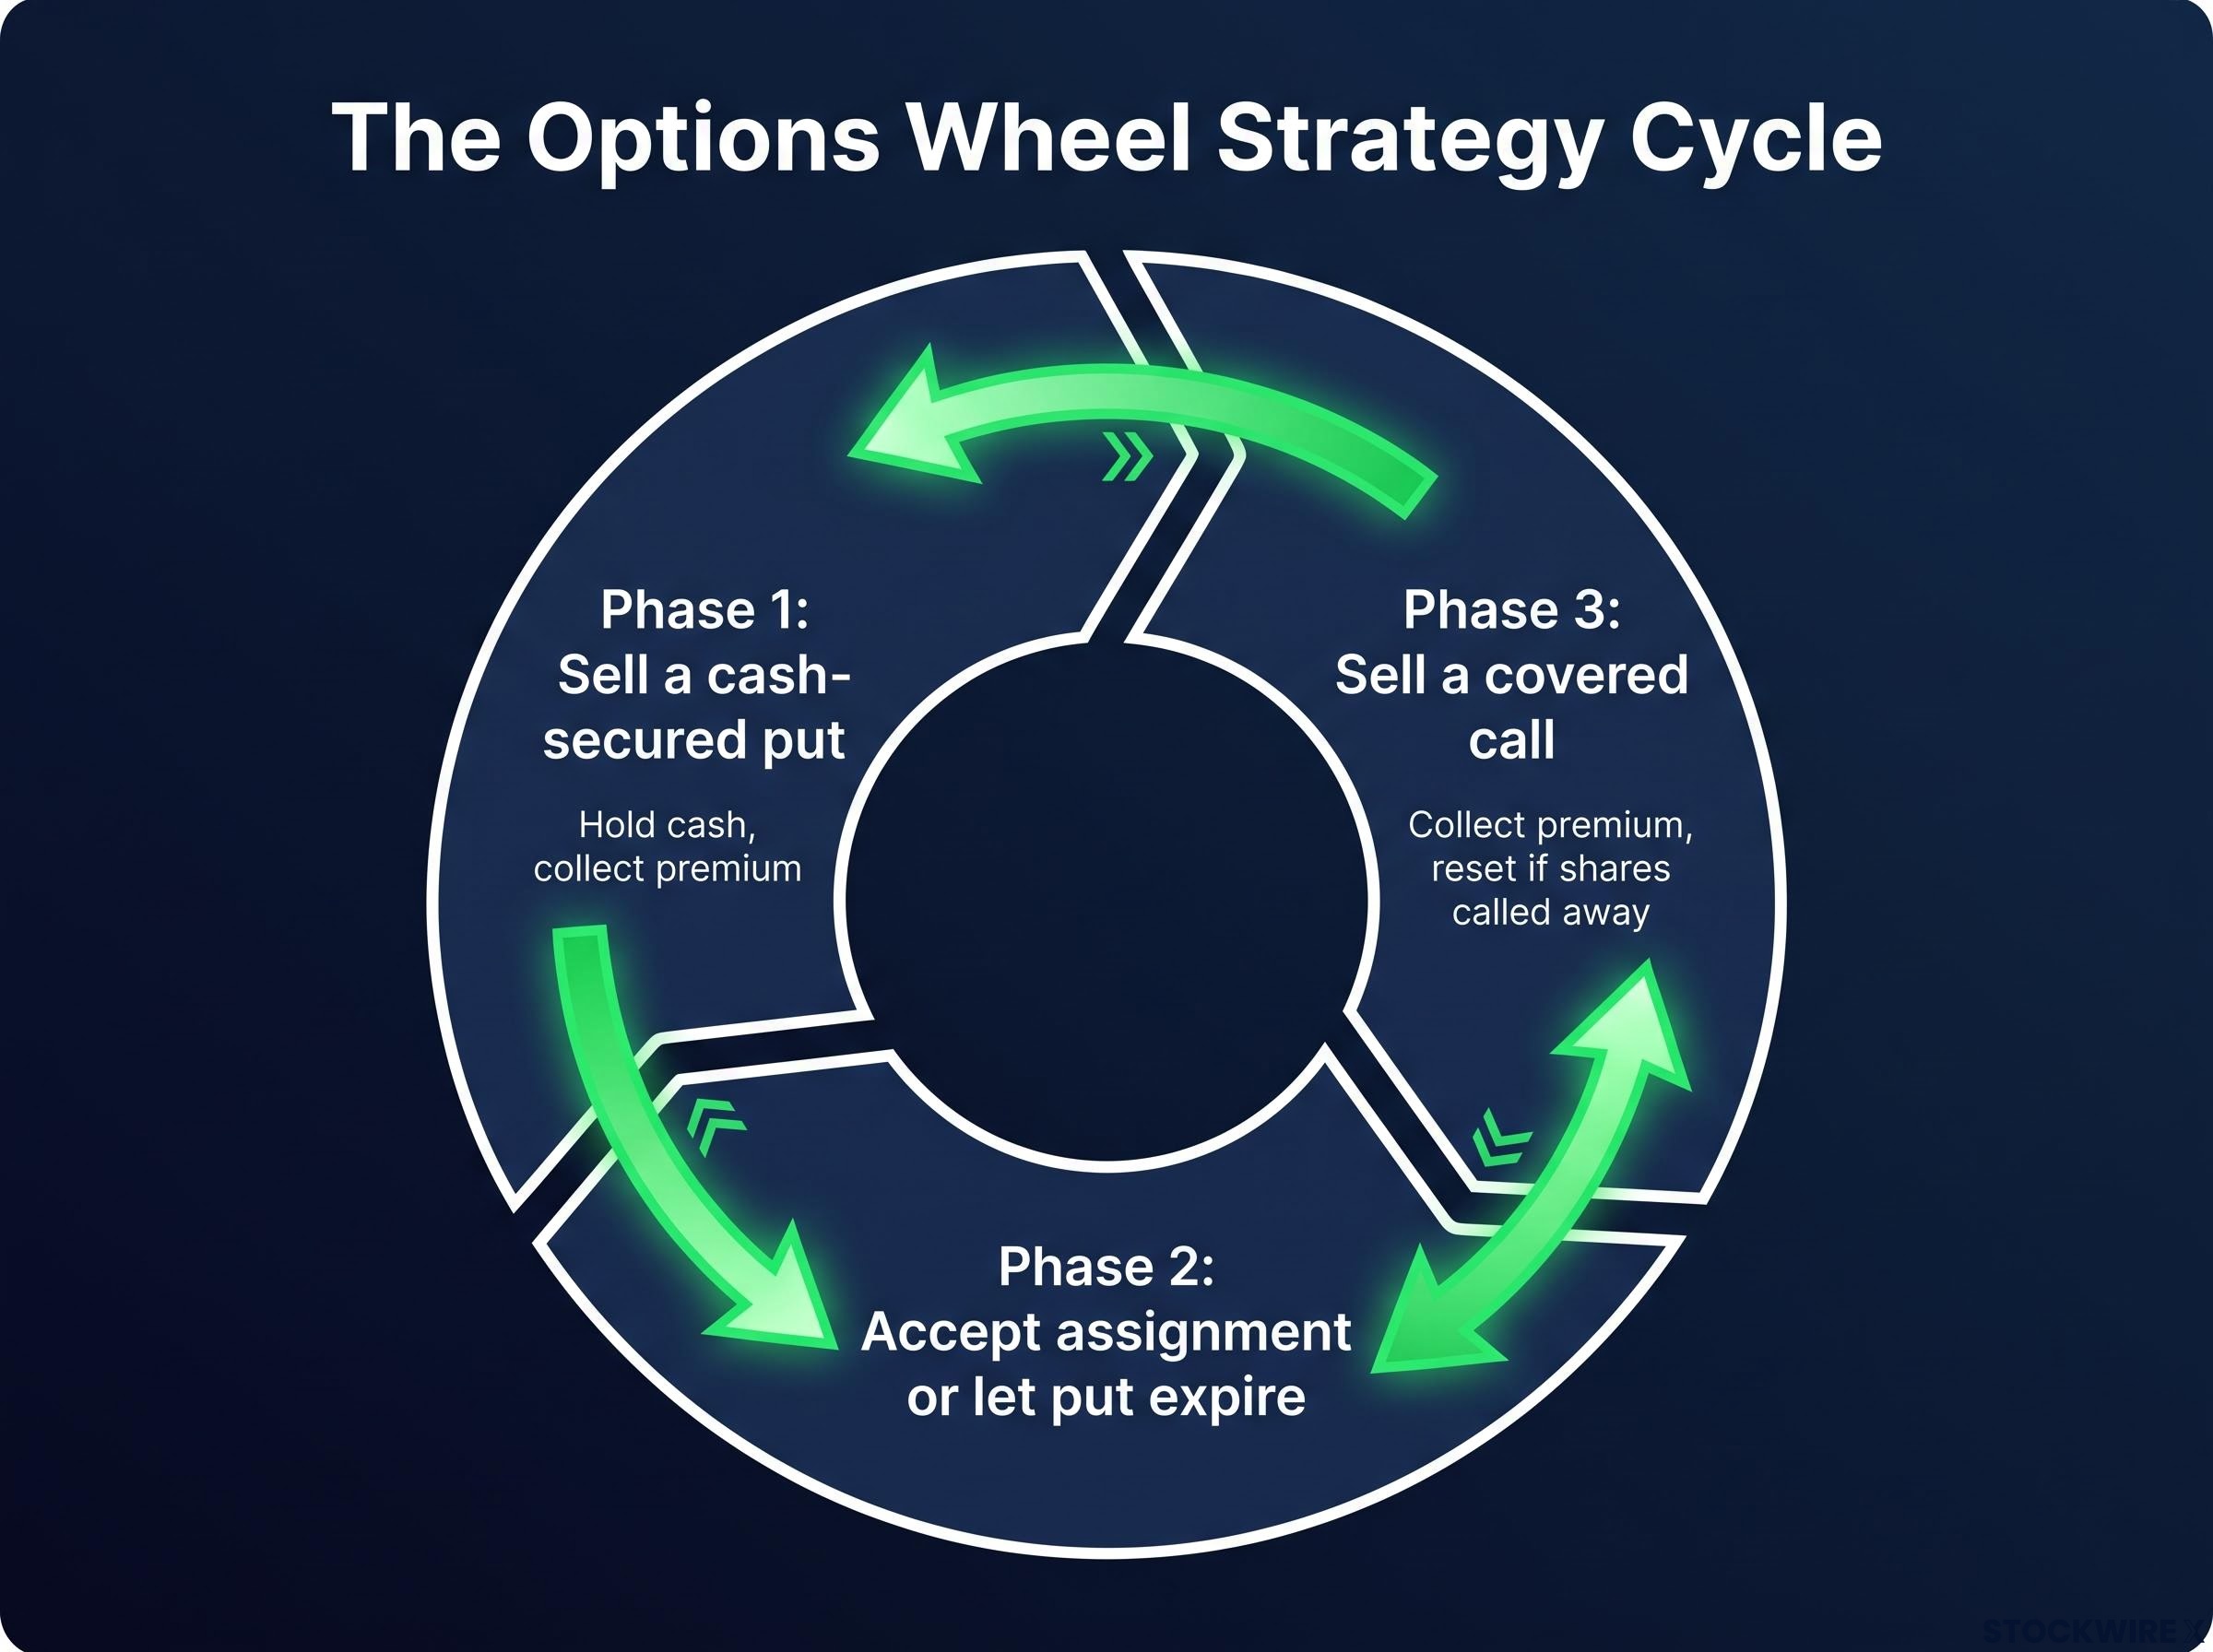
Each phase is a decision, not an autopilot setting. Strike selection, how far out you sell, and whether you roll or accept assignment all feed directly into your cost basis and your income. This is the part most yield figures never show you.
Long-run evidence supports the idea that both legs harvest something real. The CBOE PUT index (put-write) and BXM index (buy-write) have both historically earned option premium while running at lower volatility than a passive equity benchmark. Options practitioner research also suggests that strikes, tenors, and roll rules shape outcomes far more than which leg starts the wheel.
The takeaway is that the wheel is not passive income. It is an active position-management cycle where every turn asks something of you.
When each leg expires in-the-money versus worthless
The wheel’s path forks depending on where prices land at expiry, so it helps to walk through both outcomes.
If the put expires worthless, you never take the shares. You simply pocket the premium and sell another put in Phase 1, earning income again without ever owning stock.
If the put expires in-the-money, you are assigned. Your effective cost basis becomes the strike price minus the premium you already collected, which is often below what you would have paid buying outright.
And if the covered call in Phase 3 expires in-the-money, your shares are called away at the strike, you keep that premium too, and the cycle resets to a fresh cash-secured put.
When big ASX news breaks, our subscribers know first
Why starting with a put, not a stock purchase, changes the entry math
Put two investors side by side. One sells a cash-secured put on a stock trading at $100, choosing a $95 strike and collecting $2 in premium. The other simply buys the shares at $100 and immediately writes a covered call.
If the stock drifts down and the first investor is assigned, their effective cost basis is $93, the strike minus the premium. The second investor is already long at $100 with no entry discount at all. That is the asymmetry at the heart of the wheel: the put-seller can get in below market, in exchange for one specific risk.
That risk is never getting in. If the stock rallies hard and stays well above $95, the put-seller keeps only the $2 premium and misses the entire move. In a strong bull market, this is a documented opportunity cost, and it is the honest cost of demanding a discount.
WEEL’s designers frame put-initiation as probabilistically superior for exactly this reason: the premium builds a cushion into your entry that an outright share purchase never provides. The CBOE indices tell a similar story. The PUT index tends to outperform in mildly down or sideways markets by entering at lower effective prices, while the BXM index can suit investors whose primary aim is ongoing equity exposure plus income.
The CBOE PUT and BXM index research from Cboe Global Markets documents the cumulative return histories of both strategies across multiple market regimes, showing that put-write consistently entered positions at lower effective cost bases while buy-write better suited investors prioritising continuous equity exposure.
| Attribute | Cash-secured put entry | Buy shares plus covered call |
|---|---|---|
| Starting cost basis | Strike minus premium, often below market | Full market price from day one |
| Immediate equity exposure | None until assigned | Full long exposure immediately |
| Premium income source | Put premium plus Treasury yield on collateral | Call premium only |
| Behaviour in a sharp rally | Keeps premium, misses the rally entirely | Participates up to the call strike |
There is one more piece that changes the maths in your favour today, and it did not exist at scale a few years ago.
With 3-month Treasury bill yields near 4% as of late September 2026, the cash collateral behind a cash-secured put is doing real income work. During the zero interest rate era, that collateral earned almost nothing, so the only income was the option premium.
At today’s rates, a U.S. investor running cash-secured puts earns on two fronts at once: the option premium plus roughly 4% annually on the full notional value sitting in T-bills. That dual income stream is a structural advantage the strategy simply did not have during the zero-rate years, and it is worth weighting heavily if you are evaluating the wheel right now rather than in the abstract.
How WEEL packages the wheel for investors who do not want to run it themselves
All of that mechanical detail is exactly what a fund like WEEL is built to spare you. The Peerless Option Income Wheel ETF takes the wheel and runs it across diversified sector ETFs rather than individual stocks, which is where abstract theory becomes a concrete product with concrete trade-offs.
The fund’s design choices are deliberate:
- Cash-secured puts and covered calls written on sector ETFs, not single names
- Collateralised entirely with short-term U.S. Treasuries
- Diversified across sectors and strategies, with low correlation between holdings treated as a core principle
- A 40 Act structure that mandates full collateralisation and permits no leverage
- A patent-pending strategy classification
That 40 Act framework matters more than it first appears. It legally requires the fund to be fully collateralised and brings regulatory oversight that you, running the wheel in a personal account, would never have imposed on you. The fund launched on 16 May 2024 and is co-managed by Rob Pascarella and his partner Erik at Peerless Wealth, with Pascarella’s engineering and quantitative background shaping the probability-focused methodology.
The performance record so far is short but informative. According to the Peerless ETFs official site, WEEL has returned an annualised 13.21% since inception as of 31 August 2026, and Yahoo Finance reported a distribution rate of 11.86% as of 24 September 2026. Set against JEPI over the same window, the comparison sharpens.
Covered call ETF distributions blend option premiums, ordinary dividends, and return of capital in proportions that shift with market conditions, meaning the 11-12% figure WEEL currently posts is not structurally guaranteed and could compress if volatility contracts or option pricing regimes normalise.
| Metric (16 May 2024 to 21 Sep 2026) | WEEL | JEPI |
|---|---|---|
| Cumulative total return | 33.33% | 19.31% |
| CAGR | 13.03% | 7.81% |
| Volatility | 12.47% | 10.72% |
| Maximum drawdown | 17.43% | 13.26% |
| Sharpe ratio | 0.72 | 0.37 |
WEEL beat JEPI on total return and on risk-adjusted return, per Yahoo Finance data published 24 September 2026. But read the drawdown line before you get comfortable: WEEL’s 17.43% maximum drawdown was meaningfully deeper than JEPI’s 13.26%. That tells you WEEL accepted more downside variance to produce more income and return, a trade you need to weigh against your own tolerance for the bad days. Worth noting too: with assets under management of roughly $43-44.4 million as of September 2026, this is still a small fund.
What the 0.99% fee buys and what it costs
WEEL carries a gross expense ratio of 1.24%, reduced to a net 0.99% by a 0.25% contractual waiver, per Yahoo Finance. That fee is the price of delegation.
For your 0.99%, you are buying professional strike selection, roll management, sector diversification, and the regulatory compliance baked into the 40 Act structure. Running the wheel yourself is not free either: it costs you time, execution friction, commissions on repeated option cycles, and the tax events that come with frequent assignment and re-entry.
For a very active, experienced trader running diversified wheels across multiple ETFs, doing it yourself may work out cheaper. For most retail investors, the delegation cost is likely justified by everything the fee absorbs.
Where the wheel breaks down and what investors need to weigh before using it
Everything so far leans toward the wheel, so here is the friction it deserves. The strategy has specific failure modes, and knowing them is the difference between a compatible allocation and an unpleasant surprise.
Three risks stand out:
- Assignment risk in sharp selloffs. Sell a put ahead of a fast decline and you can be assigned at a strike that immediately sits well above the new, lower market price. CBOE’s PUT index work shows put-writers still take large drawdowns in crises, because a short put behaves like a partially hedged long position.
- Opportunity cost in sustained bull markets. The covered call caps your upside. In a persistent rally you repeatedly sell calls that expire in-the-money and give up the gains beyond the strike, leading to chronic underperformance versus buy-and-hold.
- Behavioural mismatch. Investors who bail out during a drawdown forfeit the income thesis entirely, turning a smoothing strategy into a realised loss.
Naked short put losses accelerate sharply in fast selloffs because delta moves toward negative one and implied volatility spikes simultaneously, a dynamic the April 2025 drawdown illustrated clearly when VIX averaged 31.97 for the month and bid-ask spreads on exit trades widened enough to make theoretical loss estimates materially understate realised costs.
There is also the question of whether double-digit yield lasts.
The 11-12% distribution range comes from option premiums plus Treasury yield. It is not return of capital in the structural sense, but it is not guaranteed at these levels either. If volatility contracts or option pricing regimes shift, the income can compress.
The single most useful anchor for the upside-cap problem is a direct number.
WEEL returned 14.28% over the past year (Yahoo Finance, 25 September 2026) against a category average of 24.17%. That 9.89 percentage point gap is not a fund failure. It is the design working exactly as intended in a strong market.
Read that gap as a calibration test. If missing nearly ten points of upside over the past year would have frustrated you, the wheel’s ceiling is not compatible with what you are trying to achieve. Experts consistently frame this as a behavioural and risk-management trade, not a return-maximisation strategy, and CBOE’s BXM research confirms buy-write approaches materially lag in persistent uptrends because foregone upside exceeds premiums collected.
Making an informed call on the wheel in a rate-plateau environment
Pull the threads together and the current environment tilts the maths more favourably than the strategy’s zero-rate origins ever allowed. With 3-month T-bill yields at roughly 4.08-4.19% as of late September 2026, per FRED and TradingEconomics, the collateral income component is structurally stronger than the historical average would suggest.
FRED 3-month Treasury yield data from the Federal Reserve Bank of St. Louis shows daily readings through late September 2026 in the 4.08-4.19% range, providing the authoritative benchmark behind the collateral income figures cited throughout this analysis.
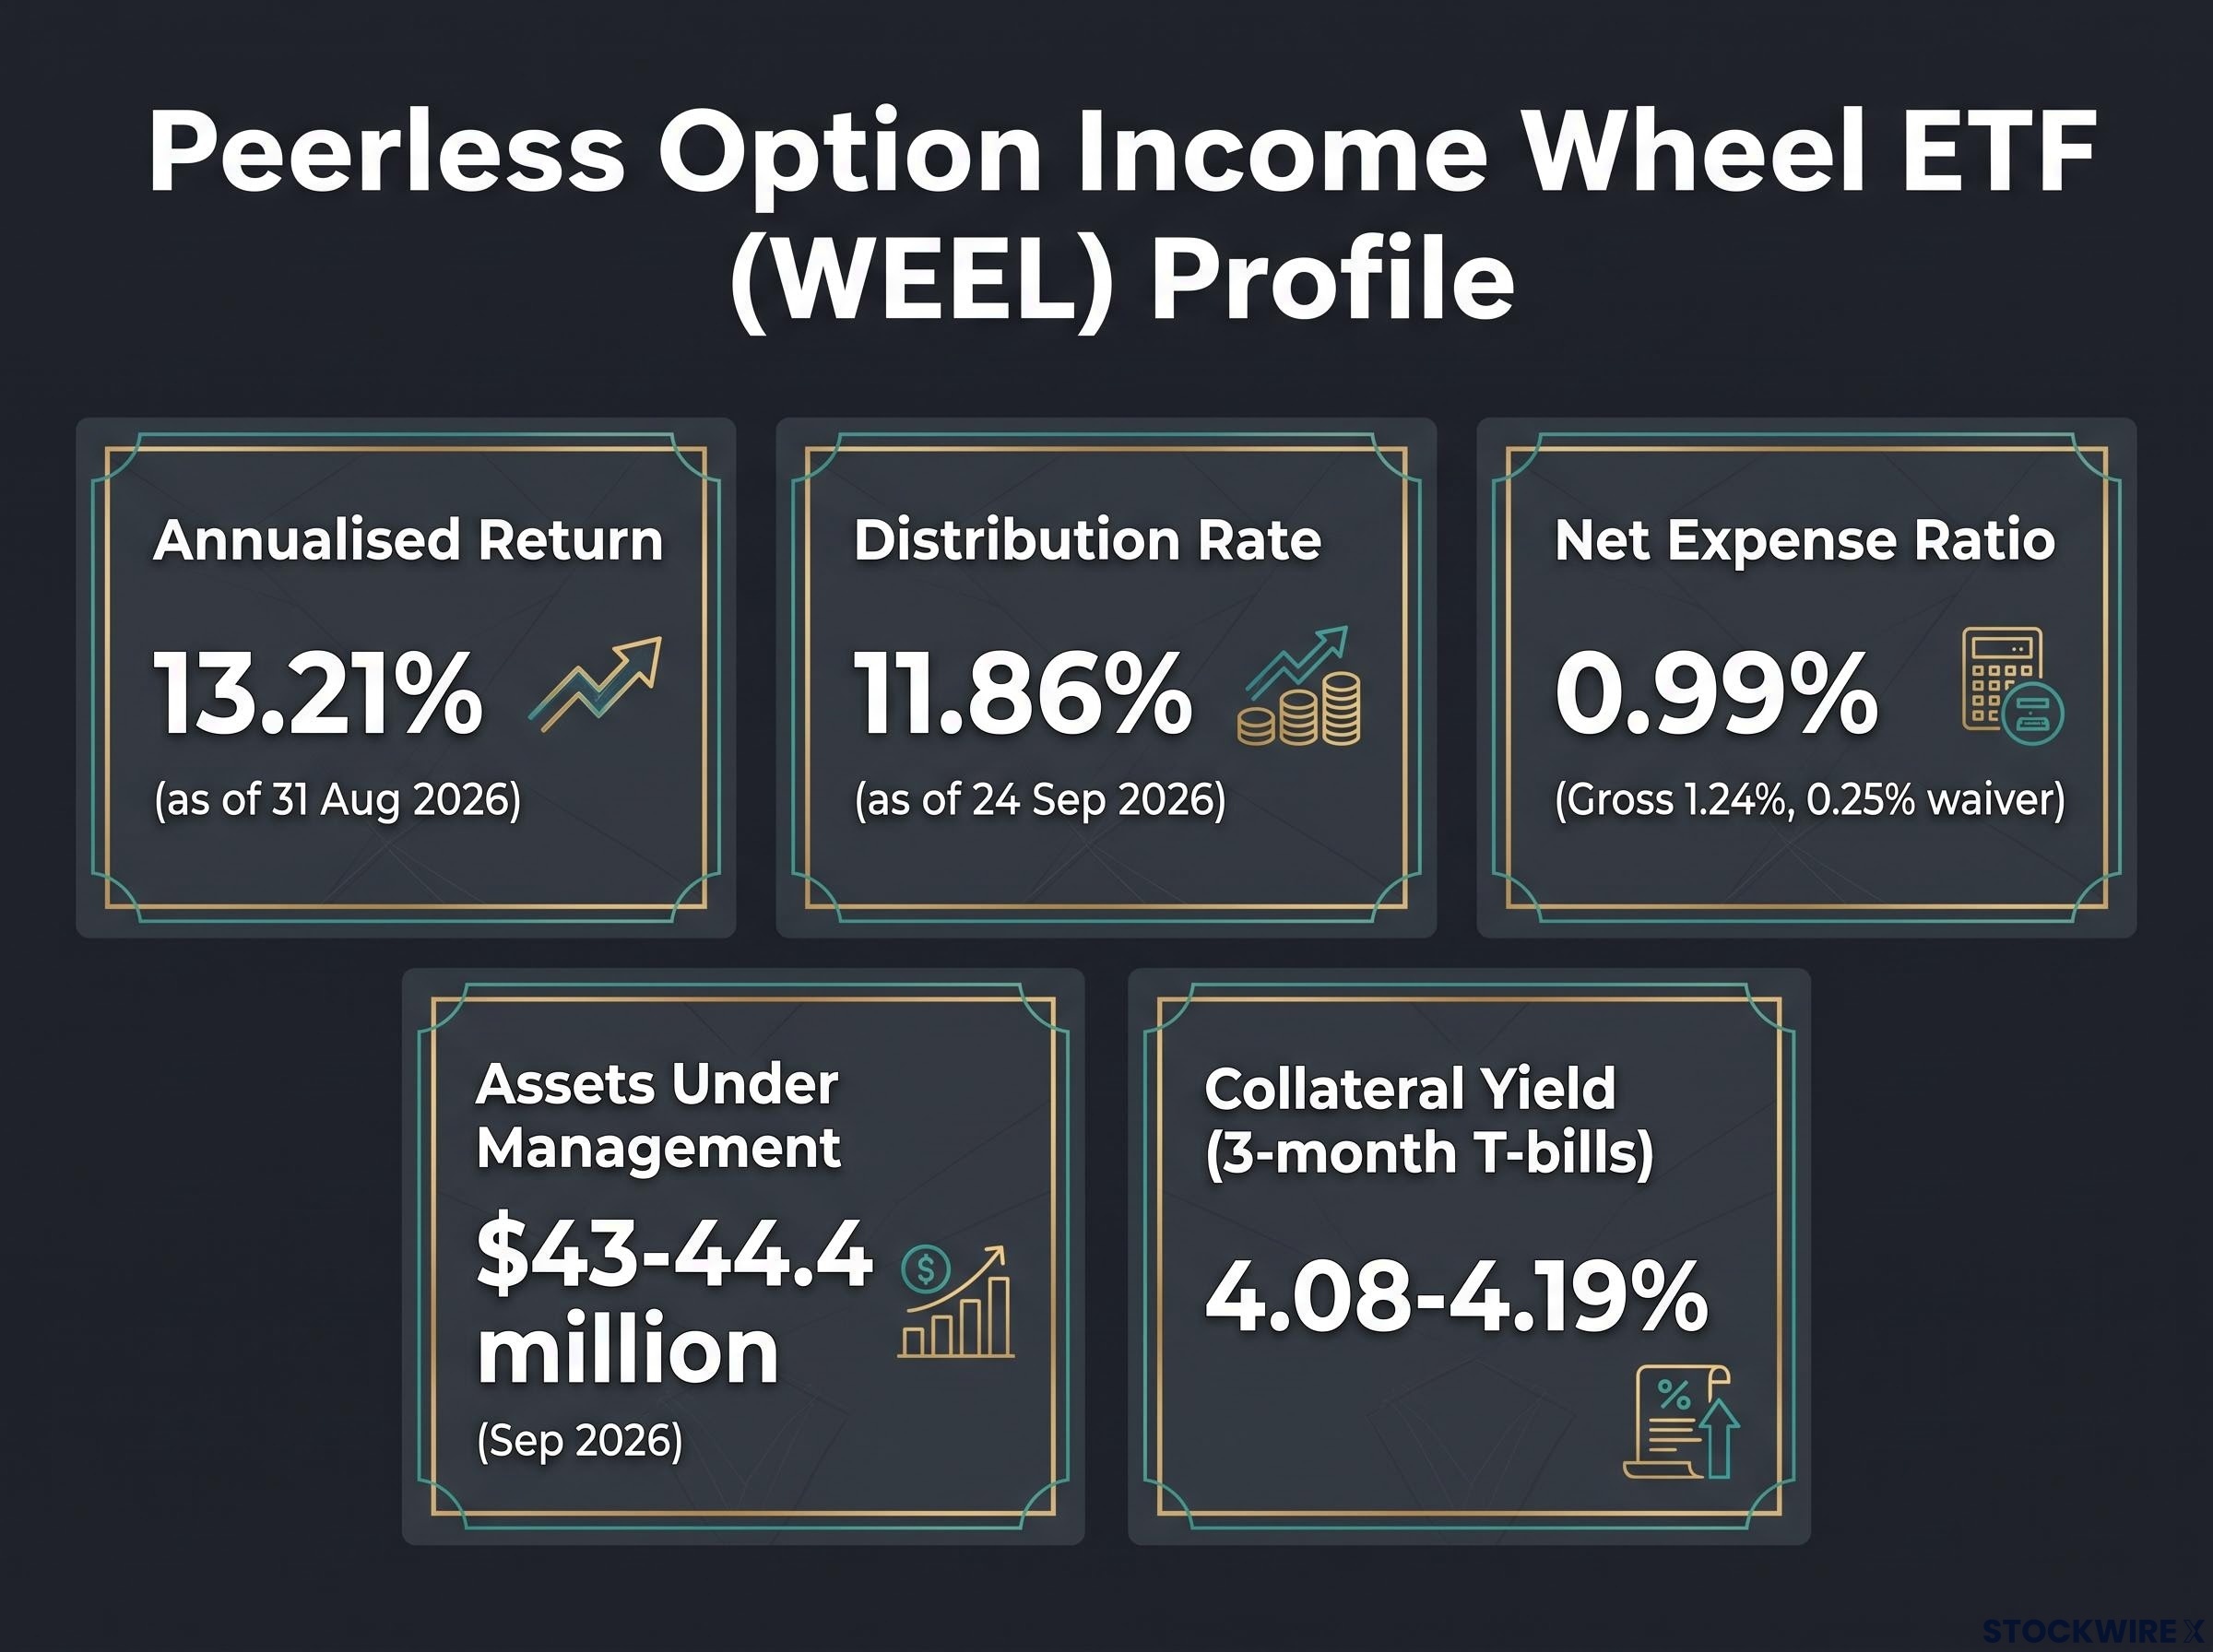
That is the real argument for looking at the wheel now. WEEL’s 13.21% annualised since-inception return captures both the income and the total return, which is the metric that actually matters when judging whether the strategy earns its keep, not the headline distribution yield alone.
Whether it fits you comes down to profile. The wheel, and WEEL as a proxy for it, suits some investors and not others.
- Likely a fit if you are: income-oriented, tolerant of volatility, not chasing a benchmark, and working with a medium-to-long time horizon.
- Likely not a fit if you are: return-maximising, running a short horizon, or prone to exiting during drawdowns.
Two caveats belong on your watchlist. The income’s durability depends on T-bill yields staying elevated and options markets continuing to price volatility as they do now; treat both as variables to monitor, not givens. And WEEL’s $43-44.4 million in assets marks it as an early-stage fund, which carries liquidity and operational considerations for larger allocators.
For investors ready to place WEEL alongside other candidates in a formal evaluation process, our dedicated guide to ETF due diligence walks through a seven-step framework covering mandate, holdings, costs, distributions, risk, liquidity, and provider quality, with return-of-capital classification as a specific checkpoint.
The question to sit with is not “does this strategy work?” It demonstrably does what it is designed to do. The question is whether the trade between smoother income and capped upside matches what you are actually trying to achieve.
This article is for informational purposes only and should not be considered financial advice. Investors should conduct their own research and consult with financial professionals before making investment decisions. Past performance does not guarantee future results. Financial projections are subject to market conditions and various risk factors.