
On 29 September 2025, the Australian Dollar lost more ground to the US Dollar than any other major currency tracked that session, surrendering 0.58% in a single day. The New Zealand Dollar was right behind it at 0.55%.
That pattern is a signal, not an accident. When the dollar strengthens most against the two currencies most tied to global growth and raw material demand, the market is telling you something specific about what it fears.
The move did not arrive in isolation. Two forces were converging that day: a Federal Reserve that had cut rates by 25 basis points in September yet spoke in a register that sounded anything but easy, and a commodity market rattled by a Chicago Fed president drawing a pointed line between near-term crude softness and a deeper, structural refining problem.
These were not parallel stories. They were feeding the same dollar-positive sentiment from different directions.
After reading this, you will understand not just what moved on 29 September, but why commodity-linked currencies absorbed the heaviest damage, what the Fed’s language actually signalled beneath the headline cut, and whether the dollar’s strength rested on durable foundations or a narrative already beginning to fray. Treat it as a lens for reading any similar currency session, not just this one.
The day’s currency heat map: who lost, who held, and who barely moved
Start with the shape of the losses, because the shape tells the story before any macro explanation does.
The Australian Dollar took the hardest hit, down 0.58% against the greenback. The New Zealand Dollar followed at 0.55%. Then a clear gap opened up. The Euro fell 0.35%, the British Pound and the Swiss Franc each lost 0.27%, and the Canadian Dollar barely moved at 0.11%.
Here is the full heat map, ordered from the largest US Dollar gain to the smallest, according to FXStreet’s currency data for the session.
| Currency Pair | USD Move (%) | Currency Character |
|---|---|---|
| USD vs. AUD | +0.58% | High-beta commodity currency |
| USD vs. NZD | +0.55% | High-beta commodity currency |
| USD vs. EUR | +0.35% | Major reserve currency |
| USD vs. GBP | +0.27% | Major reserve currency |
| USD vs. CHF | +0.27% | Safe-haven currency |
| USD vs. CAD | +0.11% | Oil-linked commodity currency |
| USD vs. JPY | -0.03% | Safe-haven currency |
The Australian and New Zealand dollars did not just happen to be at the bottom together. They form a coherent cluster, the two currencies most sensitive to global growth and commodity demand, sitting well clear of the Euro, Pound, and Franc in the scale of their losses.
Then there is the exception that confirms the rule. The Japanese Yen was the only currency to gain against the dollar, with the greenback slipping 0.03% against it. The Yen is a safe-haven currency, the kind that firms in risk-off sessions. Its resilience while the commodity currencies were being sold is the fingerprint of a defensive market, not a generic dollar bid.
The Yen’s resilience while commodity currencies sold off is one of the cleaner expressions of risk-on/risk-off dynamics in the FX market, where capital rotates away from growth-sensitive positions and into safe-haven assets in a pattern that repeats across cycles.
The broader index backed this up. The US Dollar Index (DXY), which measures the dollar against a basket of major currencies, was trading in the 97-99 range.
IC Markets DXY technical note (29 September 2025) The dollar was described as being “in a position of strength,” with technical indicators pointing to upside potential toward the 99.00 level.
For anyone reading forex, this is the distinction that separates noise from signal. A dollar that rises uniformly across every currency is one story. A dollar that punishes commodity currencies while safe havens hold firm is pricing a very different fear about the world.
When big ASX news breaks, our subscribers know first
Why commodity currencies take the biggest hit when the dollar firms
The pattern on 29 September was not a one-off quirk. It is a structural mechanism you will recognise in future sessions, and it runs through three linked channels.
- Commodity currency exposure: The Australian and New Zealand economies are heavily tied to global demand for raw materials, so when a hawkish Fed dents expectations for world growth, these currencies feel it more sharply than defensive ones.
- Carry trade reversal: Both currencies are popular in carry trades, where investors borrow in low-yield currencies to hold higher-yielding ones. In risk-off episodes, investors unwind these positions, amplifying losses in high-beta FX.
- Global growth sensitivity: When US real yields rise and safe-haven flows accelerate, appetite for growth-linked currencies drains away first.
The RBA’s export composition data quantifies exactly why the Aussie sits in the high-beta commodity currency category: resources account for 57.8% of Australia’s total exports, meaning any repricing of global growth demand flows directly into AUD positioning.
State Street Global Advisors framed the yield side of this plainly in its November 2025 commentary, arguing that higher short-end US yields and steady US growth support the dollar precisely against high-beta currencies. That is the backdrop under which the Aussie and Kiwi tend to struggle most.
The commodity currency exposure of the Aussie and Kiwi is not simply about where their economies sit in the global supply chain; BNY iFlow data from later in the cycle showed that all five major commodity currencies rotated to net selling within one week of the Fed’s dovish pivot, confirming that the transmission from Fed posture to high-beta FX losses runs faster and more uniformly than individual country fundamentals would suggest.
For anyone holding or watching these positions, the three-channel mechanism explains why hawkish Fed episodes hurt more than the headline rate decision alone would suggest. It is not just the yield gap. It is the simultaneous unwinding of carry trades and the repricing of global growth, all landing at once.
NZD vs. AUD: similar story, different degree of vulnerability
The Kiwi’s weakness was not sudden. According to Oanda’s technical record, NZD/USD reached a medium-term high of 0.6120 on 1 July 2025, then began a sustained decline. From 24 September 2025 onward, the pair traded continuously below its 200-day moving average, sitting in a descending channel.
That matters for positioning. A currency already trending below a widely watched technical level heads into a risk-off session carrying momentum against it, which primes it for further losses.
Here is the apparent contradiction worth resolving. On the day, the Aussie was actually the weakest performer at 0.58% versus the Kiwi’s 0.55%, yet Oanda’s longer-run assessment frames NZD as structurally more vulnerable than AUD.
The two readings do not clash. Day-to-day, either currency can take the sharper hit depending on the flows of a single session. Over the medium term, the Kiwi’s sustained descent below its 200-day moving average points to greater underlying exposure to the same forces. One is a snapshot. The other is the trend.
The Fed’s September cut sounded hawkish: what Powell’s language actually meant for the dollar
Here is the paradox at the centre of the whole session. The Federal Reserve cut interest rates by 25 basis points in September 2025, lowering the target range to 4.00-4.25%, and yet the dollar was firming into and through the end of the month. A central bank easing policy should, on paper, weaken its currency. This one did the opposite.
The resolution lies in the language, not the decision. Powell’s remarks did more work than the rate cut itself.
The hawkish camp read it this way. FXStreet, in its Q4 2025 outlook published 26 September 2025, captured the tension most precisely.
The September move was “a dovish adjustment packaged with hawkish caution.” Powell stressed inflation risks and described policy as still “modestly restrictive,” committing to a data-dependent path forward.
IC Markets reinforced this on 29 September, citing robust US data, hawkish Fed rhetoric, and persistent inflation as the pillars holding the dollar up. State Street’s November 2025 note, titled “Hawkish Fed supports USD,” argued that the Fed’s posture and steady growth supported higher short-end yields, keeping the dollar competitive.
The dovish camp saw a different trajectory. PNC’s September currency review flagged Powell’s Jackson Hole signal that the Fed was ready to cut, with a base case of further easing to come, and warned explicitly that a downside surprise in US growth could leave the dollar weaker than forecast. MUFG echoed the easing-cycle read. AINvest went furthest, describing the September cut as a “risk management” decision that prioritised labour market stability, and framing the DXY’s confinement to the 97-99 range as evidence of structural dollar weakness.
| Camp | Key Sources | Core Argument |
|---|---|---|
| Hawkish (dollar supportive) | FXStreet, IC Markets, State Street (Nov 2025) | Sticky inflation and hawkish rhetoric hold short-end yields and the dollar up, even as cuts begin |
| Dovish (dollar headwind) | PNC, MUFG, AINvest, State Street (Dec 2025) | The easing cycle is real; softer data and further cuts erode dollar support over time |
Both camps were partially right, and the timing is the whole point. The hawkish rhetoric held the dollar up in late September. But by December 2025, State Street had shifted its tactical USD view to negative, in a note titled “Fed shift hits USD,” as softer labour data and rising rate-cut expectations eroded the hawkish narrative’s grip.
That shift from November’s positive view to December’s negative one is the key data point. It tells you the dollar’s late-September strength was conditional on the hawkish story holding, and that story had a shorter shelf life than the 29 September session made it look.
Goolsbee’s refining warning: how an energy bottleneck becomes a dollar story
On the same day, Chicago Federal Reserve President Austan Goolsbee added a supply-side wrinkle that connects energy directly to the currency. His core observation drew a distinction that is easy to overlook.
Near-term crude oil prices, Goolsbee suggested, could decline relatively rapidly. The more persistent and structural challenge was restoring refining capacity to full operation, with elevated energy costs from Middle East geopolitical tensions noted as a factor weighing on broader market sentiment.
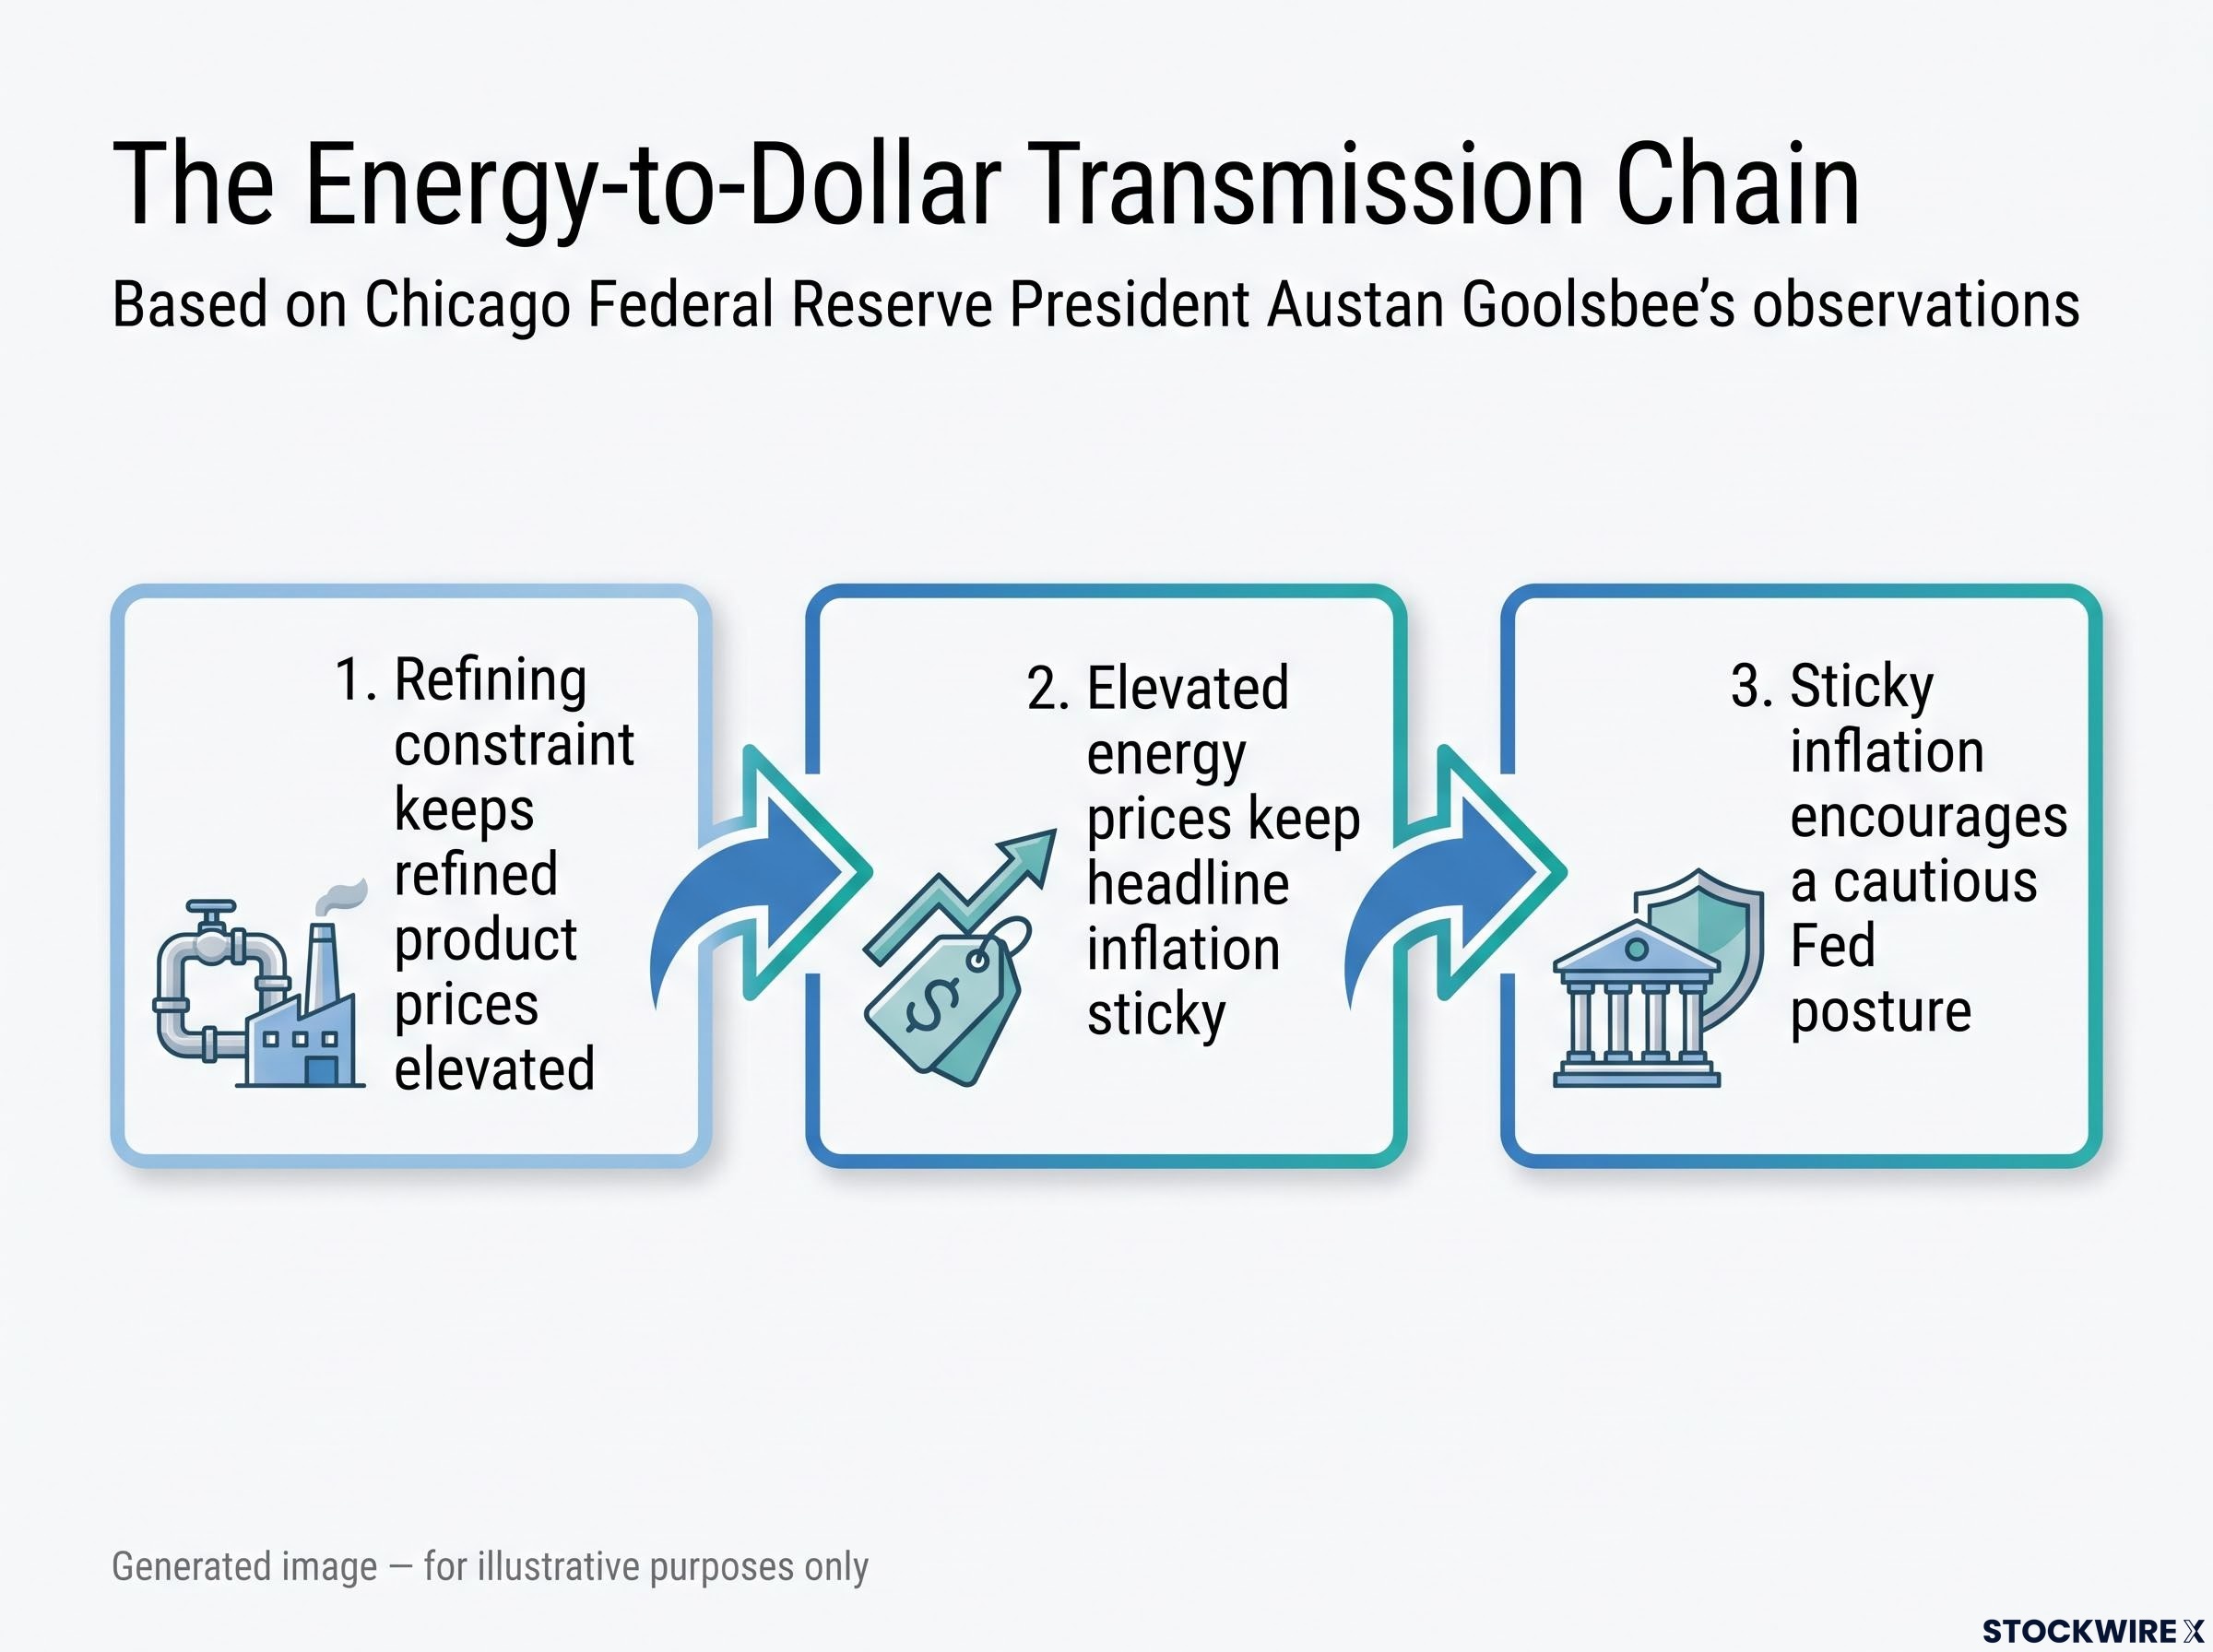
That distinction is not a technical footnote. It carries directly into the dollar through a transmission chain worth walking step by step.
- Refining constraint keeps refined product prices elevated. Even when crude softens, bottlenecks in turning that crude into petrol, diesel, and jet fuel can keep the prices consumers actually pay stubbornly high.
- Elevated energy prices keep headline inflation sticky. Energy is a direct component of consumer price indices and an indirect input into most goods and services, so persistent refined-product costs slow the fall in inflation.
- Sticky inflation encourages a cautious Fed posture. That caution supports higher short-end yields, which in turn supports the dollar.
Refined product price stickiness is harder to observe in headline CPI than the underlying refining constraint warrants: war-driven energy costs routed through airfares and freight charges can appear as goods price increases rather than energy inflation, meaning the true inflationary signal from a refining bottleneck is systematically understated in the numbers the Fed monitors.
FXStreet’s Q4 2025 outlook made the anchor explicit, citing “sticky inflation risks” as a support for the dollar even as rate cuts begin. Supply-side energy shocks are precisely the kind of pressure that fits that category.
For anyone tracking the dollar, Goolsbee’s distinction between crude and refining tells you something the oil headlines alone will not. Even if crude prices fall, the inflationary pressure on the Fed’s decision-making may linger longer than the commodity move suggests, which has direct consequences for how long the dollar’s hawkish support can hold.
What happens to the dollar if the energy pressure fades
The mechanism runs in reverse too, and Goolsbee himself gestured at it.
If crude prices decline relatively rapidly, as he suggested they might, the energy inflation driver weakens. That saps one of the pillars holding up the hawkish Fed narrative, and some of the dollar’s support erodes through the inflation-expectation channel.
His comment about near-term crude declines was, in effect, an acknowledgment of this counter-scenario. He flagged the refining restoration timeline as the stickier constraint, which is where the durability of the dollar’s energy-linked support really sits.
What the 29 September session signals about the dollar’s durability through late 2025
Pull the four threads together and a coherent picture emerges. The commodity currency heat map showed a defensive, risk-off market. The three-channel mechanism explained why the Aussie and Kiwi bore the brunt. The hawkish-cut paradox showed rhetoric doing the heavy lifting. And Goolsbee’s refining warning added an energy channel feeding the same inflation-driven support.
The dollar’s strength that day was real and grounded in identifiable forces. But each force carried an expiry condition that was already visible in the data available at the time.
Three variables determined whether the late-September strength would prove durable.
- Inflation persistence: If sticky inflation held, the hawkish narrative and the dollar held with it. If it faded, so did the support.
- Labour market trajectory: Softer employment data would push rate-cut expectations up and the dollar down. This is exactly what happened by December.
- Energy and refining restoration pace: Faster relief on refined product prices would weaken the inflation channel and one pillar of dollar strength.
The longer arc confirmed the conditional read. IC Markets had described the dollar in late September as being in a position of strength, with upside toward 99.00, while AINvest pointed to the DXY’s confinement in the 97-99 range as evidence of structural limits on the rally.
State Street Global Advisors, December 2025 “Fed shift hits USD.” Softer labour data and mounting expectations of a December rate cut drove a shift in the tactical USD view from neutral to negative.
That December pivot is the empirical closing bracket on the late-September story. The takeaway is a specific analytical habit: when you evaluate a dollar-strength episode, identify not just the supporting forces but the conditions under which each one expires. The 29 September session was not wrong on the day. It was time-limited, and the expiry conditions were already sitting in the competing analyst arguments and Goolsbee’s own hedging.
For readers wanting to extend the durability question beyond a single session, our deep-dive into dollar durability risks examines the structural headwinds accumulating beneath the dollar’s reserve dominance, including the first recorded instance of more central banks planning to reduce than increase dollar allocations.
This article is for informational purposes only and should not be considered financial advice. Investors should conduct their own research and consult with financial professionals before making investment decisions. Past performance does not guarantee future results. Financial projections are subject to market conditions and various risk factors.