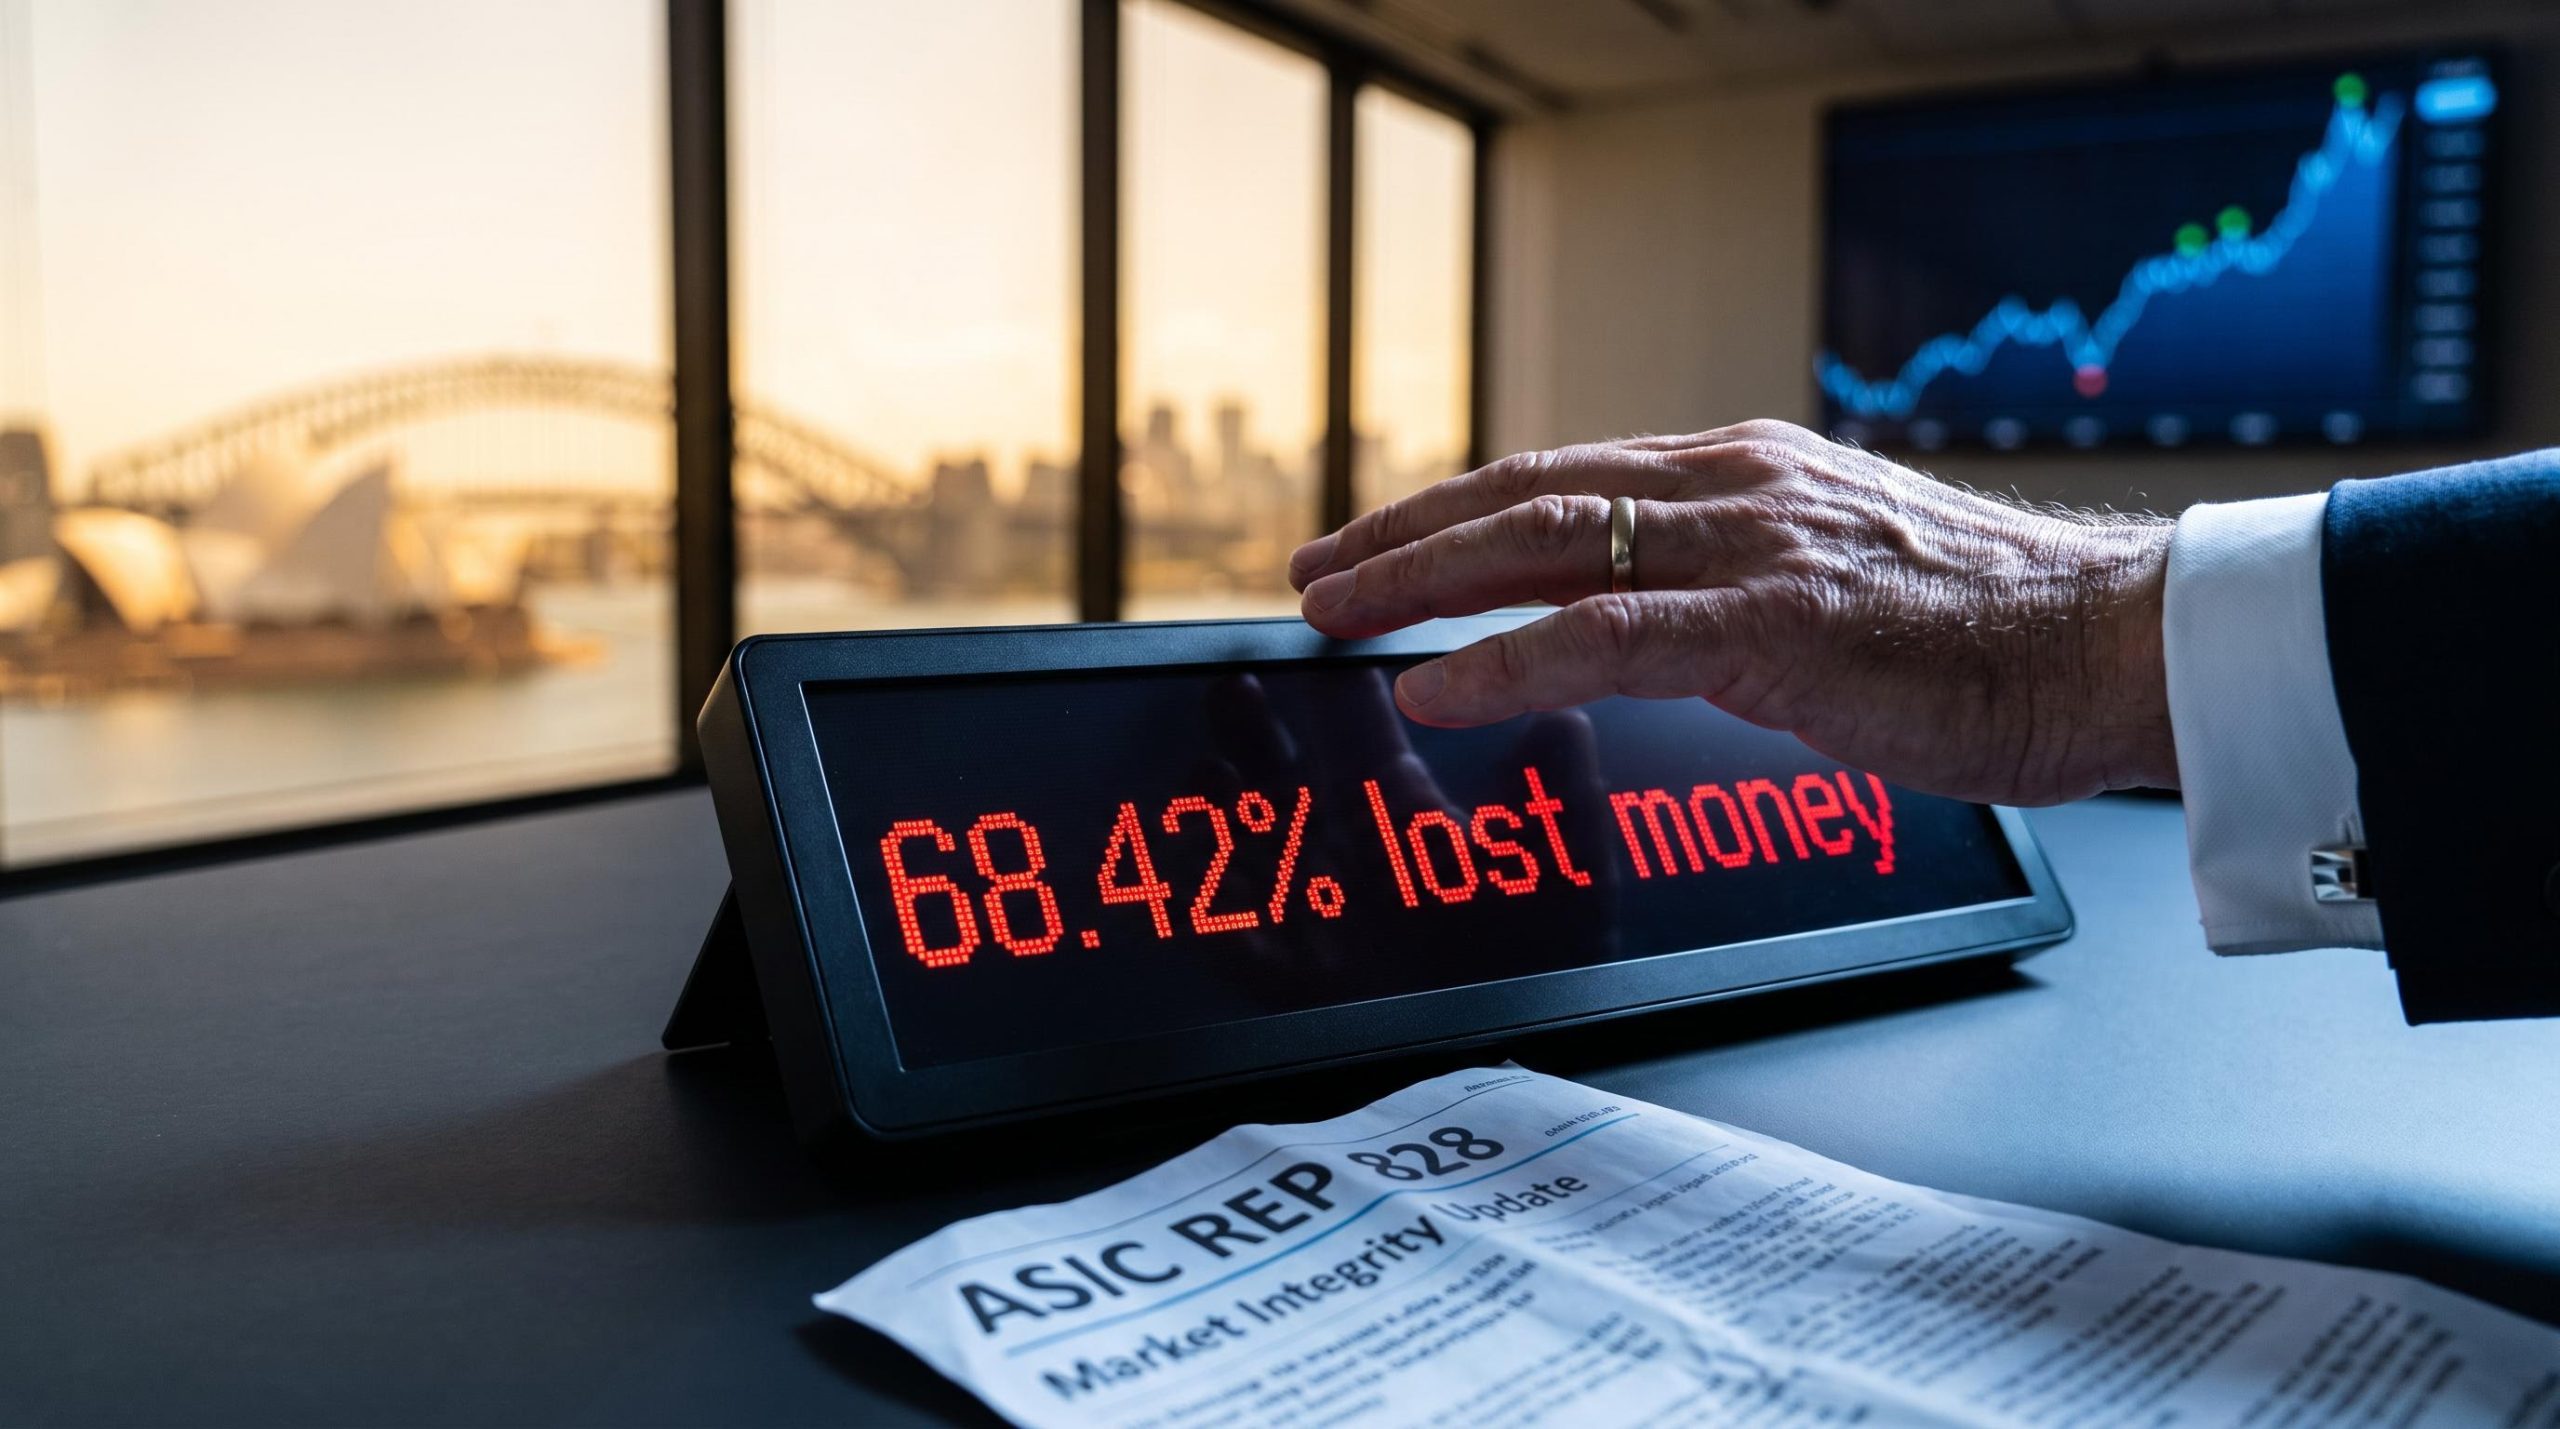
In the 2023-24 financial year, 68.42% of Australian retail contracts for difference (CFD) clients lost money. That is not a statistic buried in a risk disclosure. It is the documented majority outcome, drawn from 133,674 retail clients who collectively lost $458 million trading a product still marketed to everyday investors as a way to profit from market moves.
The number matters because it is not an aberration. According to the Australian Securities and Investments Commission (ASIC), the same loss pattern shows up across a decade of reviews. And CFDs are not the only vehicle producing it. Actively managed Australian equity funds are generating their own parallel record of underperformance, quietly, at scale, and with the same directional message.
This is a data-backed case you can use to stress-test your own approach. Three separate datasets, from three separate institutions, all point to the same conclusion about active trading, losing strategies, and where Australian money actually compounds. Here is what the evidence shows, and what it means for how you build wealth.
The CFD loss figure that active traders rarely see
Start with the headline number from ASIC’s Report REP 828, published on 20 January 2026. Across the 2023-24 financial year, 68.42% of retail CFD clients recorded net losses. The dollar figure attached to that is $458 million, and buried inside it is $73 million paid to CFD issuers in fees.
More than two-thirds of retail CFD clients, 133,674 people, lost money in a single financial year. Total net losses reached $458 million.
The specifics, all from ASIC REP 828 and the accompanying media release 26-004MR:
ASIC REP 828 documents not only the headline loss rate but also the specific compliance failures ASIC identified across CFD issuers, including inadequate target market determinations and product governance weaknesses that regulators have since required issuers to address.
- 68.42% of retail CFD clients recorded net losses in FY 2023-24
- 133,674 retail clients lost money over the period
- Net losses of $458 million, including $73 million in fees paid to issuers
- ASIC secured nearly $40 million in refunds for more than 38,000 retail investors
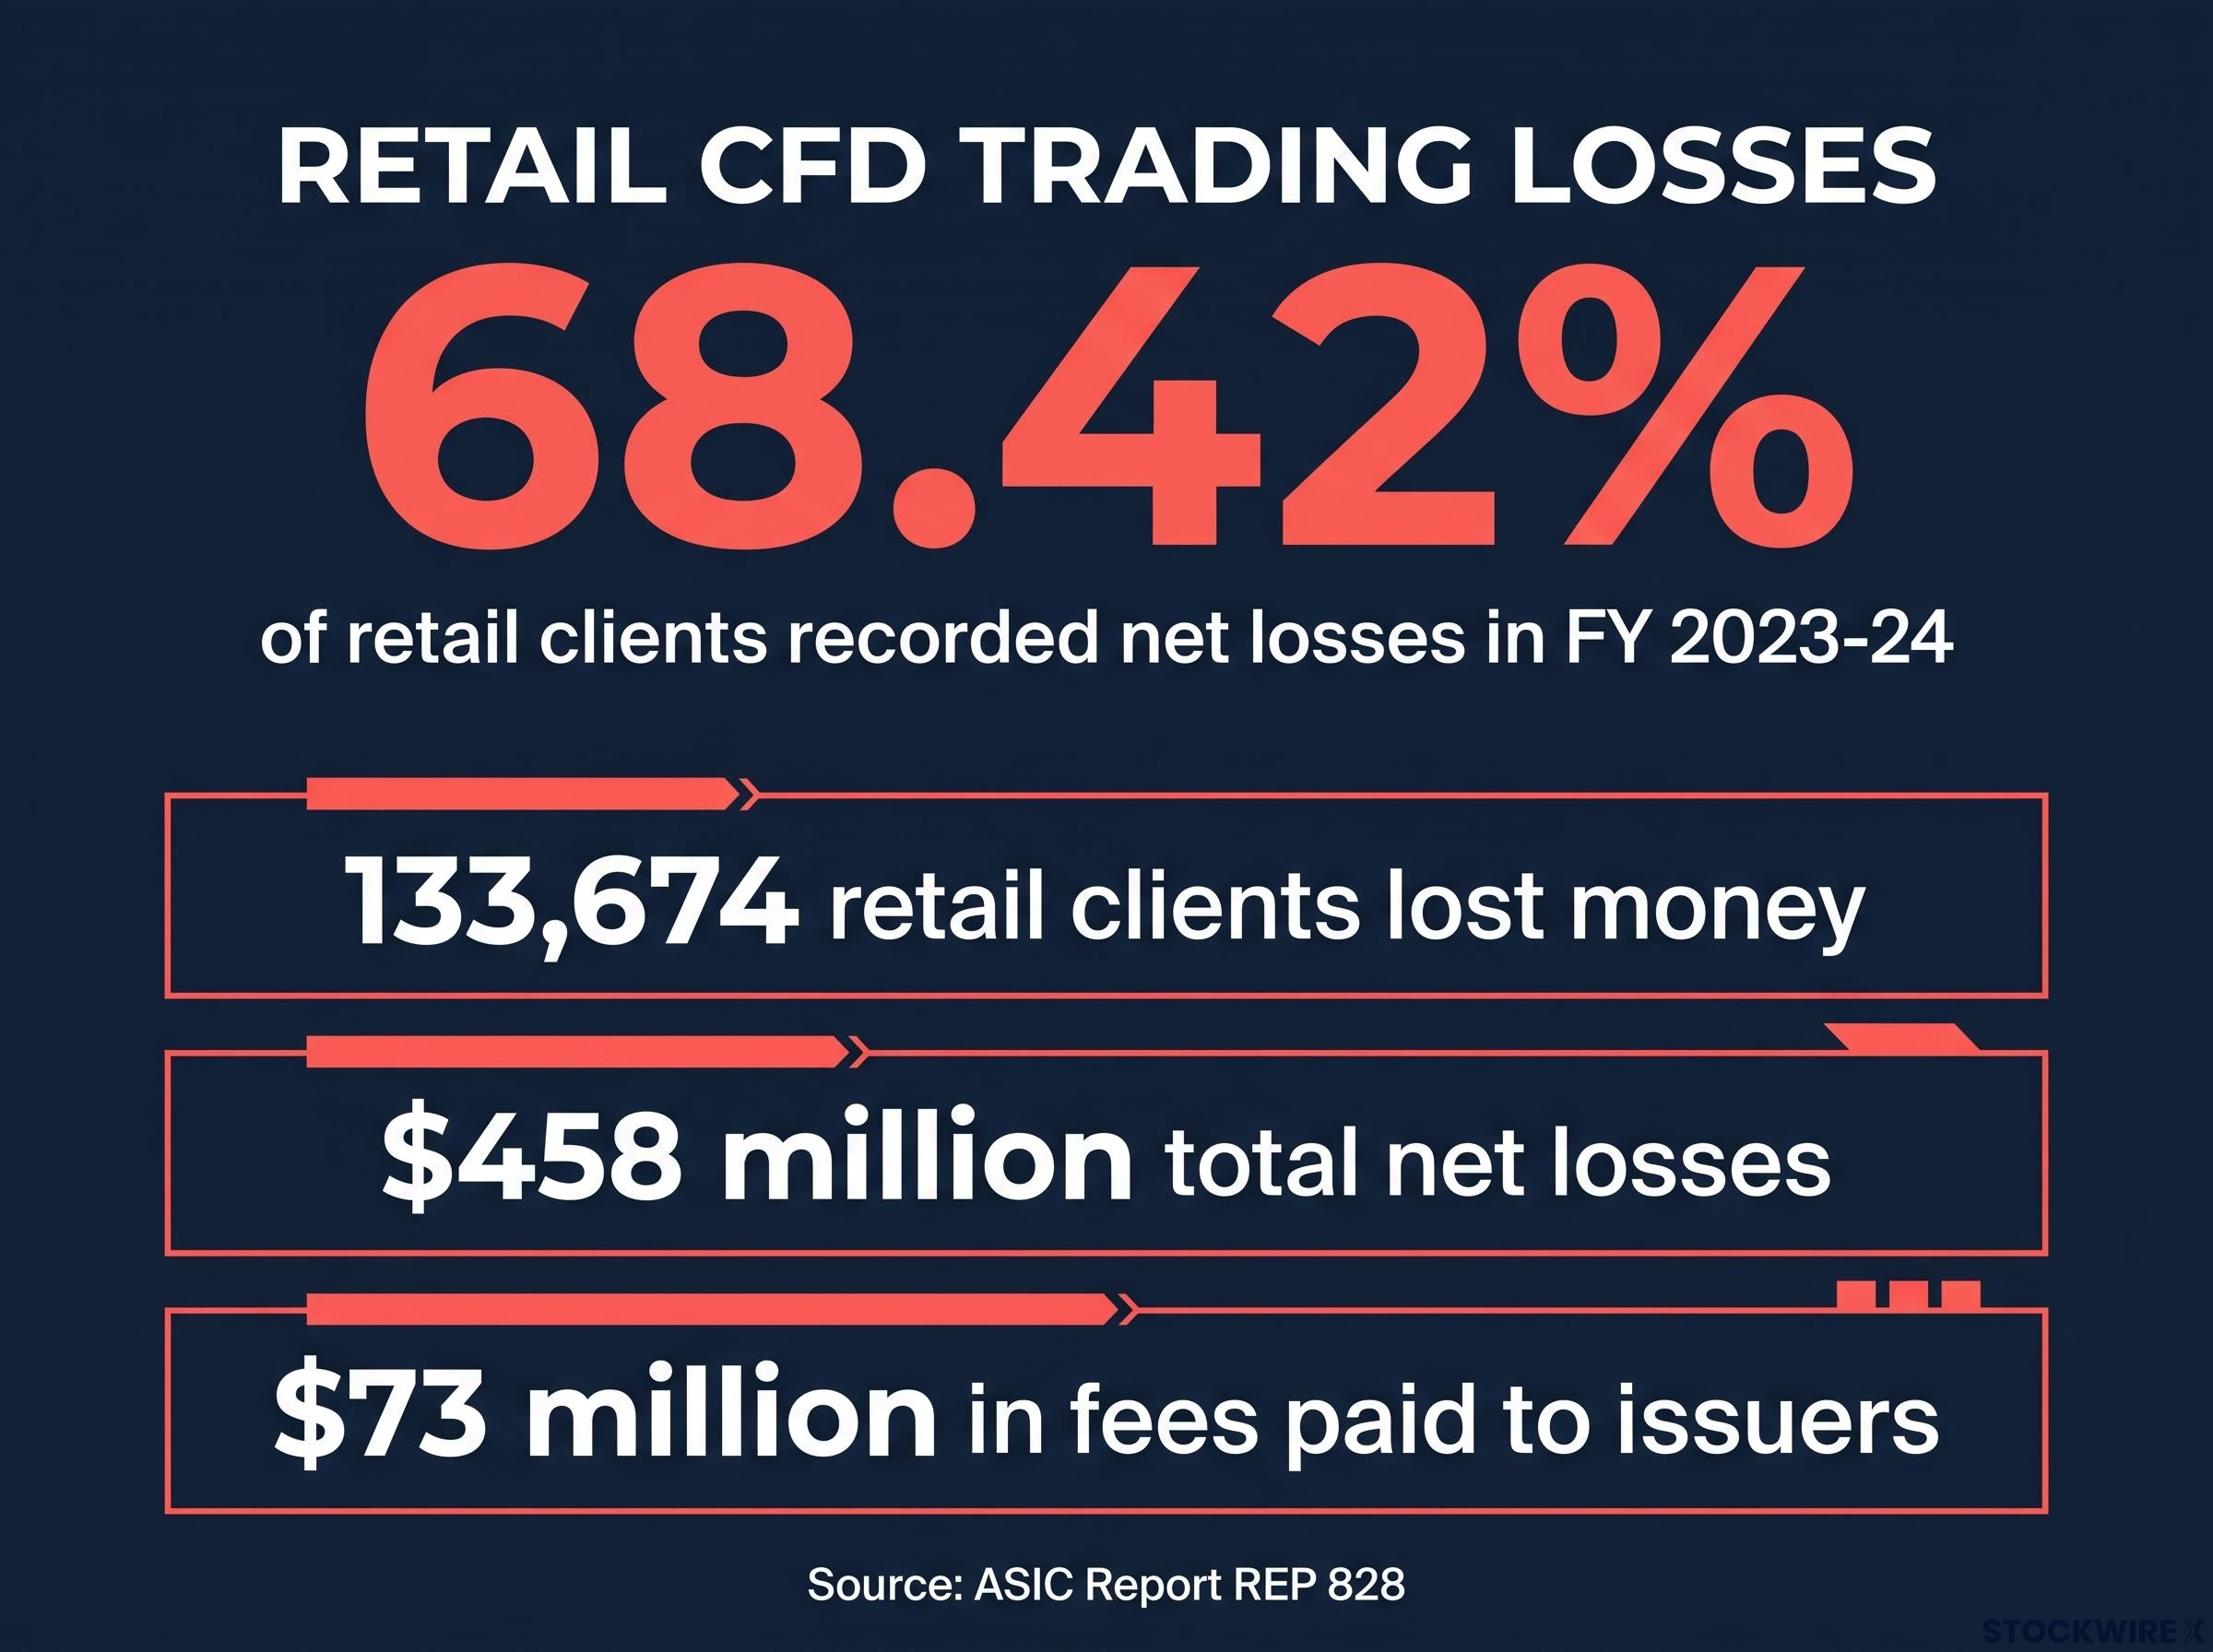
Look at the fee line again. Issuers earned $73 million from a client base where two out of three people ended up down. That is the structural point most CFD marketing leaves out: the provider’s revenue does not depend on you winning. It depends on you trading.
This is not a bad year that will average out. ASIC’s earlier reviews, drawing on 2020 data, found that between 56.9% and 63.2% of retail CFD trading accounts lost money in any given week. The loss rate is remarkably stable across time.
The regulatory architecture underpinning these numbers has a structural expiry point: the CFD product intervention order, which introduced leverage caps, negative balance protection, and margin close-out rules, is set to expire on 23 May 2027, leaving the loss-rate trajectory beyond that date an open question.
The most extreme illustration came in early 2020. Over a five-week window in March and April, a sample of CFD issuers’ retail clients suffered net losses exceeding $774 million, with more than 15,000 accounts falling into negative balance, meaning they owed money beyond what they had put in.
Here is the interpretation worth sitting with. When two-thirds of a product’s clients lose money and the provider profits from fees regardless of the outcome, the product is not malfunctioning. It is performing exactly as designed. That distinction should shape how you treat CFD access, because it is not the same thing as investing.
When big ASX news breaks, our subscribers know first
Active fund managers are losing the same argument, at scale
CFDs are a speculative product, so heavy losses might feel unsurprising. Professionally managed equity funds are a different proposition entirely. They come with research teams, mandates, and fees justified by the promise of expertise. So the question becomes: does that expertise beat the market?
Start with the short-term picture from the SPIVA Australia Mid-Year 2026 Scorecard, released by S&P Dow Jones Indices with data to 30 June 2026. In the first half of 2026, the S&P/ASX 200 returned 2.4%. The average actively managed Australian Equity General fund returned just 0.2% on an equal-weighted basis.
The result: 78% of Australian Equity General funds failed to beat the benchmark over that half-year. Roughly four in five paid professionals could not match a simple index.
A single half-year can be dismissed as noise. So extend the horizon. Over the 15 years to 30 June 2026, 89% of Australian Equity General funds underperformed the S&P/ASX 200. The failure rate did not shrink with time. It widened.
| Time horizon | Active fund underperformance rate | Benchmark |
|---|---|---|
| H1 2026 | 78% | S&P/ASX 200 |
| 15 years to June 2026 | 89% | S&P/ASX 200 |
The 89% figure is the one that should anchor your thinking. Pick an active Australian equity fund at random and hold it across the horizon that actually determines your retirement, and you have roughly a one-in-ten chance of landing in the minority that outperforms. That is the real odds table behind active management fees.
Some active managers dispute the SPIVA methodology, arguing that broad-index comparisons unfairly judge funds with specialised mandates or different investment philosophies. The point has some merit at the margins. But SPIVA’s long-term data shows that even among funds that survive the full period, the proportion beating the benchmark stays small, which limits how much comfort that objection can offer.
Survivorship bias compounds the active management problem: funds that close or merge are removed from the universe before performance comparisons are run, meaning the 89% underperformance figure from SPIVA already reflects a filtered pool in which the worst performers have been quietly deleted.
Why the pattern does not correct itself
Fee drag is the mechanical culprit. Active funds carry higher management fees and higher trading costs, and those charges compound against your net return every single year, even when a manager’s raw stock picks are competitive before costs.
Benchmark-hugging makes it worse. Many active funds stay close to the index to reduce the risk of badly trailing it, then charge active fees on top. That combination makes it structurally difficult to ever overcome the fee drag, because the portfolio barely differs from the cheaper alternative.
Then there is the behavioural gap. Investors tend to buy funds after a strong run and sell after a weak one, so the returns real people actually realise are often worse than the returns the fund reports. The pattern feeds itself.
What disciplined index exposure actually delivers over 30 years
Enough about what loses. Here is what staying invested in a low-cost, diversified index has historically produced, in dollars you can picture as your own.
According to the Vanguard 2026 Index Chart, a $10,000 investment in Australian shares made on 1 July 1996 grew to $132,931 by 30 June 2026. That is an average total return of approximately 9.0% per annum over three decades, achieved with no stock selection, no market timing, and no attempt to be clever.
Now the comparison that reframes the whole exercise. The same $10,000 left in cash over the identical period grew to just $32,459, at roughly 4.0% per annum.
| Asset class | Initial investment | Final value (30 years to June 2026) | Average annual return |
|---|---|---|---|
| Australian shares | $10,000 | $132,931 | ~9.0% p.a. |
| Cash | $10,000 | $32,459 | ~4.0% p.a. |
The gap is $100,472. Vanguard framed its 17 August 2026 media statement around exactly this figure.
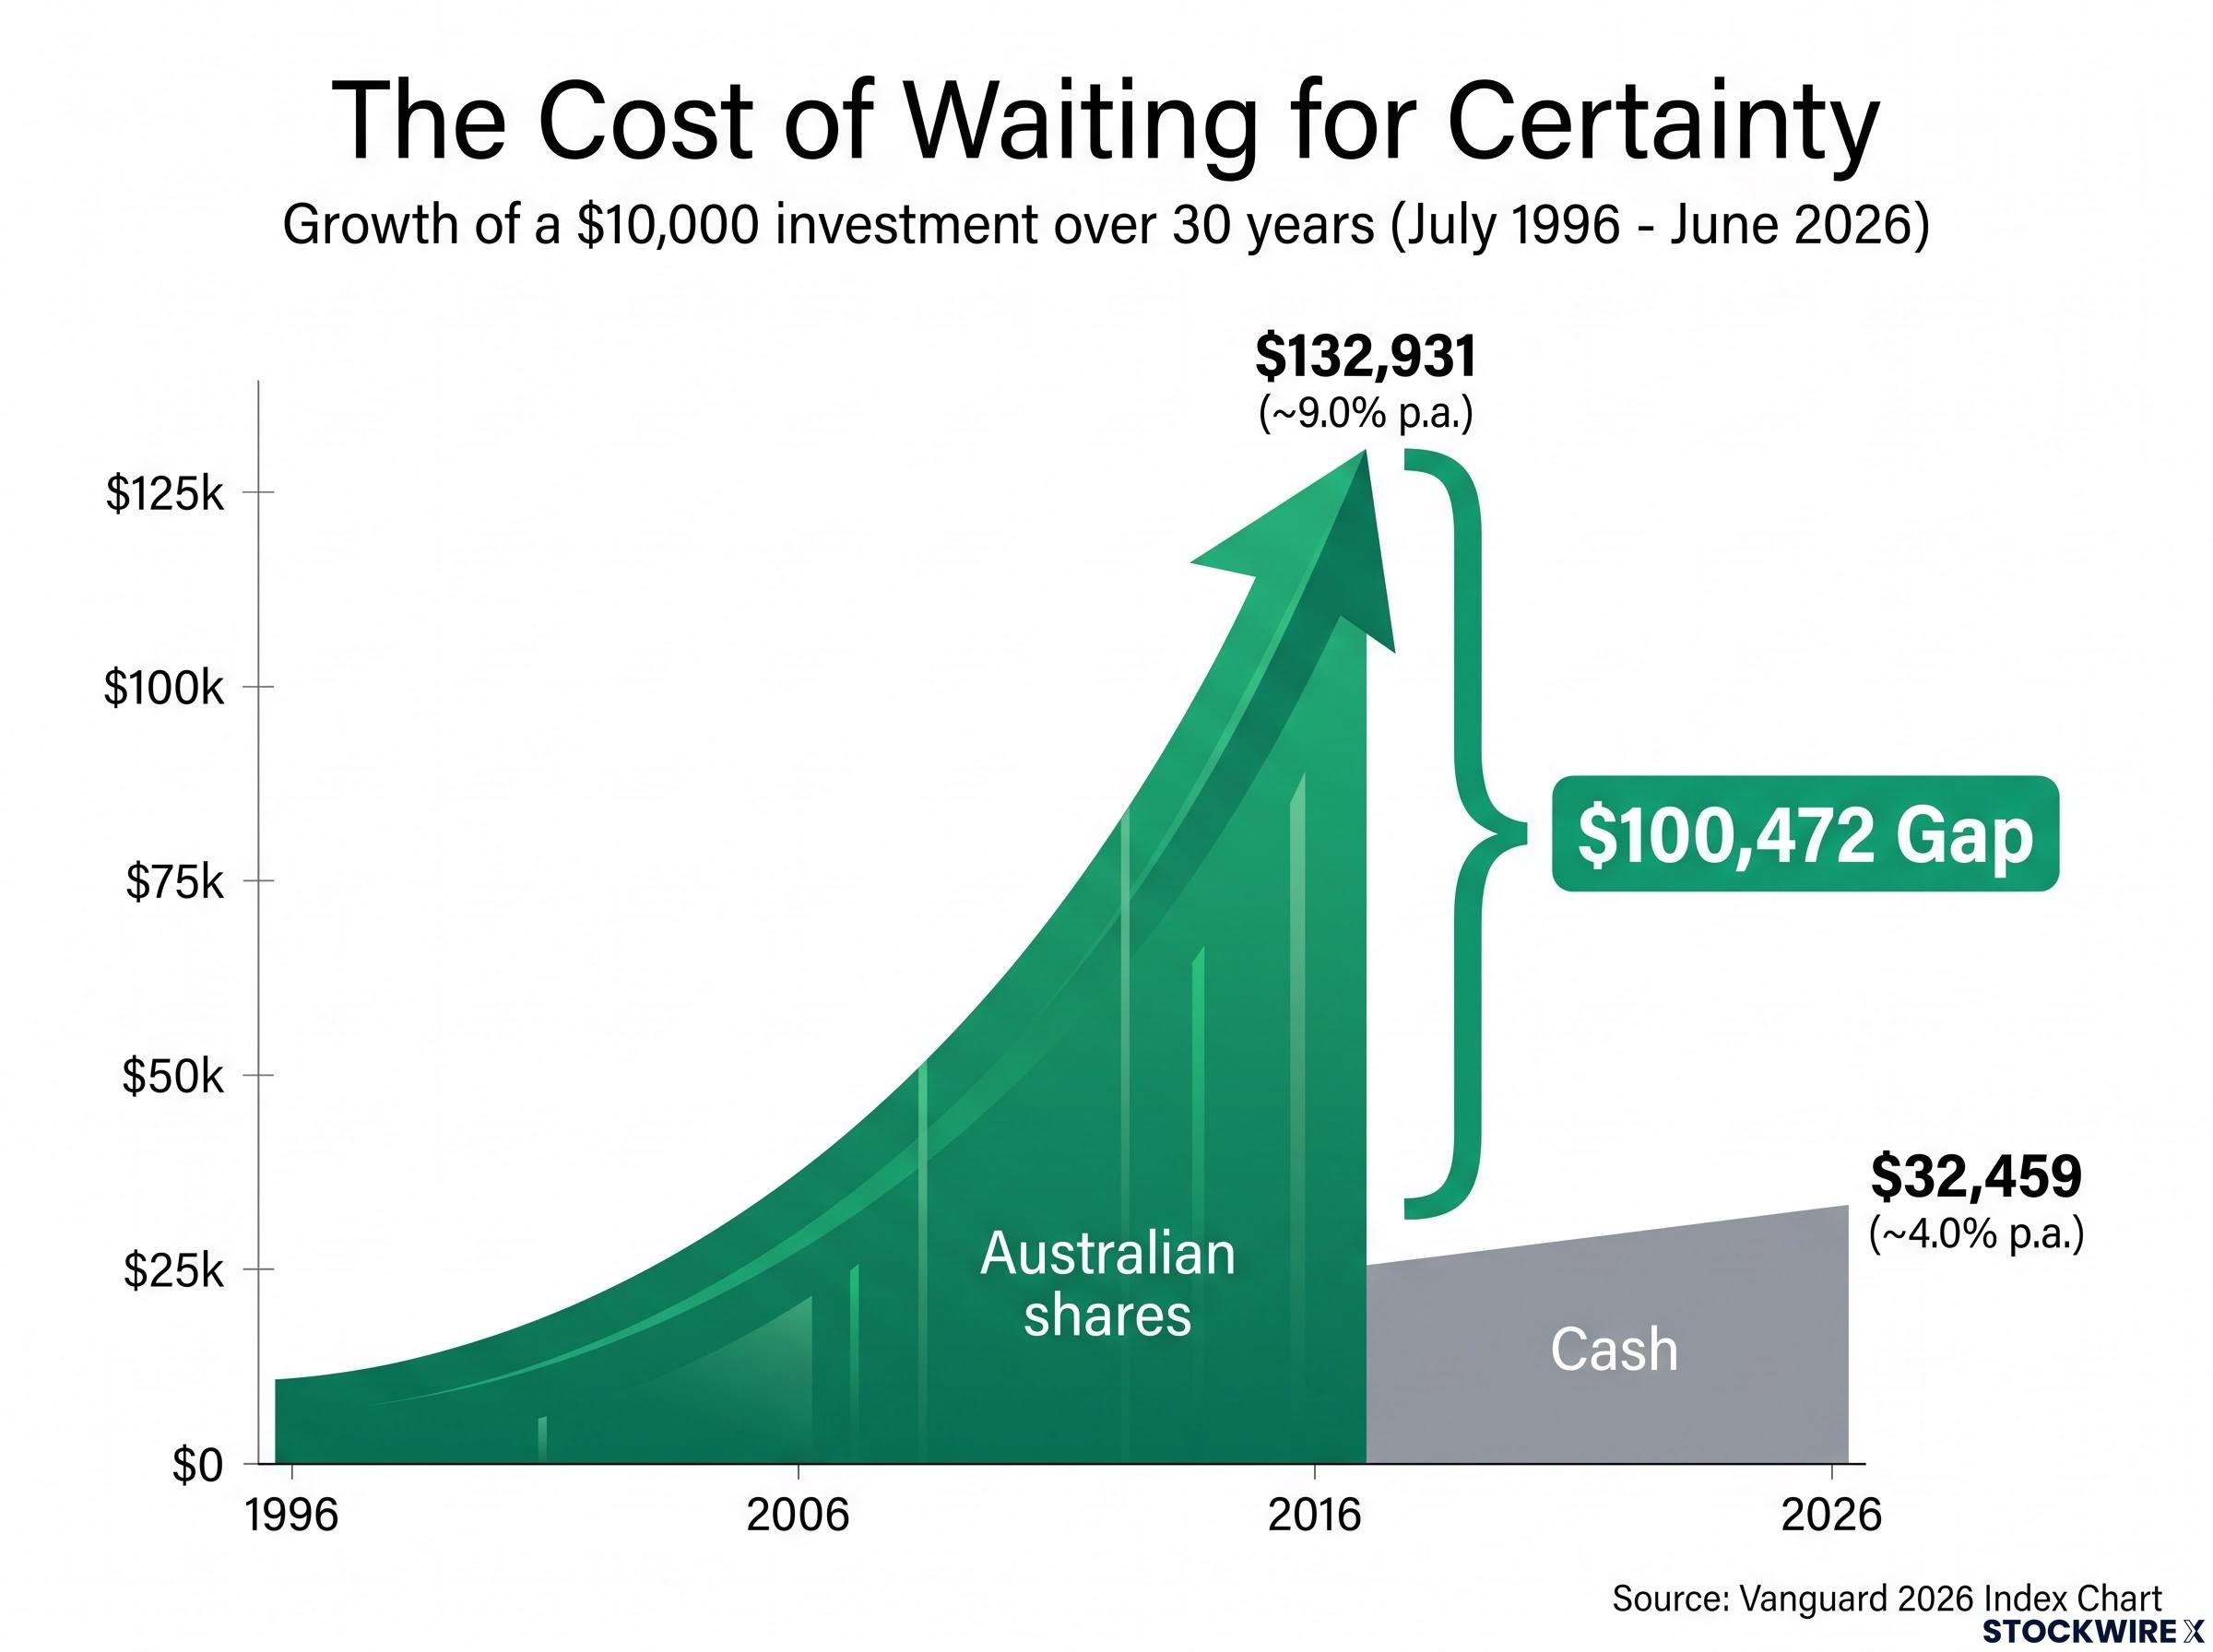
“Waiting for certainty could have cost investors $100,000,” Vanguard stated in its 2026 Index Chart release.
Read that gap carefully. It is not primarily a story about superior returns from clever picks. It is a story about the cost of not being invested, especially the cost of moving to cash when markets turn frightening.
Because this 9.0% annual return did not arrive on a smooth line. It survived the dot-com crash, the global financial crisis, and the COVID-19 pandemic. An investor who bailed to cash during any of those dislocations, waiting for certainty before returning, would have forfeited a meaningful slice of that $132,931. The volatility was the price of admission, and it was worth paying.
The behavioural engine keeping retail investors in losing strategies
Here is the uncomfortable part. The loss statistics from ASIC and SPIVA are not mainly a story about ignorance. They are the output of psychological forces that act on well-informed people just as reliably as on beginners. The data is the symptom. Behaviour is the engine.
Three mechanisms show up repeatedly across the research:
Research on the sell decision finds that randomly selected exits outperformed professional portfolio managers by up to 150 basis points annually in a University of Chicago study, locating the primary site of portfolio value destruction not in stock selection but in the moment of exit.
- Overconfidence. Traders treat outcomes as evidence of skill rather than probability, which pushes them toward concentrated, leveraged bets instead of diversified positions. It is the mindset CFDs are built to attract.
- Loss-chasing. ASIC’s CFD reviews document rapid trading and repeated margin calls, patterns consistent with investors trying to win back what they have already lost by taking on more risk.
- FOMO-driven timing. Herd behaviour and fear of missing out drive investors to chase hot stocks and speculative sectors, frequently buying near valuation peaks after social or media pressure builds.
Connect these back to the earlier numbers. The 68.42% CFD loss rate and the tendency to abandon investments during downturns are not separate problems. They are the same psychology expressed through different products.
Understanding this gives you a diagnostic tool rather than a warning. These forces exist regardless of how much you know. The real question is whether you have structures in place that reduce their influence on your own decisions.
Structural habits that reduce behavioural error
Automate your regular contributions. When investing happens on a schedule rather than on a decision, you remove the emotional moment where fear or excitement would otherwise take over.
Limit how often you check. Vanguard recommends reviewing your superannuation just once a year, around tax time, precisely because frequent monitoring breeds reactive changes that cost more than they save.
Anchor yourself to a written plan. Choosing a low-cost diversified index fund and documenting your rationale gives you a reference point to return to when a headline or a friend’s tip tempts you to abandon it.
This article is for informational purposes only and should not be considered financial advice. Investors should conduct their own research and consult with financial professionals before making investment decisions. Past performance does not guarantee future results.
What the data says about where most retail investors should be
Three institutions, three datasets, one direction. CFD trading left 68.42% of retail clients in the red. Active fund management left 89% of funds trailing the benchmark over 15 years. Low-cost index exposure turned $10,000 into $132,931 across three decades that included three major crashes.
| Strategy | Key evidence | Source |
|---|---|---|
| CFD trading | 68.42% of retail clients lost money in FY 2023-24 | ASIC REP 828 |
| Active fund management | 89% underperformed over 15 years to June 2026 | SPIVA Australia Mid-Year 2026 |
| Low-cost index investing | $10,000 grew to $132,931 over 30 years | Vanguard 2026 Index Chart |
The data does not claim outperformance is impossible. It claims outperformance is unlikely and, crucially, structurally hard to identify before the fact. Those are different statements, and the honest version is the second one.
ASIC has been documenting these outcomes since 2017, and across nearly a decade of reviews the pattern has not materially shifted. So the decision the evidence puts to you is a single question: what would you need to believe about your own edge to justify the costs and risks of active trading over a low-cost index alternative? Answer that honestly, and the data has done its job.
For investors ready to act on the index case, our dedicated guide to ASX ETFs walks through how a single broad fund like VAS gives you 321 companies at a 0.07% annual fee, with a ten-year annualised return of 8.92% and no stock-picking required.