Here is an uncomfortable number for anyone trading zero-DTE iron condors: on roughly 48% of trades that hit a 0.5x stop-loss, closing the position was unnecessary. Those trades would have recovered to at least breakeven by the time the market closed. Cutting your loss was, statistically, a coin flip on whether you needed to.
That is not a warning label about options risk. It is a specific finding from tastytrade’s backtested SPX data, and it sits at the centre of a genuinely contested question: should you use a stop-loss on a zero-DTE iron condor at all, and if so, how tight?
The stop-loss decision here is not settled best practice. The tastytrade numbers show that risk reduction and win rate preservation pull in opposite directions, with no clean resolution. This matters at scale now that zero-DTE trades have gone mainstream. In August 2026, they hit a record 62.4% of all SPX options volume, per Cboe.
After reading this, you will know exactly what you are giving up and what you are gaining at each stop-loss threshold. The point is not to hand you a rule. It is to make your own decision clearer, so you can match a stop level to your actual risk profile and account structure rather than defaulting to what sounds prudent.
What the baseline delta-20 iron condor actually delivers before any management
Before any of the stop-loss trade-offs make sense, you need a fixed reference point. The tastytrade research team built its analysis around a single benchmark structure, and every subsequent number moves relative to it.
The benchmark is a delta-20 iron condor with $20-wide wings, traded on zero-DTE SPX. Delta-20 was chosen as a consistent baseline for comparison across studies. The core parameters:
- Delta-20 short strikes (a roughly 20% probability of finishing in the money)
- $20-wide wings on each side
- Approximately $500 average credit collected per contract
- Approximately $1,500 maximum potential loss per contract
That last pairing is the one to hold onto. The structure risks about $1,500 to collect about $500, a 3:1 max-loss-to-credit ratio. The backtest runs from 20 May 2022 onward.
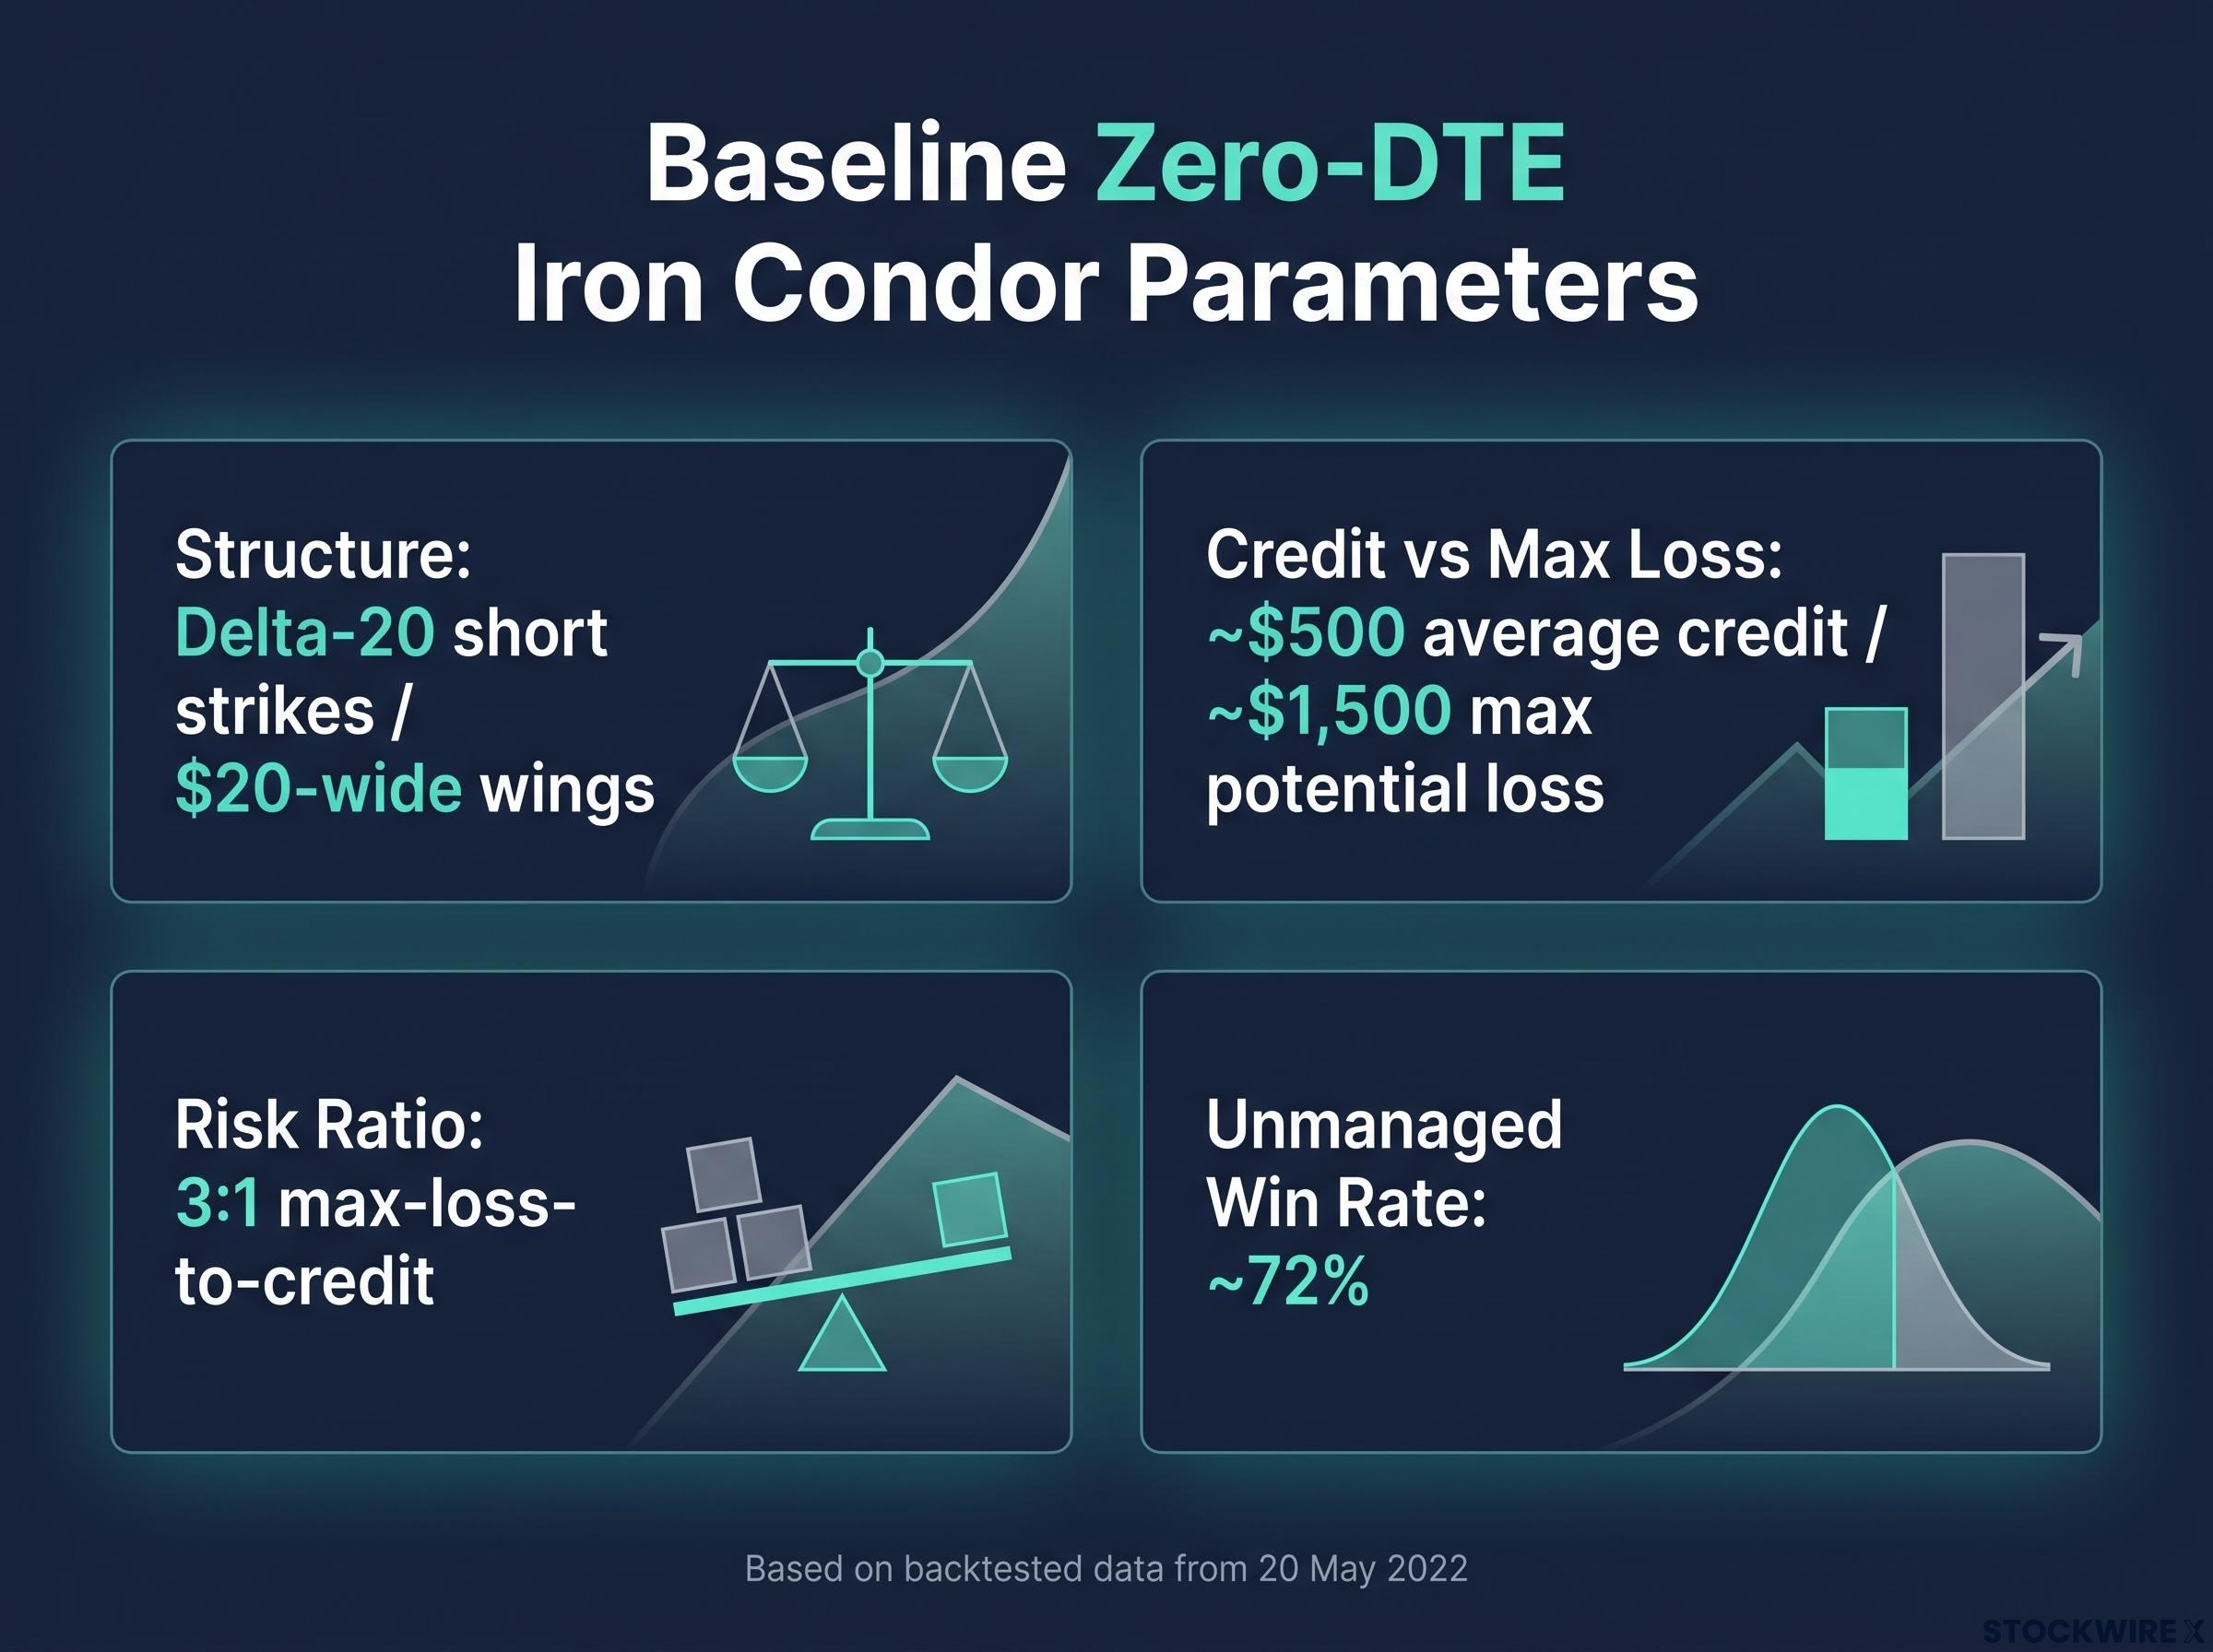
Without any stop-loss management, this structure won approximately 72% of the time. That 72% is not a selling point on its own. It is the starting condition, the number that every stop-loss rule then modifies downward in exchange for lower risk.
The iron condor’s structural advantage rests on the same mechanism as any credit spread: positive theta means each passing day without a large adverse move shifts probability in the seller’s favour, but that daily edge accumulates fastest in the final session, which is precisely why gamma acceleration makes zero-DTE iron condors both more rewarding and more fragile than their multi-day counterparts.
The intraday stress the baseline creates
Win rate is only half the picture. The other half is what the position puts you through intraday, before it ever reaches a win or a max loss.
Across all trades, an unmanaged position swings approximately $683 per contract on average during the session. For losing trades specifically, the average intraday move is roughly $500 in either direction.
Here is what that tells you. Even a defined-risk structure, where your worst case is capped at $1,500, can generate serious intraday stress long before the max-loss scenario arrives. A position can show a large unrealised loss, rattle your discipline, and still recover by the close. That gap between intraday pain and final outcome is precisely the problem stop-loss calibration is trying to solve.
For reference, here are the three stop-loss thresholds tested against the $500 average credit:
| Stop-Loss Multiplier | Approximate Dollar Trigger | Relationship to Credit |
|---|---|---|
| 0.5x | ~$250 | Half the credit received |
| 1x | ~$500 | Equal to the credit received |
| 2x | ~$1,000 | Twice the credit received |
When big ASX news breaks, our subscribers know first
The case for stops: CVaR cuts, volatility reduction, and what the numbers show
The argument for stops is strong, and it deserves to be seen at full strength before the drawbacks arrive. The headline metric is Conditional Value at Risk, or CVaR, which measures the average size of your worst losses in the tail of the distribution.
According to the tastytrade research, applying a stop-loss cut CVaR by anywhere from approximately 13% to over 50% compared with holding to expiration unmanaged. The tightest setting drove the biggest reduction: a 0.5x stop cut CVaR by more than half. Looser stops at 1x and 2x delivered proportionally smaller reductions.
Put plainly, the tighter your stop, the less damage your worst trades do to your account. For a trader whose main fear is a catastrophic tail event, that is a direct answer.
The intraday volatility reduction is where it gets personal
The tail-risk case is compelling, but the intraday numbers are where the benefit becomes something you actually feel at the screen.
An unmanaged position swings roughly $683 per contract across all trades. Applying a 0.5x or 1x stop cut that average intraday swing by about a third, down to roughly $420 to $425 per contract. The effect on losing trades is far more dramatic.
The number that matters for your discipline For losing trades only, average intraday loss volatility fell from approximately $500 in either direction with no stop to roughly $153 with a 0.5x stop. That is less than a third of the unmanaged level.
That reduction is not only a risk metric. It is a behavioural one. Traders who underestimate the psychological cost of watching a position bleed hundreds of dollars intraday are the ones most likely to break their own rules under pressure, closing at the worst moment or doubling down. A $153 swing is one you can sit through. A $500 swing is one that makes people do things they regret.
The behavioural cost of intraday volatility is something options trading drawdowns research documents in detail: emotional loss aversion, broker margin calls triggered by rising volatility, and systemic de-leveraging can converge simultaneously, forcing exits at exactly the moment the position is closest to recovering.
| Stop-Loss Level | CVaR Reduction vs. No Stop | Avg Intraday Swing (All Trades) | Avg Intraday Swing (Losing Trades) |
|---|---|---|---|
| No stop | Baseline | ~$683 | ~$500 |
| 2x | ~13% | Higher than tighter stops | Higher than tighter stops |
| 1x | Intermediate | ~$420-$425 | Lower than unmanaged |
| 0.5x | >50% | ~$420-$425 | ~$153 |
Why does this matter so much in zero-DTE specifically? Because gamma acceleration is extreme in the final session. As expiration approaches, time-value decay speeds up sharply and unrealised losses can compound within a single day. Cboe research notes that zero-DTE flows can both amplify selloffs and fuel rapid intraday reversals. That is the environment these stops are built to navigate. Strike-Watch goes further with a hard rule: cap daily losses at 3% of your account and stop trading zero-DTE for the day once you hit it.
The recovery-rate dilemma: why roughly half of stopped trades did not need to be closed
Here is where the clean case for stops runs into a genuine complication. Deep intraday drawdowns are not the exception in this strategy. They are the norm.
A prior tastytrade report found that approximately 60% of zero-DTE trades experienced an intraday loss reaching at least 50% of the initial credit at some point before recovering. Read that again. Most winning trades dipped hard before they finished green. The strategy is built on riding out drawdowns that look alarming in the moment.
That context sets up the central finding. Of the positions that would have triggered a 0.5x stop, approximately 48% would have recovered to at least breakeven by expiration had they simply been held.
The finding that makes this a real decision Exiting at the 0.5x threshold is roughly a coin flip on whether the exit was necessary. Close to half of stopped-out positions were still capable of returning to profitability.
The cost of that coin flip shows up directly in the win rate. As stops tighten, the number of trades cut short before they can recover climbs, and the win rate falls with it:
- No stop: approximately 72% win rate
- 2x stop: below 70%
- 1x stop: below 60%
- 0.5x stop: below 50%
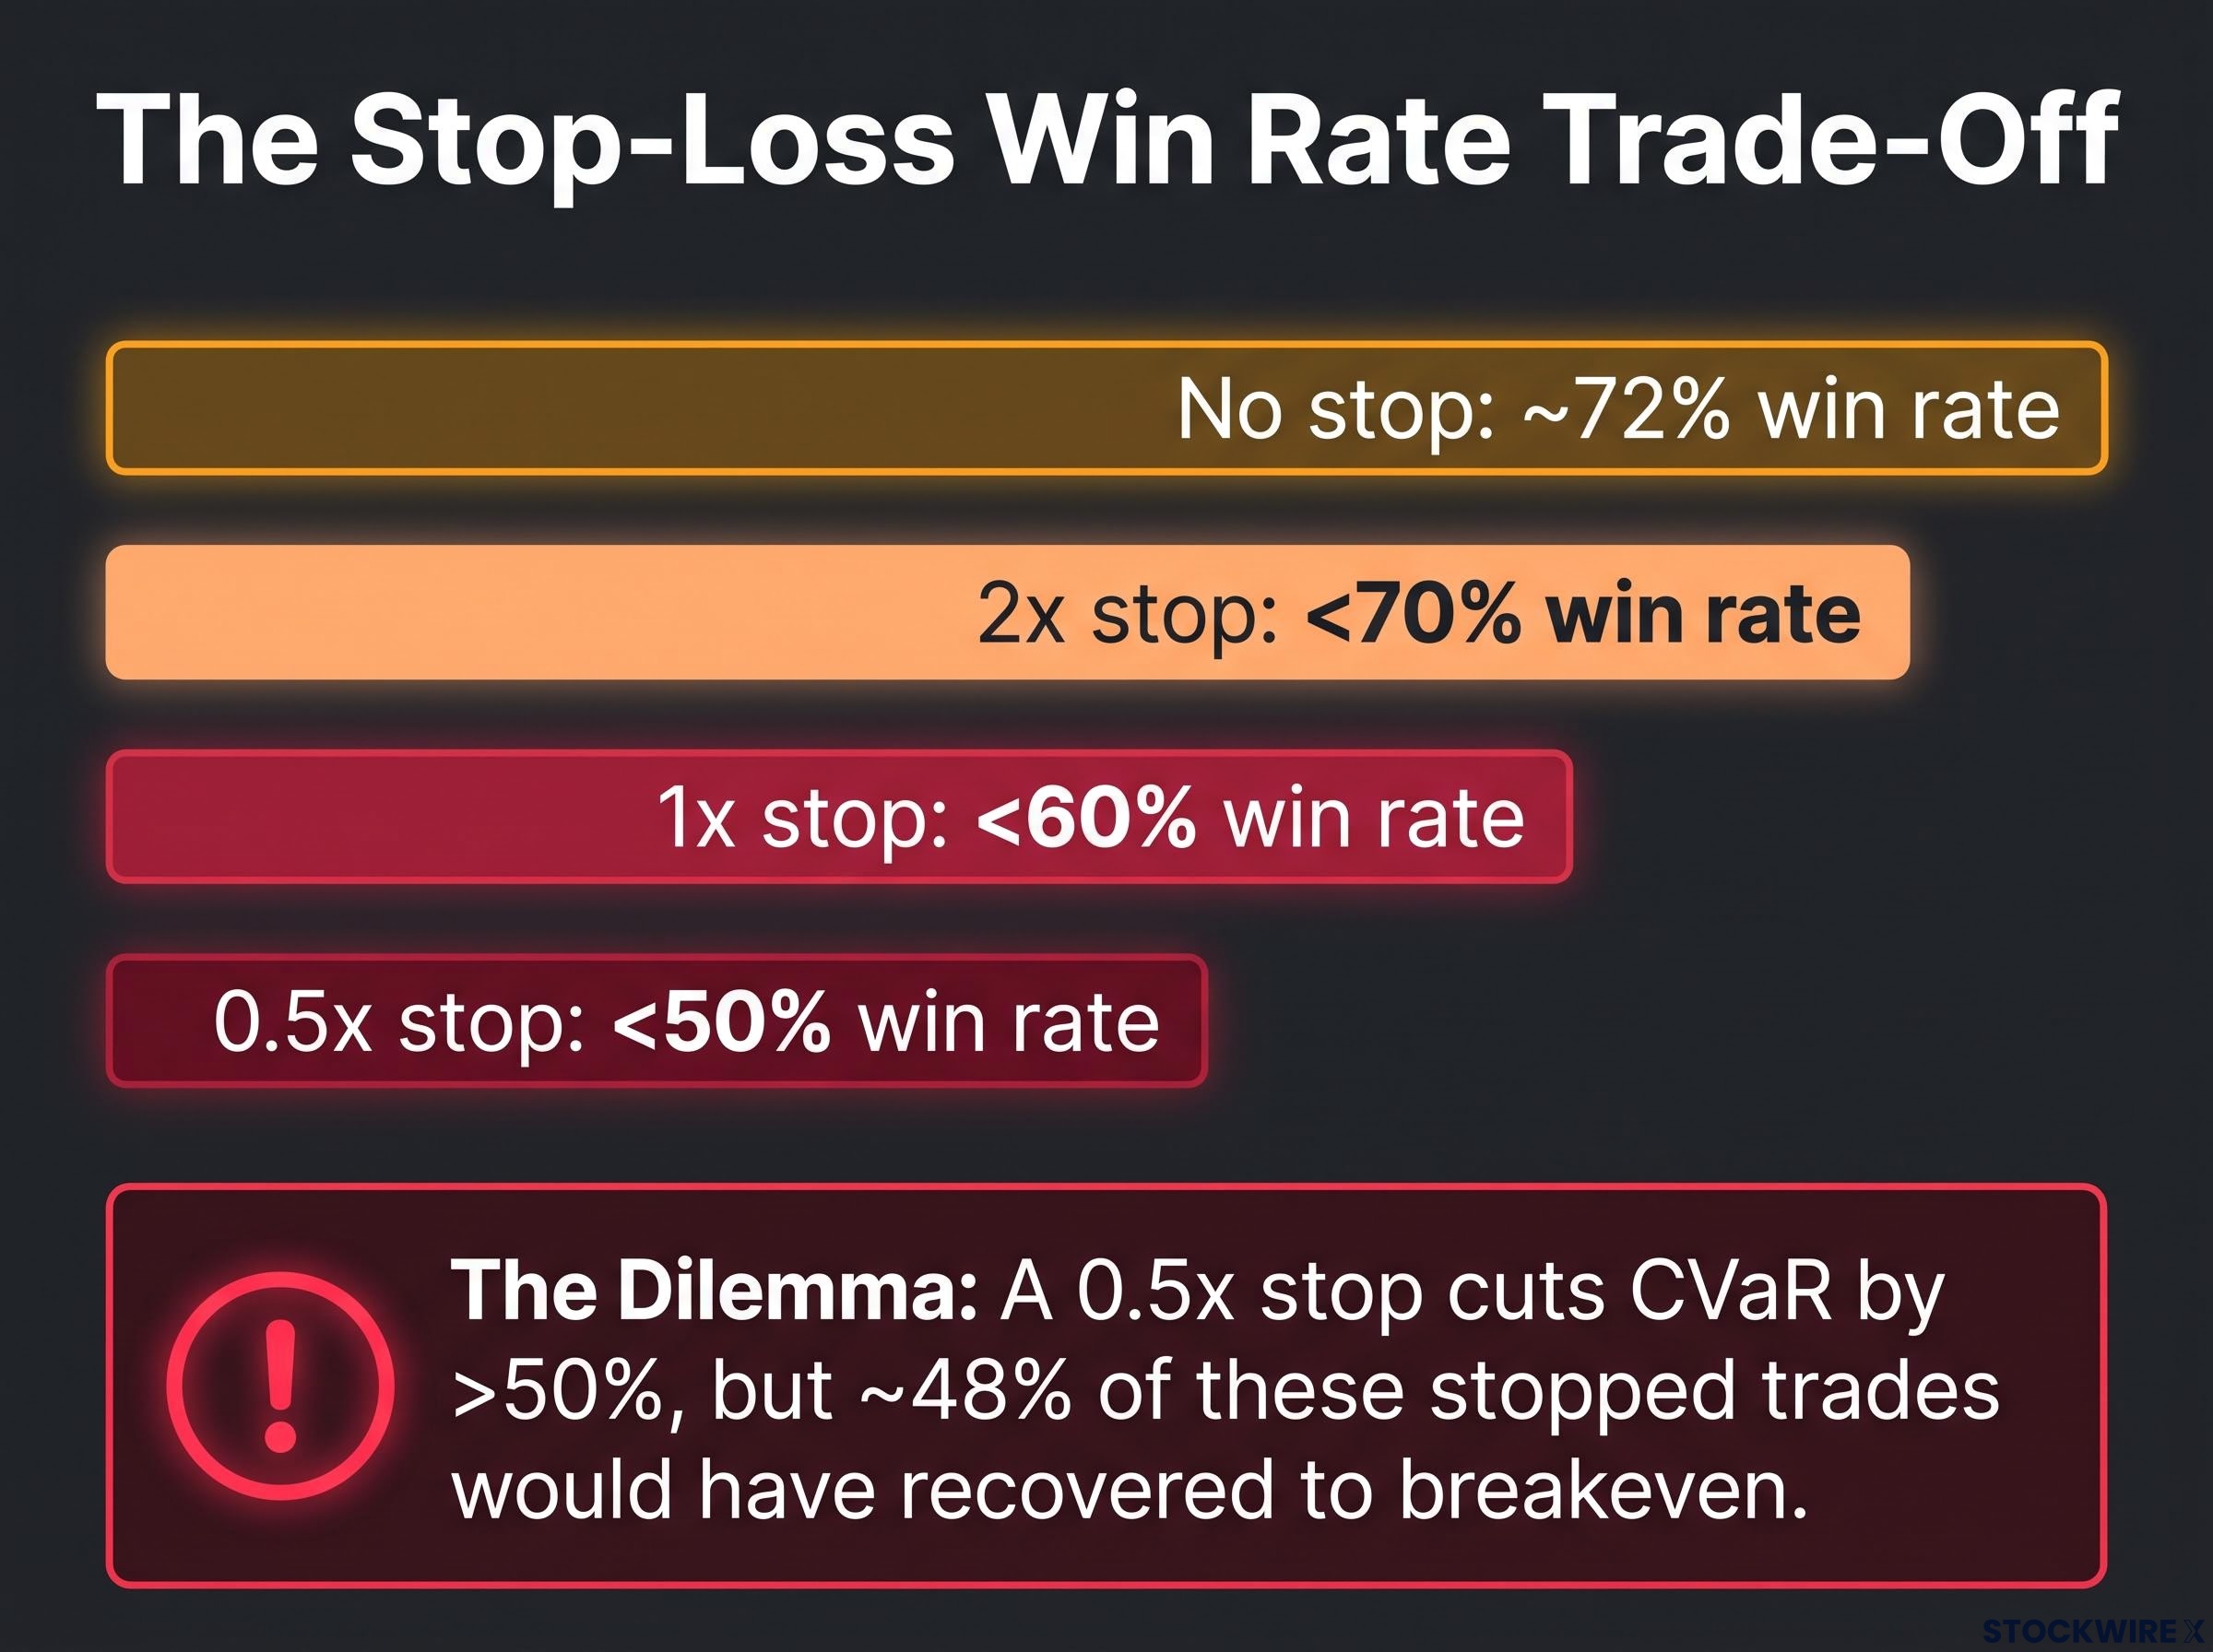
Return on capital tracks the same decline. At the 0.5x threshold, return on capital was cut by approximately half, directly because the stop closes positions that would have recovered. So the tightest stop delivers the best tail protection and the worst return, all from the same mechanic.
The structural explanation sits in the gamma dynamics Cboe describes. A move violent enough to trip your stop can be followed by an equally violent reversal, driven by the same dealer hedging flows. The stop fires at the bottom of the air-pocket, then the price snaps back. That is the mechanical reason the recovery rate is so high.
Does a sub-50% win rate kill the strategy? Not automatically. In short-premium trading, a low win rate is survivable if your average winner meaningfully exceeds your average loser. The reassuring detail is that average P&L stayed positive across all three stop-loss levels tested, meaning average gains still beat average losses even with degraded win rates.
That positive average P&L is the number to interrogate before you commit to an aggressive stop. It is what separates a lower-return version of a winning strategy from a broken one. The 0.5x stop does not turn a winner into a loser. It turns a higher-return, higher-stress trade into a lower-return, lower-stress one.
Two frameworks for managing the trade-off: combining stops with profit-taking and the position-sizing alternative
The data leaves you at a decision point rather than an answer. Two coherent frameworks address the trade-off from different angles, and neither is definitively correct. What follows below is meant to give you the variables to weigh, not a verdict.
Combining stop-loss and profit-taking thresholds
The tastytrade research team identifies the most promising path as combining stop-loss management with profit-taking, and the logic is complementary. Profit-taking locks in gains before expiration, which tends to raise the win rate. Stop-loss management caps the downside, which reduces CVaR.
Used together, the two have the potential to partially offset each other’s costs. Profit-taking could restore some of the win rate that stops alone strip away, while the stop still holds down tail risk. It is the closest thing in this data to having both.
The catch is honest and worth stating plainly. Tastytrade identified the optimal combination of stop-loss and profit-taking thresholds as a future research topic, not something resolved in the primary study. Practitioners running this combination today are doing so without a definitive, data-backed answer on where to set each threshold.
Position sizing as the primary control
The second framework flips the hierarchy. Here, position sizing and daily loss limits are the first line of defence, and stops are secondary.
Strike-Watch sets out the specific parameters:
- Cap risk at 1-2% of your account per zero-DTE trade
- Enforce a hard 3% daily loss limit, then stop trading zero-DTE for the day
- Cut position size by 50% when SPX is within 0.5% of the zero-gamma level or in a negative GEX (gamma exposure) regime, where dealer hedging tends to amplify moves
The reasoning is that if per-trade risk is capped at 1-2% of the account, the worst outcome on any stopped trade is already bounded by that account fraction. For a trader sizing this way, aggressive intraday stops may be partly redundant, because the sizing itself absorbs the variance. You can afford to let positions ride through the drawdowns that a tight stop would cut, precisely because no single trade can hurt you badly.
Fixed-dollar-risk sizing resolves the same trade-off from the other direction: if every trade is bounded to 1-2% of the account regardless of stop placement, the variance from a triggered stop becomes a second-order concern rather than the primary risk management question.
But there is a condition under which sizing alone is not enough. In fast, thin markets, fixed-multiplier stops can execute far beyond the intended threshold, filled deep into a gap or skipped entirely. This is most acute in negative GEX regimes and near zero-gamma levels, which is exactly why Strike-Watch pairs those conditions with a size reduction.
The absence of a definitively optimal setup in the public record is itself informative. Every trader in this space is making a calibration judgment under genuine uncertainty. These frameworks are the best-available scaffolding, not solved parameters, and the strongest position combines all three tools: stops, profit-taking, and sizing. Given that zero-DTE trades ran at roughly 2.4 million SPX contracts a day at 62.4% of SPX volume in August 2026, per Cboe, these gamma dynamics are a structural feature of the market, not a rare event.
What the data actually settles, and what it leaves open
Strip it back to the anchoring trade-off. A 0.5x stop cuts CVaR by more than half but drops the win rate below 50% and halves return on capital. That is the entire decision in one sentence, and the 48% recovery rate is what makes it genuinely hard rather than obvious.
What the data settles is real. Stop-loss management demonstrably reduces tail risk and intraday volatility. The cost is equally real and equally quantified, measured in lost win rate and reduced return on capital. And the one piece of unambiguously good news is that average P&L stayed positive at all three stop-loss levels tested.
That last point reframes the whole exercise. You are not choosing between a losing strategy and a winning one. You are choosing your preferred point on a risk-return curve, and the data gives you enough to locate that point honestly.
Three questions remain genuinely open, and they are worth carrying forward:
- The optimal combination of stop-loss and profit-taking thresholds has not been publicly backtested to a definitive result
- Regime-specific performance, differentiated by GEX environment, has no publicly quantified backtest
- Individual account structure (size, frequency, concentration) changes which framework fits
So the question to answer for yourself before setting any stop rule is this: are you optimising for reduced drawdown and psychological sustainability, for maximum return on capital, or for a balance of the two? The data is clear that these goals require different stop calibrations and cannot all be maximised at once. Where the evidence runs out, your own risk preference has to fill the gap.
Traders who find the iron condor’s recovery-rate dilemma unresolvable sometimes migrate toward defined-risk SPX structures with asymmetric payoff profiles, such as butterflies, where the maximum loss is bounded by the net debit and the high-convexity exposure suits regimes where a sharp move followed by a reversal is the expected sequence.
This article is for informational purposes only and should not be considered financial advice. Investors should conduct their own research and consult with financial professionals before making investment decisions. Past performance does not guarantee future results. Financial projections are subject to market conditions and various risk factors.