When one of the world’s largest investment banks tells its clients it can no longer produce a baseline forecast for a market it has modelled for decades, that is not a routine caveat. It is an admission.
During the week ending 27 September 2026, JPMorgan analysts stated they had no baseline view on oil markets for the first time since the Iran conflict began, citing an inability to model how the crisis resolves. Forecasting is the business. When the business says it cannot see the road ahead, the road has genuinely changed.
For Australian investors, this is not an abstract Wall Street problem. The ASX has been drifting lower, the 10-year government bond yield has climbed to levels last seen in 2011, and a reset risk-free rate has quietly rewritten the maths on every asset class you own. The oil price impact on Australian investors runs straight through the bond market and into equity valuations.
This piece gives you a framework for reading current conditions: what is actually driving the pressure on your portfolio, how professional fund managers are responding, and the specific questions you should be asking about your own positioning right now.
When JPMorgan cannot model the baseline, the market is in genuinely uncharted territory
An institution abandoning its baseline forecast is a stronger signal than any single price move. JPMorgan employs some of the most sophisticated commodity modelling capability on the planet, and during the week ending 27 September 2026 its analysts concluded the variables were too uncertain to produce a central case.
JPMorgan analysts stated that, for the first time since the onset of the Iran conflict, they had no baseline view on oil markets, citing an inability to model the ultimate resolution of the conflict. Numerous economic red lines had already been breached, yet the path to resolution had grown less defined rather than clearer.
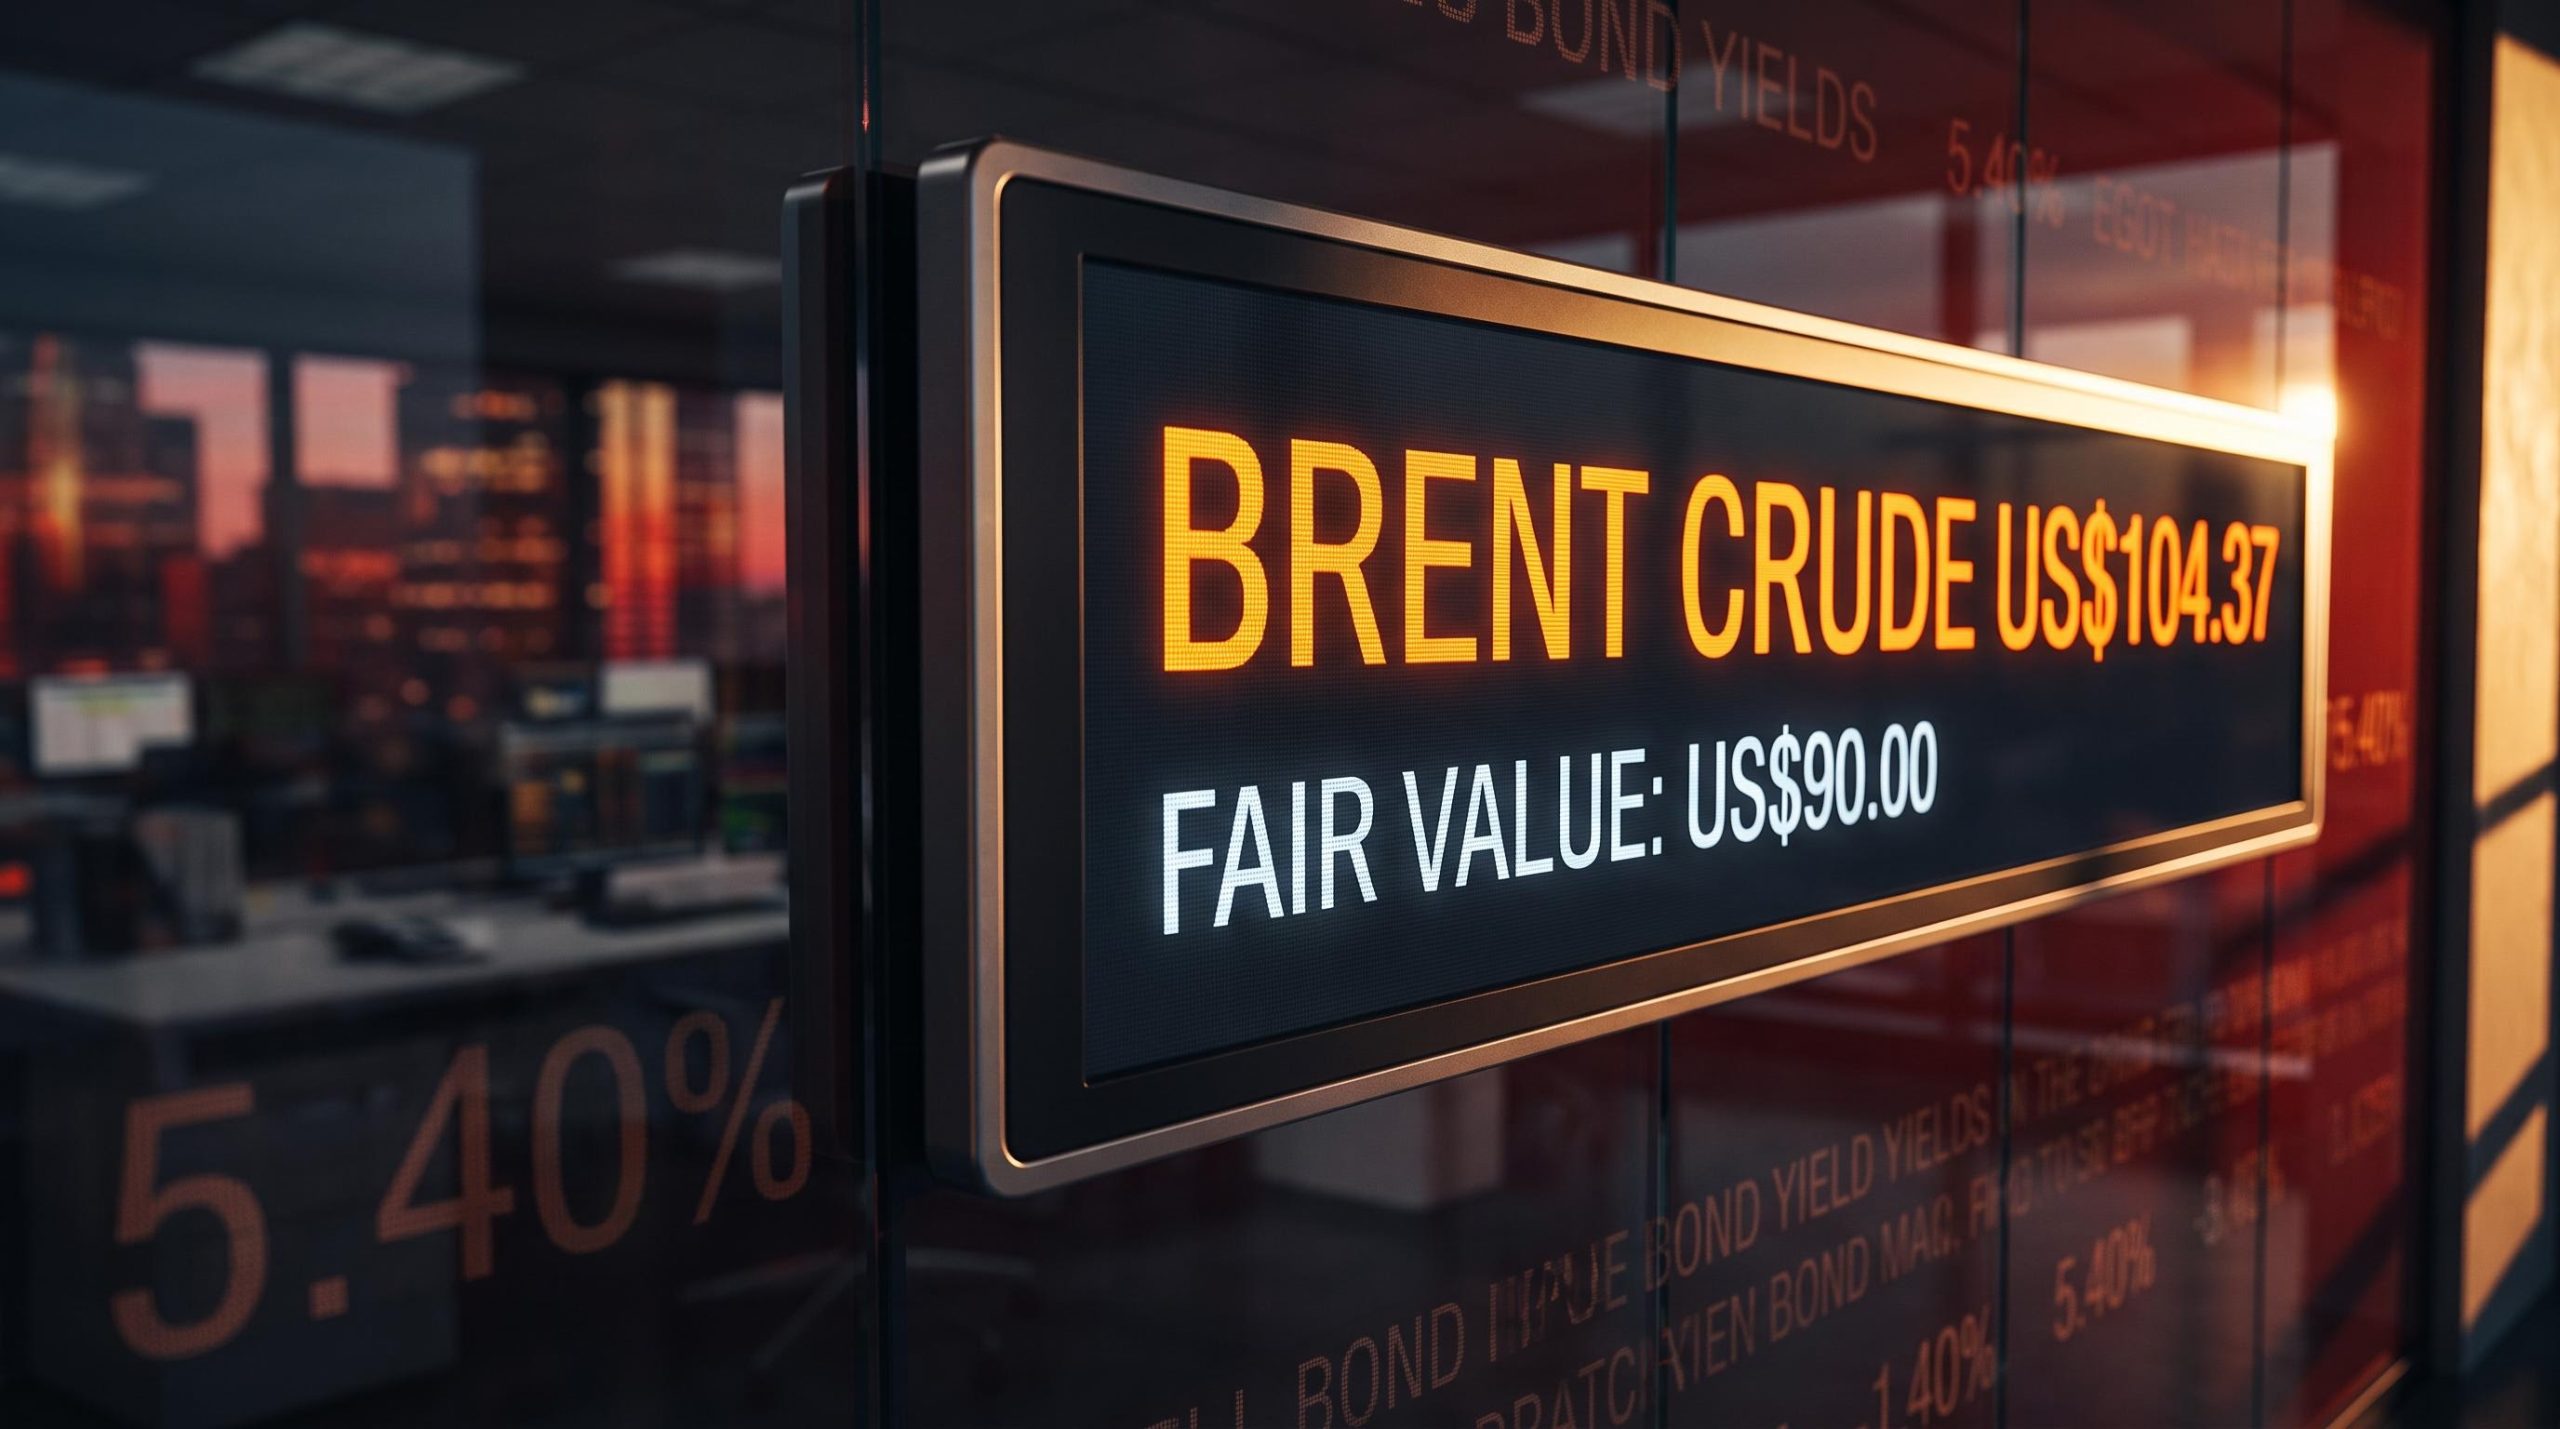
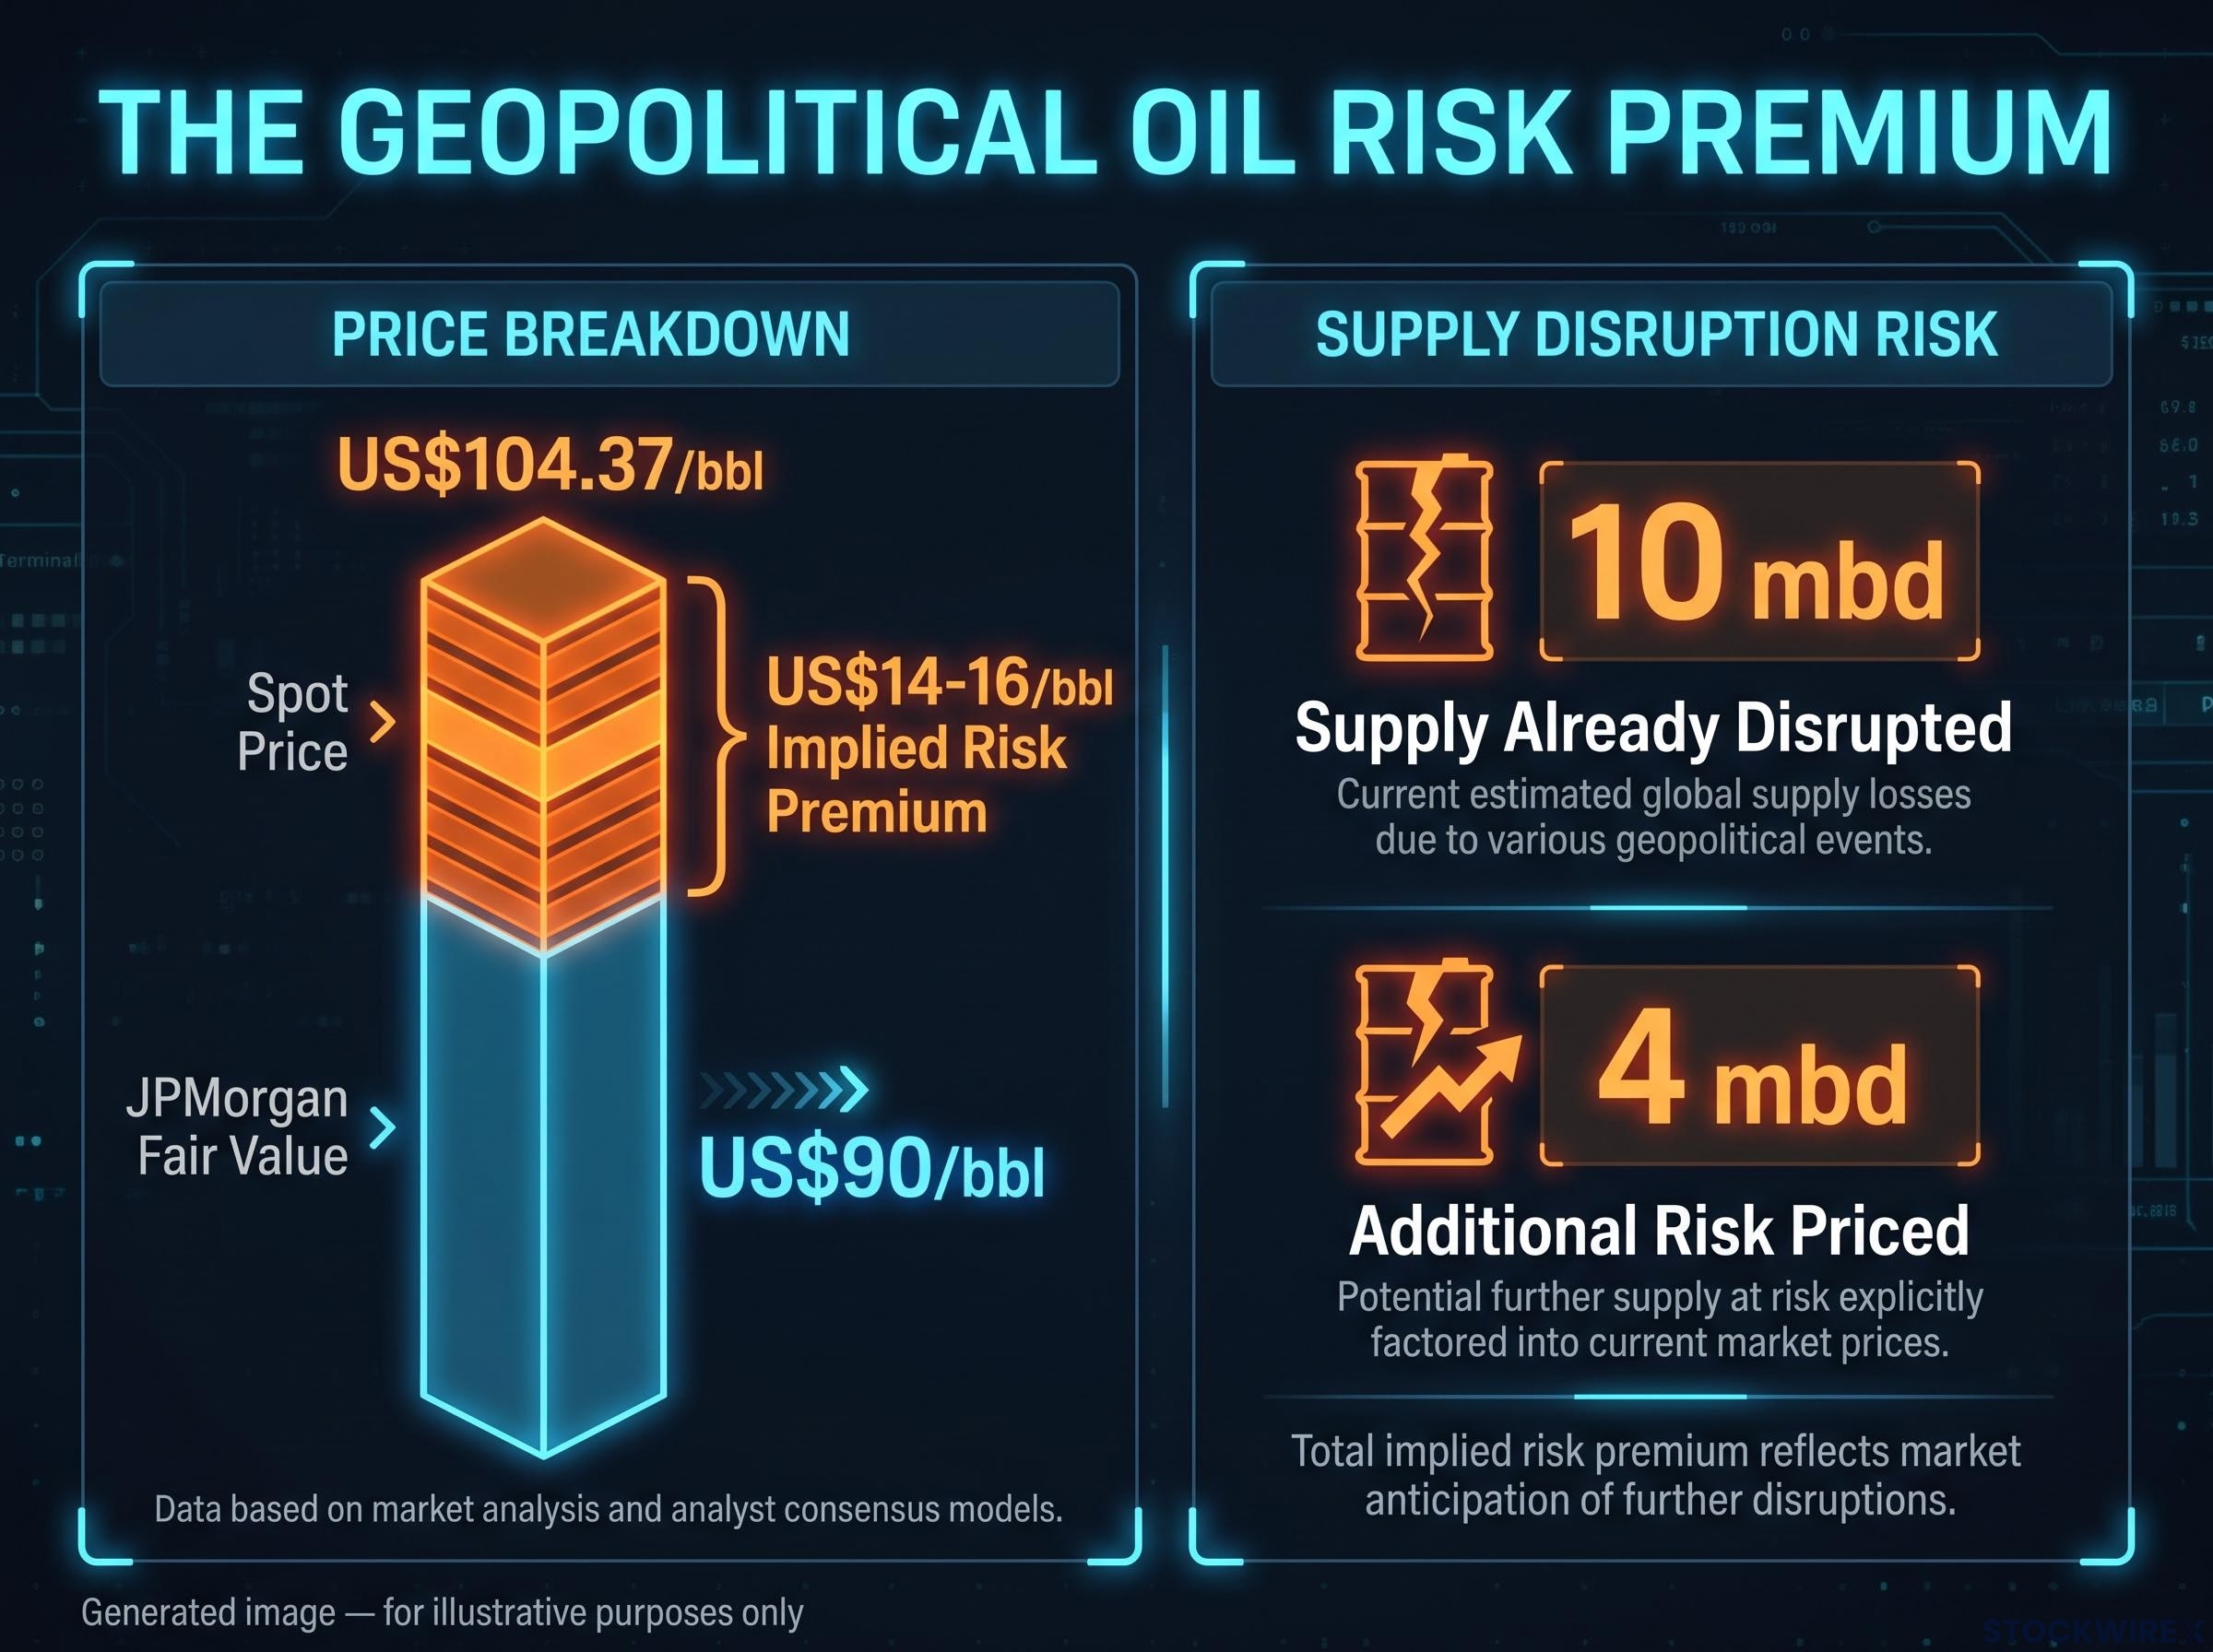
The numbers behind that admission show the scale of the dislocation. Brent crude traded at US$104.37 per barrel on 25 September 2026, according to Trading Economics, while JPMorgan pegged fair value for September at just US$90 per barrel. That gap of roughly US$14-16 per barrel is the geopolitical risk premium, priced in real time.
This premium is not noise. It represents the market’s collective judgment that the conflict has a meaningful probability of escalating further. For you, that changes how any near-term price move should be read: a fall from US$104 back toward fair value would more likely signal de-escalation than collapsing demand, and that distinction matters enormously for how you interpret energy sector exposure.
The premium rests on a physical foundation, not just speculation. JPMorgan estimated the market was pricing the risk of an additional 4 million barrels per day (mbd) of disruption on top of the 10 mbd already affected, implying up to 14 mbd of supply at risk. The dislocations are tangible:
- Damage to Saudi Arabia’s East-West pipeline
- Suspension of crude loadings at the Red Sea export hub of Yanbu
- Saudi Aramco cancelling some deliveries to European refiners after the pipeline attack
- Restricted tanker traffic through the Strait of Hormuz, cutting crude flows and constraining refinery output
The refined product side is even tighter. The diesel crack spread, the refining margin between crude and diesel, hit a record of approximately US$107 per barrel on 1 September 2026, according to LSEG data. U.S. retail diesel reached record highs, with Reuters citing US$6.45 per gallon on 18 September 2026 per AAA data, while Market Index cited US$6.31 per gallon for the week ending 27 September 2026.
The Hormuz bottleneck has produced distortions far beyond crude oil, with diesel crack spreads running at $80-$100 per barrel, four to five times the historical norm, confirming that a significant share of current inflation originates in the refining layer rather than crude costs alone.
| Metric | Value | Source / Date |
|---|---|---|
| Brent crude spot price | US$104.37/bbl | Trading Economics, 25 Sep 2026 |
| JPMorgan fair value (September) | US$90/bbl | JPMorgan via Market Index |
| Implied geopolitical risk premium | ~US$14-16/bbl | Derived, week ending 27 Sep 2026 |
| Oil supply already disrupted | 10 mbd | JPMorgan via Market Index |
| Additional disruption risk priced | 4 mbd | JPMorgan via Market Index |
When big ASX news breaks, our subscribers know first
What a 5.4% bond yield actually does to Australian equity valuations
Oil markets do not hit your portfolio directly. They hit it through the bond market, and the mechanism is worth understanding because it explains almost everything happening on the ASX right now.
The value of any share is, in theory, the sum of its future cash flows converted back into today’s dollars. That conversion uses a discount rate. When the discount rate rises, the present value of those future cash flows falls, and the effect is harshest for companies whose earnings sit far out in the future.
Growth stocks and long-duration assets, real estate investment trusts among them, feel this most acutely because more of their value depends on profits years away. A higher discount rate shrinks those distant profits the most.
That is why the yield move matters to every equity holder, not just bond investors. The Australian 10-year government bond yield reached 5.40% on 25 September 2026 and 5.39% the following day, according to Trading Economics, up from 5.16% on 1 September 2026, a level ABC News described as the highest since April 2011. These are yields Australian investors have not dealt with for roughly 15 years.
ASX bond yields at 5.3% look extreme against the post-GFC period but were present in 27.1% of all weeks since 1990, and the historical data show that yield levels alone carry almost no standalone predictive power for equity direction; what matters is what is driving the yield, and the current rise is largely real-rate and term-premium driven rather than inflation-expectations-led.
Todd Barlow of Soul Patts framed the practitioner’s version of this at Livewire Live during the week ending 27 September 2026, referencing a risk-free rate of 5.3%. At that level, the hurdle rate for every investment decision has been reset, and cash and defensive allocations are genuinely competitive with equities in a way they have not been for over a decade.
RBA rate expectations and what the market is pricing
Markets assigned an 85-95% implied probability of a 25-basis-point hike from the current 4.35% cash rate at the RBA’s 29 September 2026 meeting, according to Trading Economics, which forecasts a peak of 4.85-5.10% by early 2027. The ANU Crawford School Shadow Board reinforced the split picture:
- 59% modal recommendation probability for a 25-basis-point increase now
- 70% probability that a rate above 4.35% is optimal today
- 69% probability that a lower rate will be optimal three years out
That final figure is the forward signal that matters most. It suggests the current rate environment is likely near its peak, which means the window to lock in a 5.3% risk-free rate may be limited. If you are sitting in cash, you need a view on when to redeploy, not just whether the rate is attractive today.
How professional investors are repositioning, and what it signals about market risk
The clearest read on how seriously professionals are treating these conditions comes from what they are actually doing with money, and one number stands out.
Soul Patts reduced its listed equity allocation from approximately 90% to around 40% of its portfolio, with cash raised to roughly 20%, according to Todd Barlow at Livewire Live during the week ending 27 September 2026. This is not a tactical trim at the margins. It is a structural judgment that, against a 5.3% risk-free rate, the risk-adjusted return on equities does not currently justify full market exposure.
That framing should prompt every Australian investor to ask the same question about their own equity-to-defensive balance.
Not every professional reached for cash. James Hawkins of L1 Capital kept equity exposure but skewed it toward businesses with natural macro hedges, structuring his portfolio across three categories: U.S. dollar earners, resource companies, and defensives. His holdings include BlueScope, MinRes, and Lottery Corp.
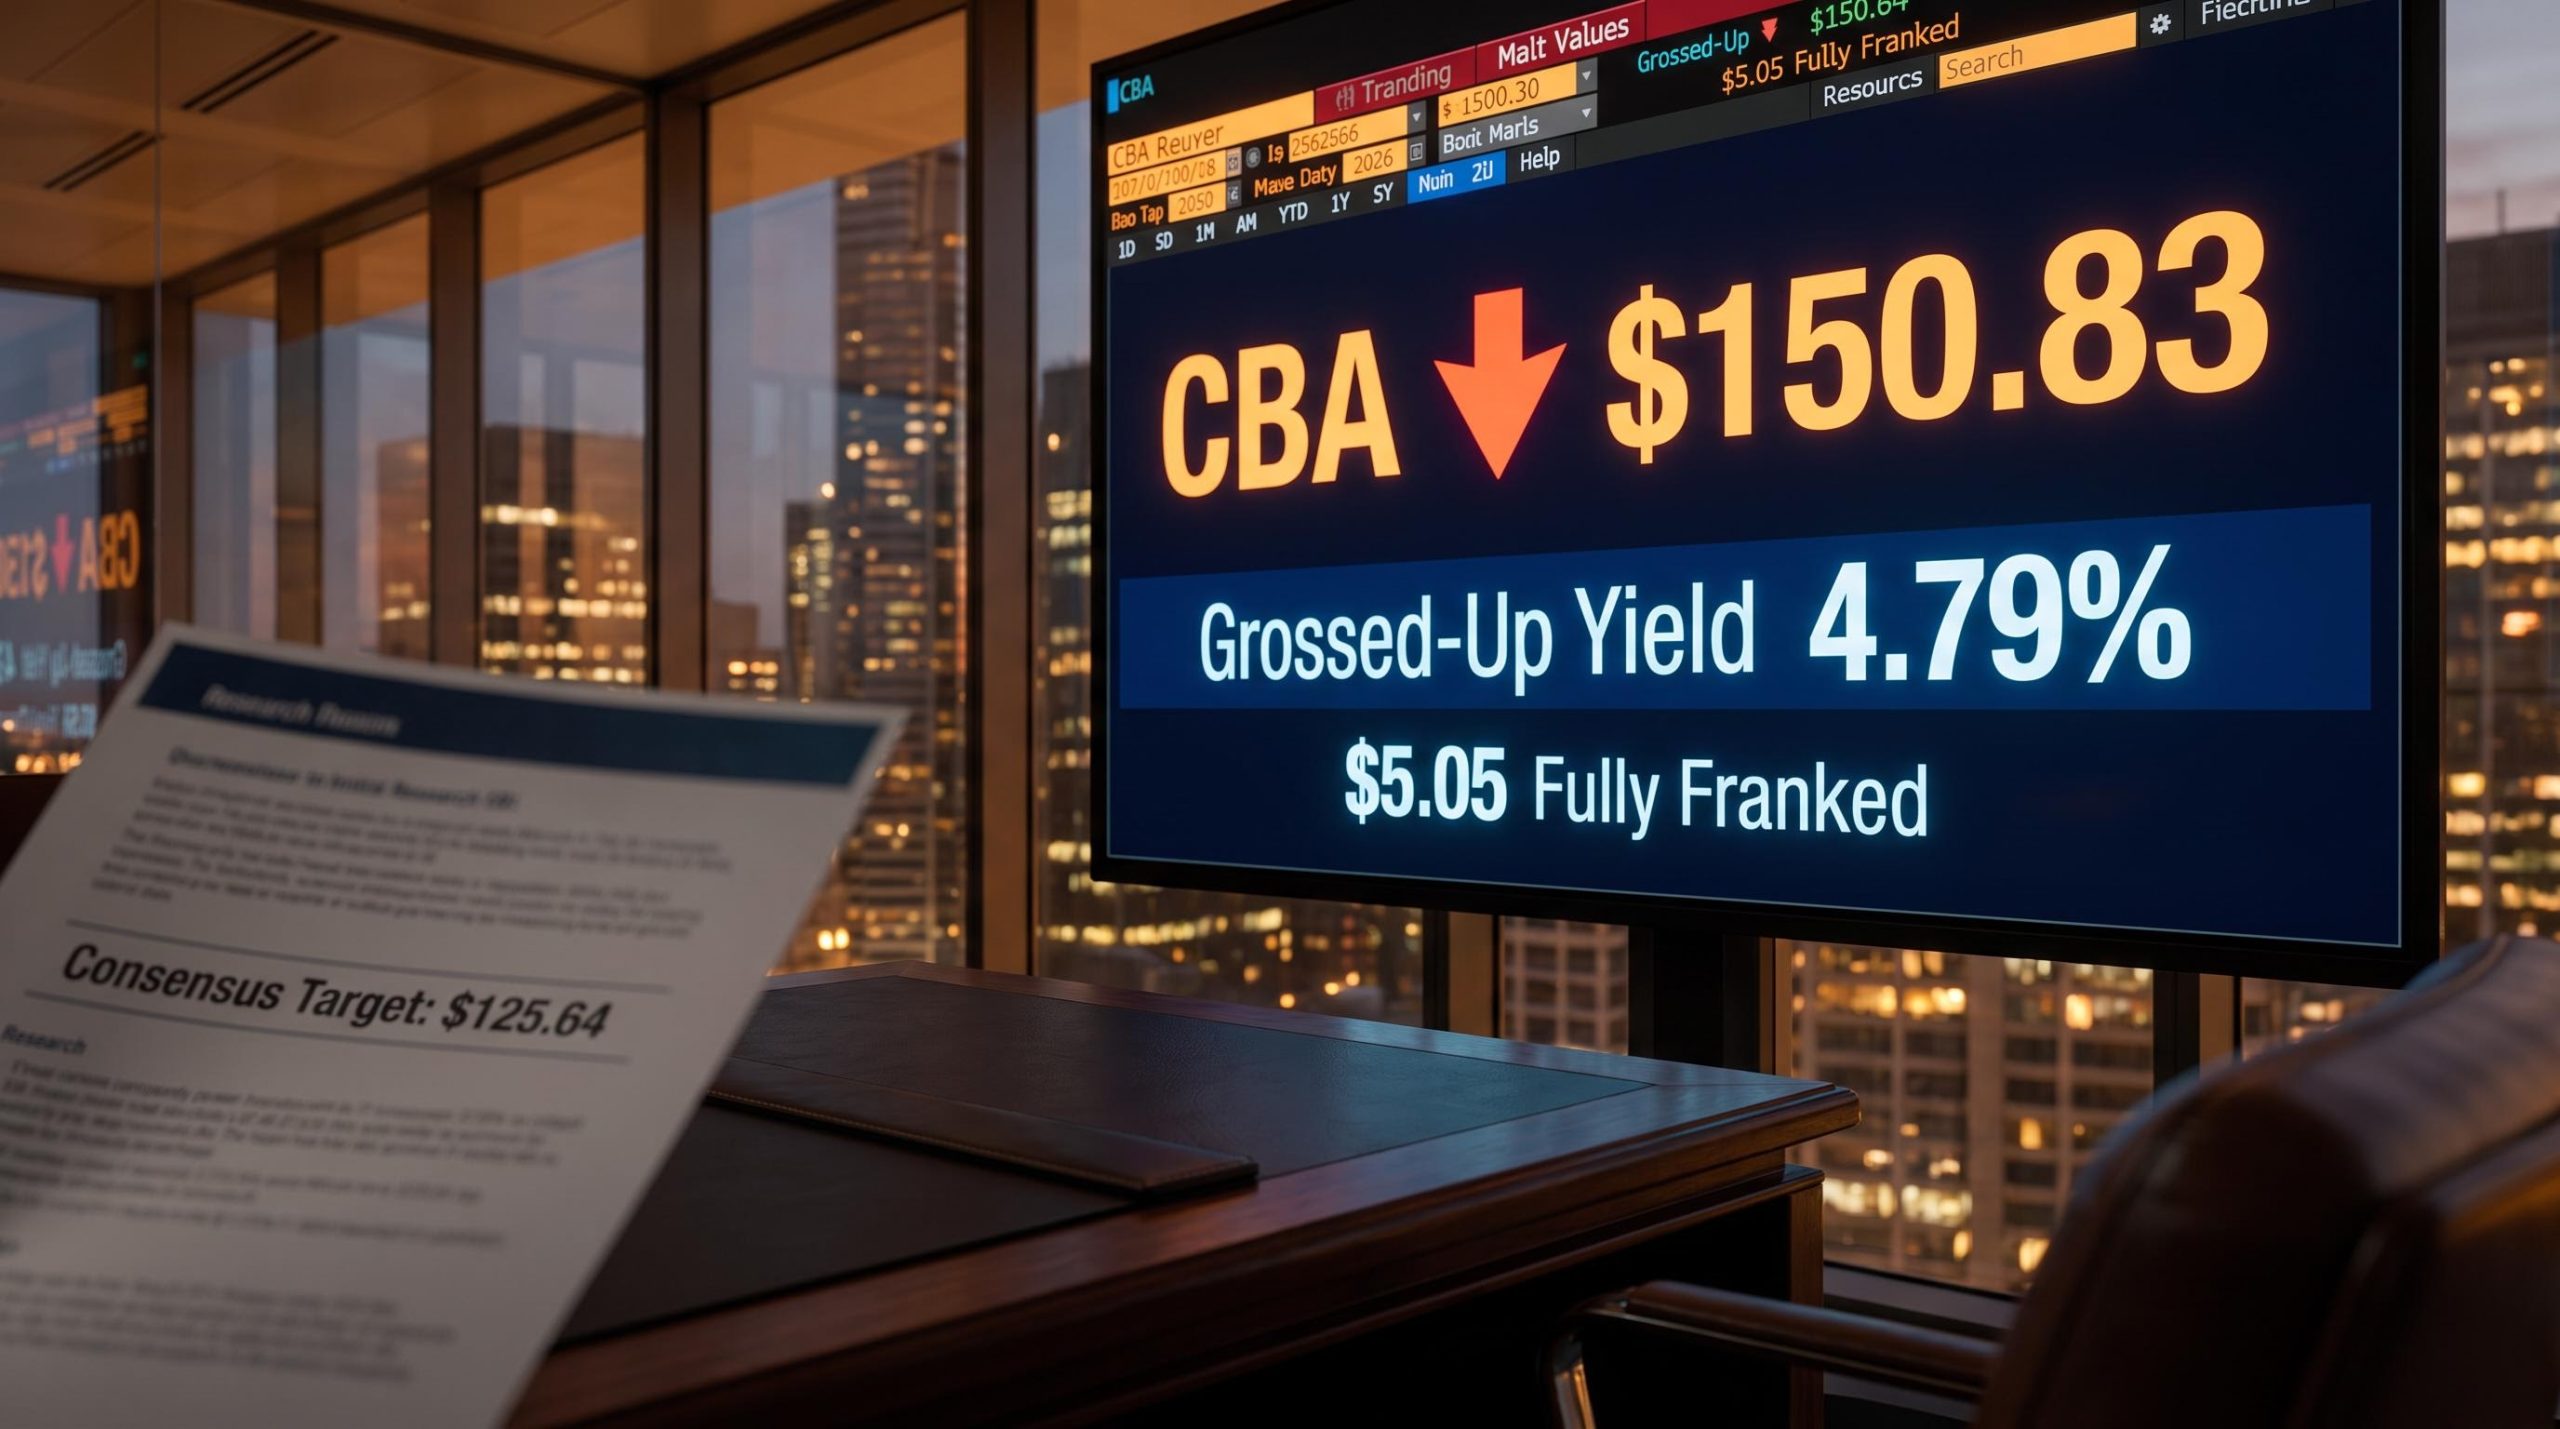
The scrutiny being applied at a 5.3% risk-free rate cuts deep into individual names. Dougal Maple-Brown argued Commonwealth Bank could halve if it re-rated to trade in line with peer banks at 15x earnings, a reminder of how much valuation air a higher hurdle rate can let out. Meanwhile, Sean Roger of Perpetual and Joseph Koh of Blackwattle disagreed on several stocks but both flagged ResMed and Lottery Corp as buys.
| Manager / Firm | Positioning / View | Key Holdings or Thesis |
|---|---|---|
| Soul Patts (Todd Barlow) | Defensive, equities cut ~90% to ~40%, ~20% cash | Capital preservation at 5.3% risk-free rate |
| L1 Capital (James Hawkins) | Equity exposure via macro-hedged categories | BlueScope, MinRes, Lottery Corp |
| Perpetual (Sean Roger) | Selective buys | ResMed, Lottery Corp |
| Blackwattle (Joseph Koh) | Selective buys | ResMed, Lottery Corp |
| Maple-Brown (Dougal) | Bearish on CBA | Could halve on peer re-rating to 15x earnings |
Set against all this defensive positioning sits a curious counter-signal in the sentiment data.
Bearish sentiment fell to 44.9% for the week ending 27 September 2026, down from 54.4% the prior week, yet remained at the 89th percentile historically, according to the Market Index investor sentiment survey.
Extreme bearish readings at this level raise a legitimate question about whether the market is overpricing the downside. It is worth flagging with caution: no Australian historical base rate data is available to confirm how sentiment readings this extreme have typically resolved, so treat it as a question rather than a conclusion.
The macro loop connecting oil, yields, and the ASX: a framework for reading what comes next
Step back from the individual readings and a single reinforcing loop comes into view. These are not three separate events. They are one connected machine.
Elevated oil prices feed inflation expectations. Higher inflation expectations keep the RBA in tightening mode. Tightening pushes bond yields higher. Higher yields lift the discount rate and compress equity valuations. Compressed valuations and a higher hurdle rate drive defensive repositioning, which removes buying support from the market. Each turn of the loop reinforces the next.
The stagflationary loop described by strategists watching Hormuz, Fed policy, and tariff transmission simultaneously mirrors the reinforcing dynamic playing out in Australia, where energy inflation keeps the RBA hawkish, elevated rates compress equity multiples, and defensive repositioning removes buying support from the index.
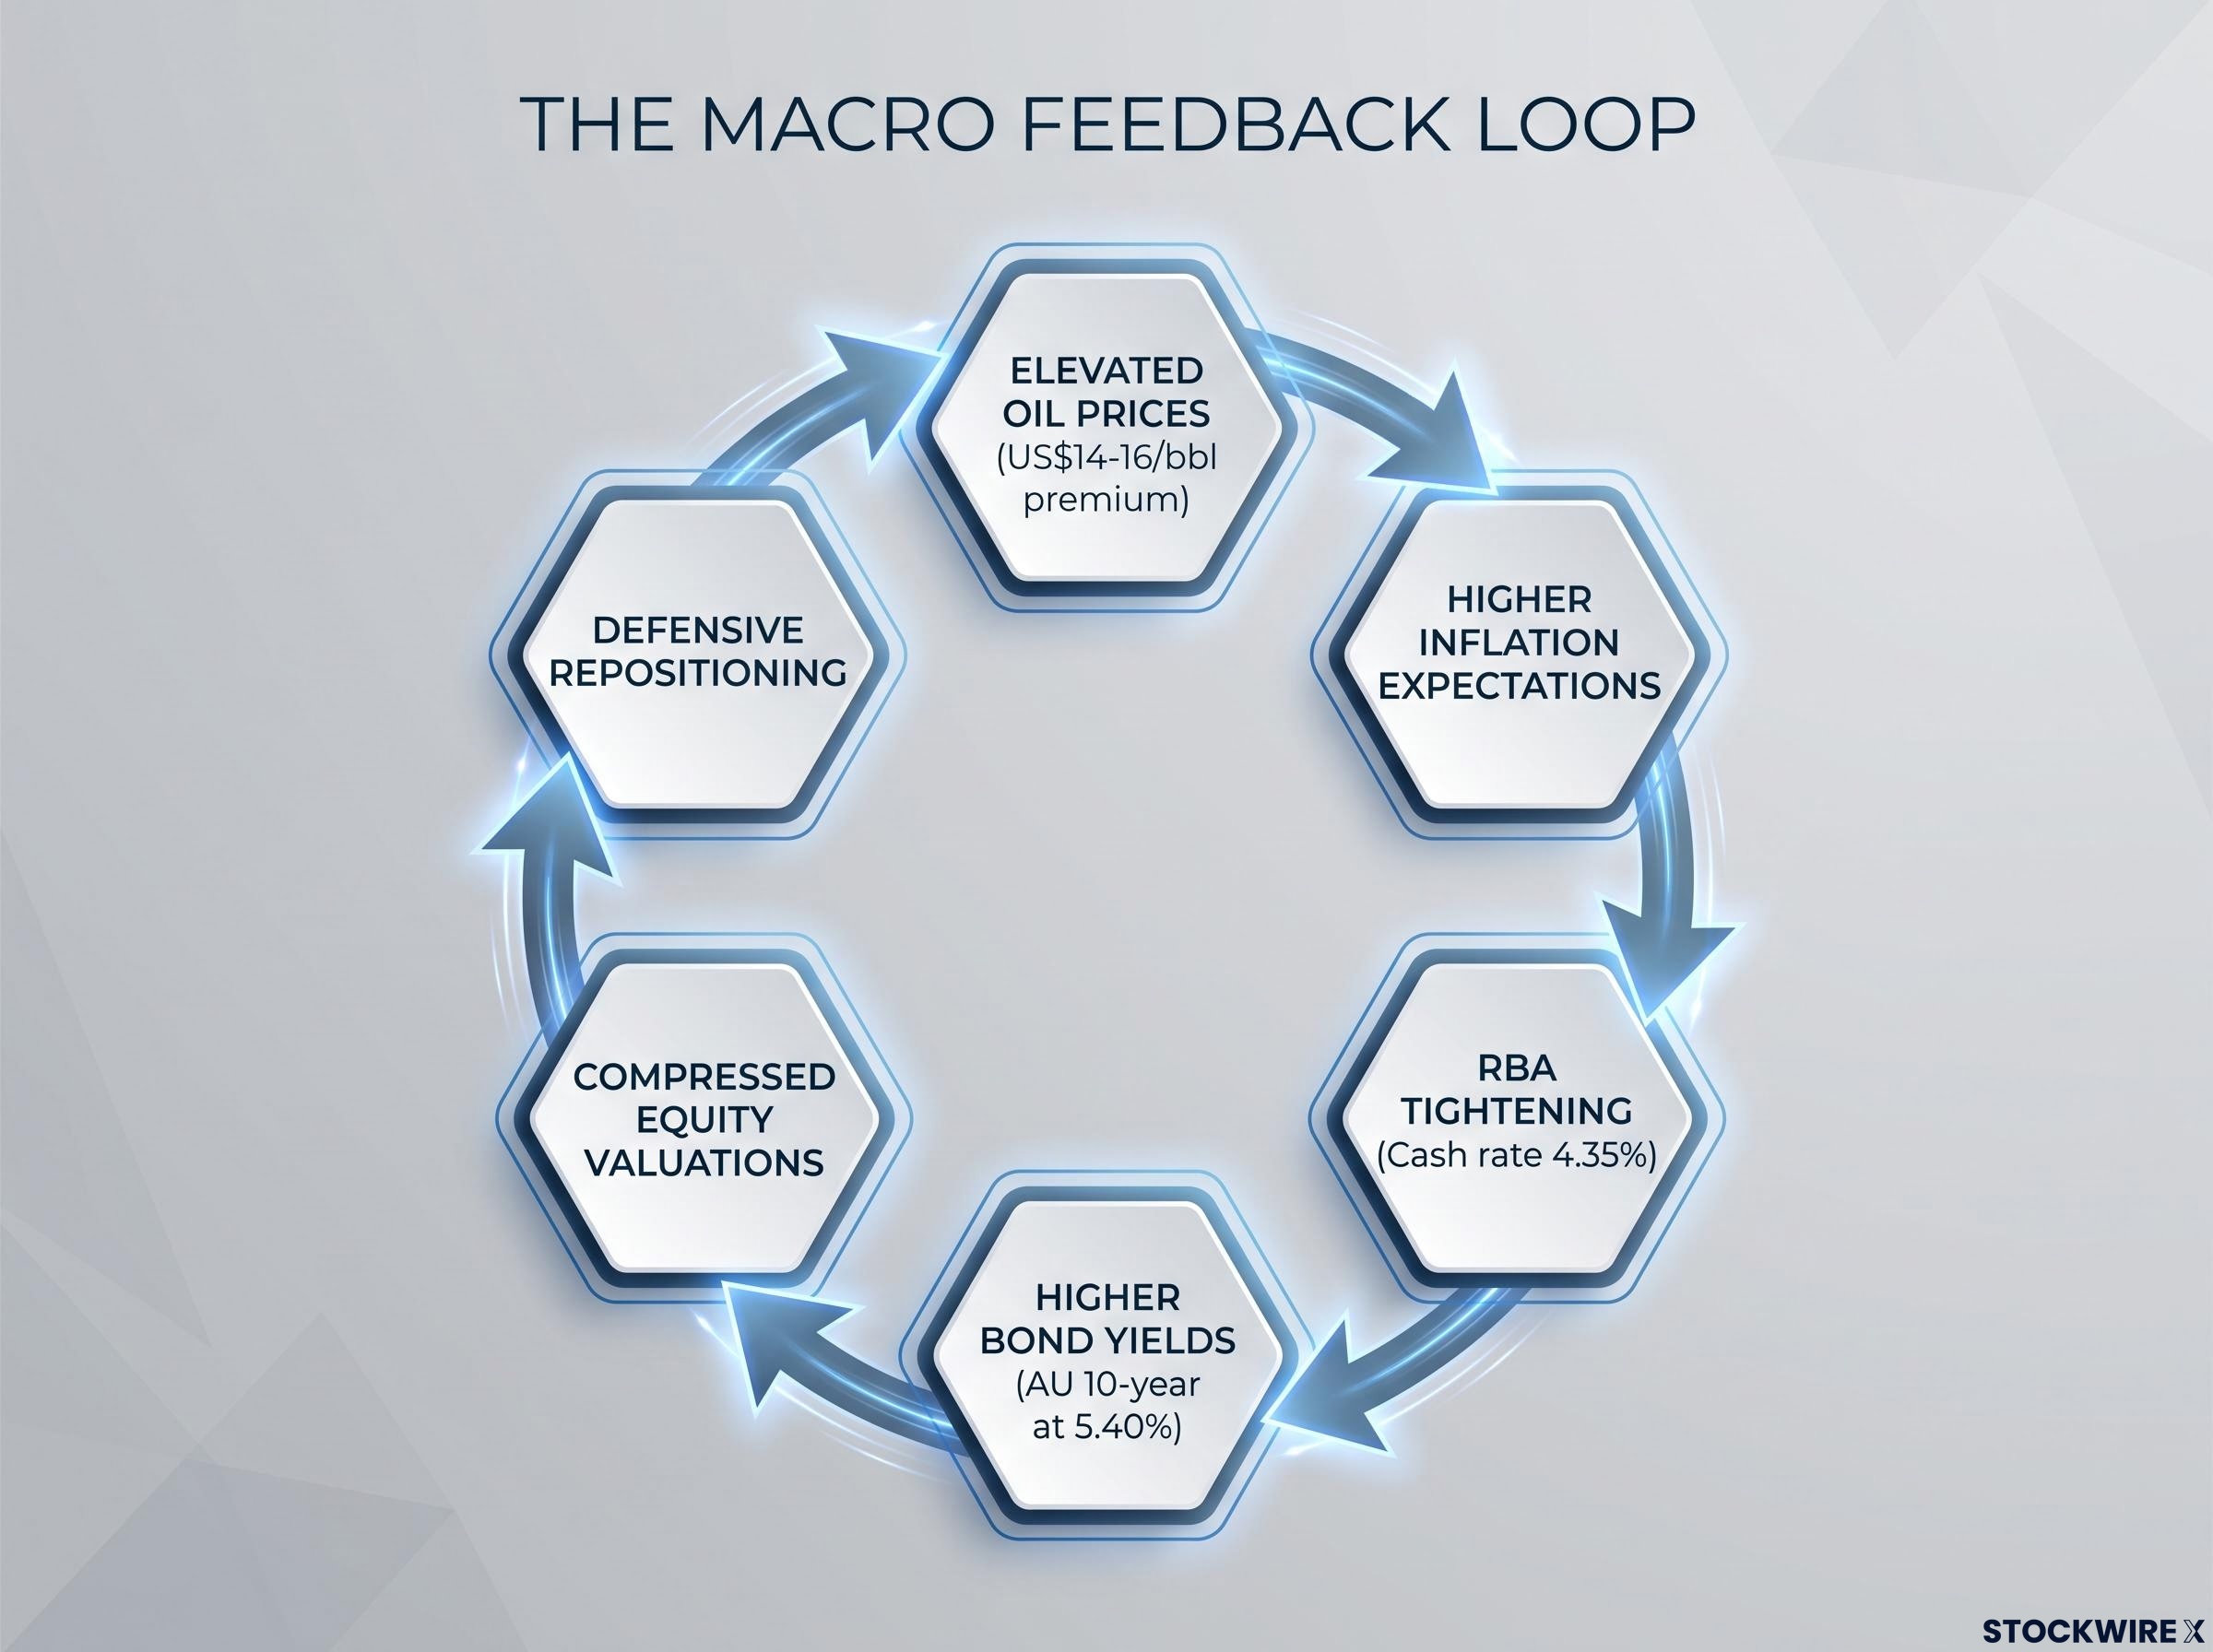
Understanding the loop is useful because it tells you where to watch for it to break. Three variables will signal a change in direction:
- The oil risk premium. A de-escalation in the Middle East would strip the US$14-16 per barrel premium out of the oil price, removing the inflation pressure feeding the whole loop.
- RBA pivot signals. The ANU Shadow Board’s 69% probability that lower rates will be optimal in three years is the clearest indication the tightening cycle has an end in sight.
- A sentiment reversal. Bearishness at the 89th percentile is both a risk indicator and a potential contrarian trigger if extreme pessimism unwinds.
Here is the read for you: a resolution in the Middle East would not simply move oil prices. It would relieve the inflation pressure keeping the RBA hawkish, ease yield pressure on ASX valuations, and potentially unwind the defensive positioning that has been suppressing the market. That makes conflict de-escalation the single most powerful macro catalyst currently available.
The honest posture here is JPMorgan’s own. If the institution best-resourced to forecast oil has abandoned its baseline, the appropriate response is to build for multiple scenarios, not to bet on one. Soul Patts’ 20% cash allocation is one example of positioning designed to survive more than a single outcome.
Longer-dated signals for investors with a multi-year horizon
Beyond the current cycle sit structural forces worth holding in view. Ben Griffiths argued at Livewire Live that coal-fired power retirements from 2028 would drive a 50% increase in Australian gas demand by 2035, positioning natural gas as the primary scalable energy transition solution, a tailwind that exists independently of the current macro turbulence.
The rate signal points the same direction over time. The ANU Shadow Board’s 69% three-year probability of lower rates is a reason investors currently overweight cash or defensives should be thinking about when, not whether, to rebuild equity duration exposure.
Positioning for resilience when the map has been taken off the table
The picture that emerges is coherent even in its uncertainty. Oil sits at a heavy geopolitical premium with no institutional baseline behind it. Bond yields are at 15-year highs, resetting every hurdle rate across the ASX. Investor sentiment sits at extremes that are simultaneously a warning and a contrarian question.
For readers wanting to see how a single US yield session transmitted into a 151-point ASX loss in May 2026, our dedicated guide to the ASX sell-off mechanics details which sectors bore the sharpest losses and why gold miners faced a dual squeeze from higher real yields and rising input costs.
The professional responses show two legitimate paths through the same conditions. Soul Patts prioritised capital preservation, moving decisively into cash. L1 Capital prioritised macro-resilient equity exposure through U.S. dollar earners, resources, and defensives. Neither is the correct answer. Both are coherent responses to a genuinely difficult environment.
The most actionable takeaway is also the most honest. When even the largest institutions are working without a baseline, your job is not to predict the outcome but to build a portfolio that can survive more than one of them. Three questions are worth putting to your own holdings:
- What is my equity-to-defensive balance at a 5.3% risk-free rate, and does it still make sense?
- What is my exposure to the oil risk premium, and how would a de-escalation scenario change my holdings?
- What is my plan for the eventual RBA pivot, given the 69% three-year probability of lower rates?
This article is for informational purposes only and should not be considered financial advice. Investors should conduct their own research and consult with financial professionals before making investment decisions. Past performance does not guarantee future results. Financial projections are subject to market conditions and various risk factors, and forward-looking statements are speculative and subject to change based on market developments.