Nvidia just became the world’s largest company by market value, carrying roughly $5.4 trillion, and yet its options right now are priced as though almost nothing is about to happen. With a 30-day implied volatility rank sitting at 2.7%, contracts on the most-watched stock in the market are near the cheapest they have been in a year, just weeks before a mid-November earnings release that could move the shares by 22 points or more.
That combination, a mega-cap edging toward a $6 trillion valuation with options resting at a historical pricing floor ahead of a major catalyst, gives you a concrete, teachable setup. Building a workable Nvidia options strategy starts with understanding three tools: how implied volatility rank works, how earnings reshape the volatility surface, and how probability-weighted price targets actually behave.
Here is what the current setup tells you, and here is how to read it yourself. This piece walks you through the specific tools traders use to assess a situation like this one, what the current Nvidia data genuinely signals, and where the real risks sit for anyone considering a position.
What IV Rank and rolling implied volatility actually measure
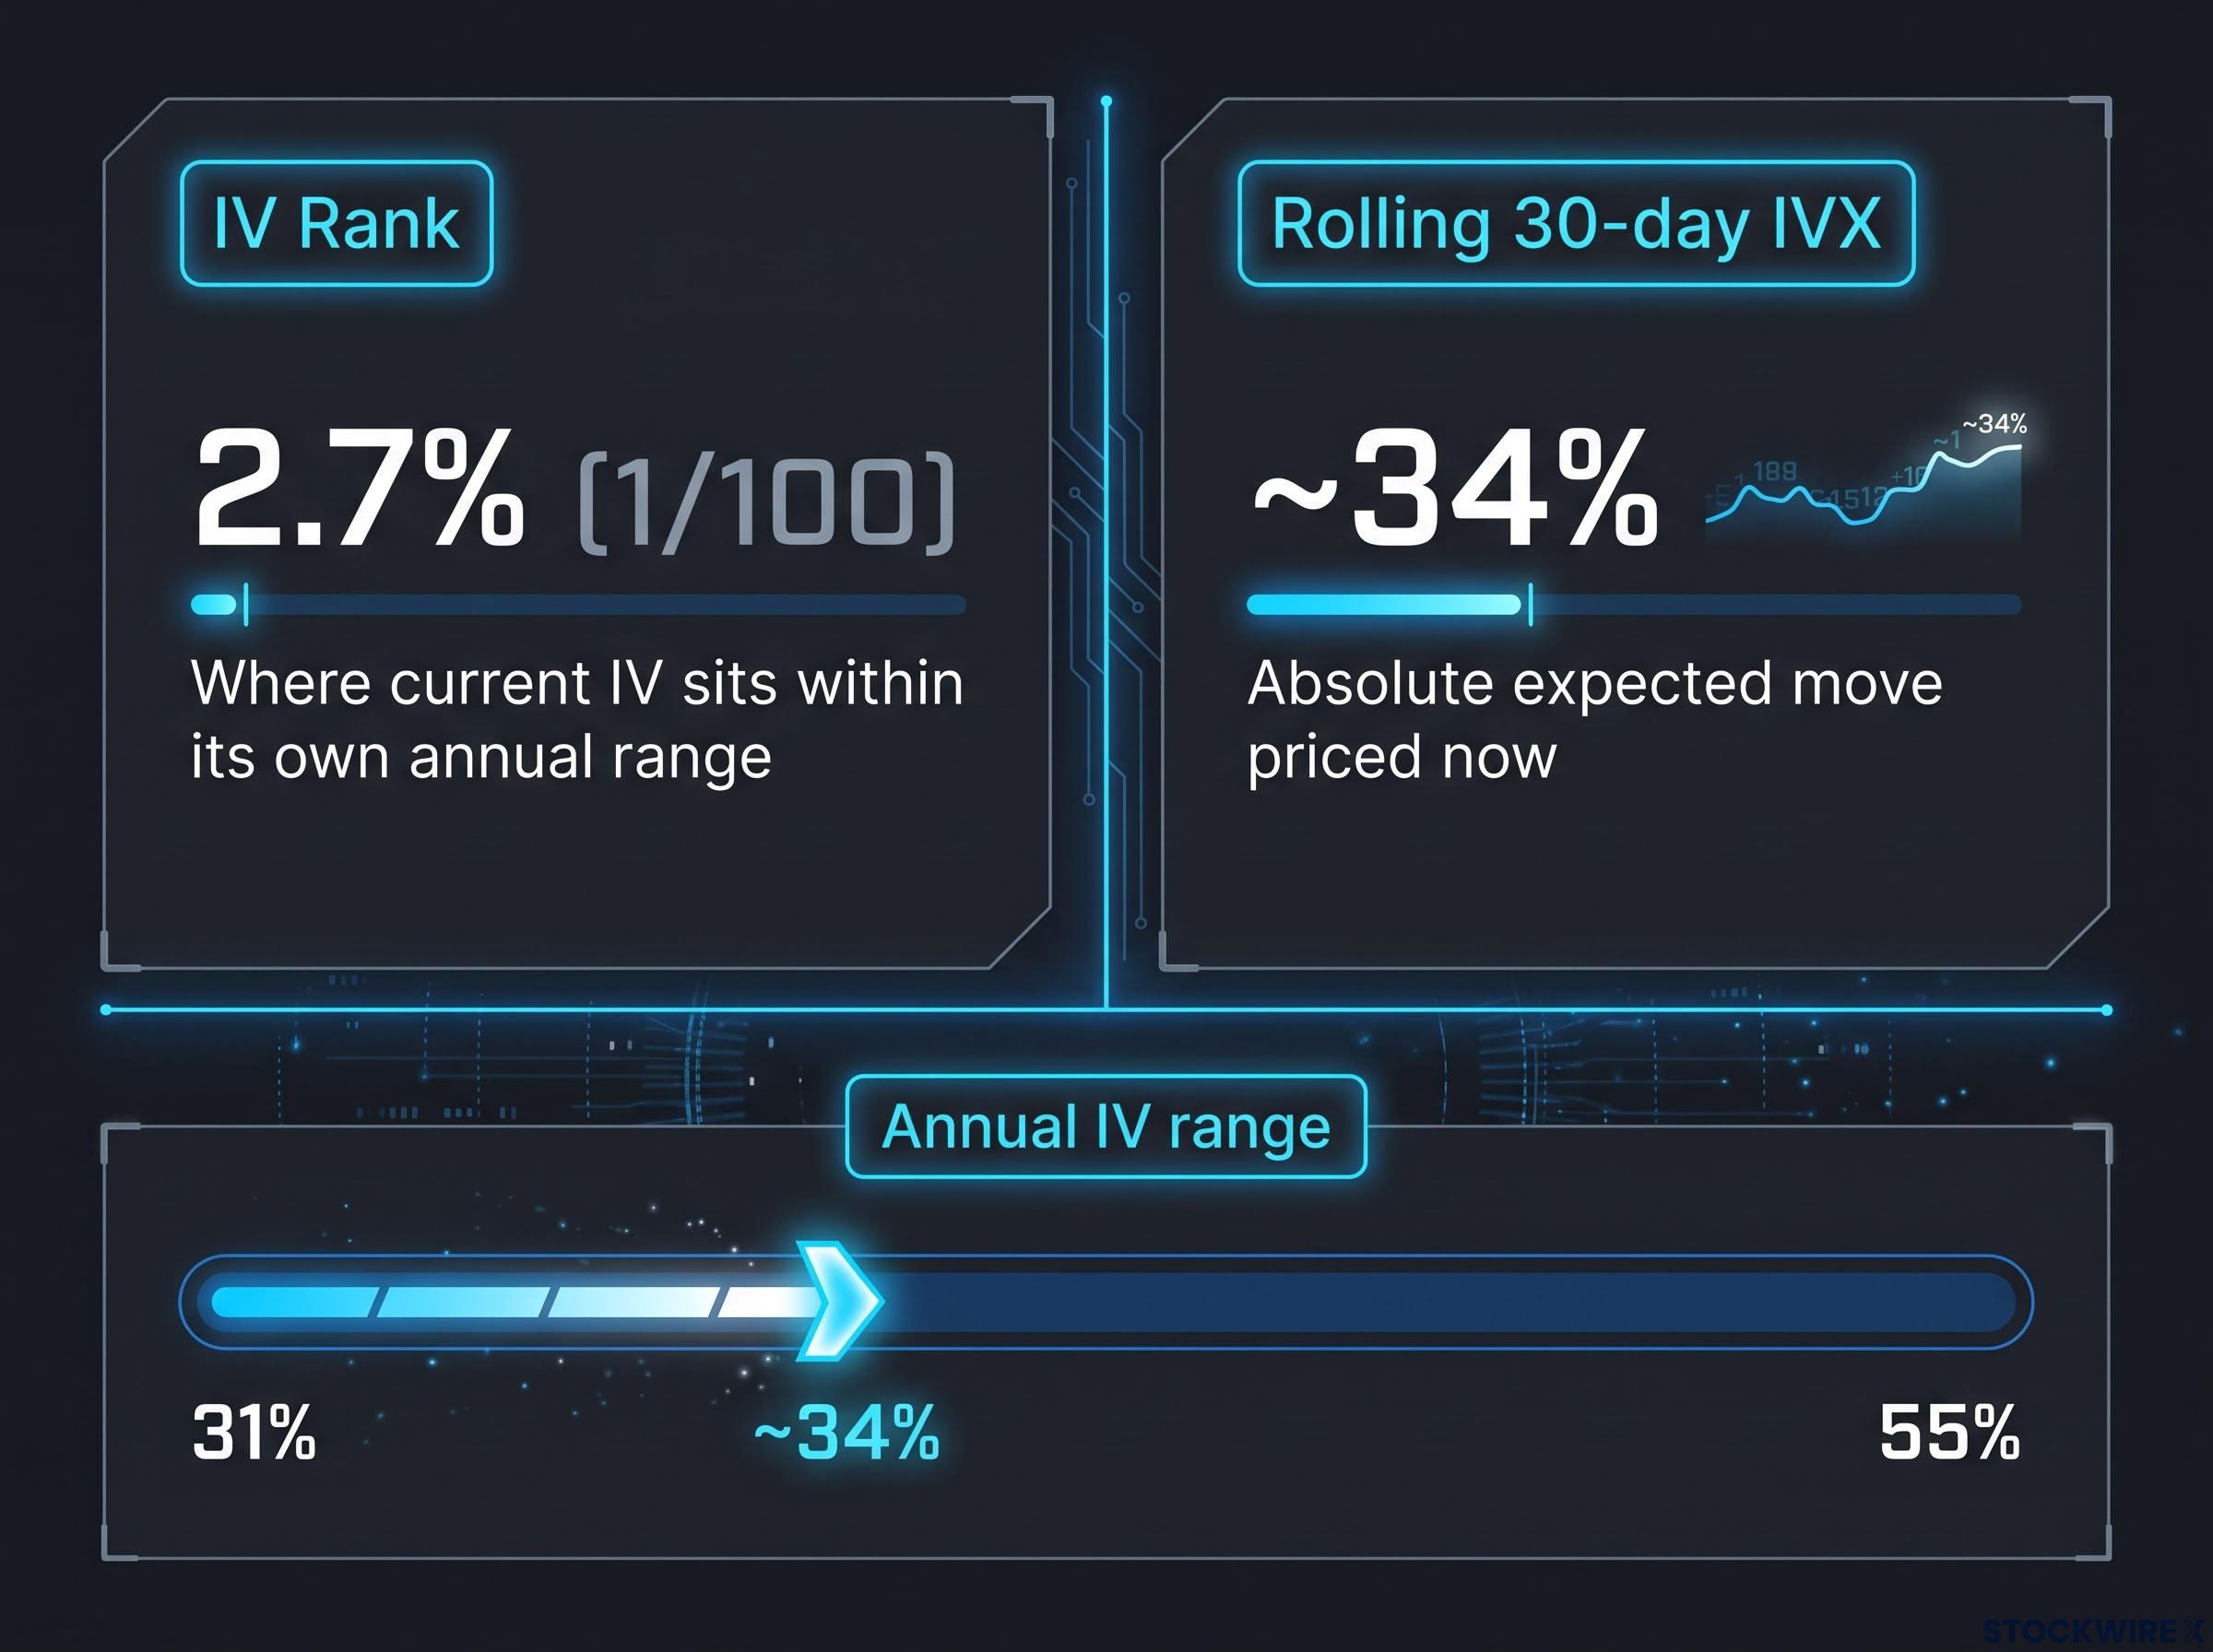
Open any options platform for Nvidia today and two numbers stand out: an IV Rank of 2.7% and a rolling 30-day implied volatility of roughly 34%. They look similar. They measure completely different things, and reading them together is where a real edge begins.
IV Rank is a percentile-style metric. It places current implied volatility inside Nvidia’s own annual range rather than comparing it to the broader market. When the original analysis reports an IV Rank of 2.7%, and OptiView data via StockWireX describes the same condition as a rank of 1 out of 100, both are saying the same thing with different scaling conventions: options are sitting at the very bottom of where they have traded over the past year.
Implied volatility is extracted by reverse-engineering the Black-Scholes model from live market prices, not from historical data, making it a real-time collective estimate of expected move magnitude; every Greek and probability figure your platform displays is a downstream output of the implied volatility reading at each specific strike.
What this means for you personally is straightforward on one side and easy to miss on the other. A rank this low translates directly into lower dollar cost per contract if you are buying. It also signals that the market is not expecting a large near-term move. You get both messages in the same number, and you need to weigh both before acting.
IV Rank versus rolling IVX: two metrics, one picture
The rolling 30-day IVX, at approximately 34%, answers a different question. IV Rank tells you whether options are cheap or expensive relative to their own history. IVX tells you the absolute expected move the market is pricing right now.
Context is what turns 34% into a signal. Nvidia’s implied volatility has ranged between 31% and 55% over the past year, so a 34% reading sits near the floor, not the middle. When both metrics point to the low end at the same time, the signal that options are at an unusual pricing floor gets stronger, not weaker.
| Metric | Current Reading | What It Measures | What It Signals |
|---|---|---|---|
| IV Rank | 2.7% (1/100) | Where current IV sits within its own annual range | Options near the cheapest in a year |
| Rolling 30-day IVX | ~34% | Absolute expected move priced now | Small near-term move expected |
| Annual IV range | 31%-55% | The band IV has traded in over 12 months | 34% sits near the lower bound |
Understanding these two figures separately is the foundation for everything that follows. It also sets up the tension that defines this setup, because the calm on your screen is expected to break in mid-November.
When big ASX news breaks, our subscribers know first
The earnings catalyst and why it changes the volatility calculus
The consensus window for Nvidia’s next earnings release is 16 to 21 November 2026, with Zacks pointing to 18 November as the most recent single-date estimate and Yahoo Finance flagging 17 November. That date is why the current calm is temporary, and to see why, it helps to watch how implied volatility behaved in Nvidia’s two most recent earnings cycles.
Start with May 2026. Saxo Bank’s options brief showed the event-week expiry (22 May) carrying an implied volatility of 85.24%, against just 45.20% for the first non-event monthly expiry on 18 June.
The event-week expiry carried an implied volatility of 85.24% versus 45.20% for the June 18 monthly expiry. That gap is the earnings volatility surface made visible.
Now look at August 2026. According to Investing.com, options priced an implied move of just 5.4%, well below the 7.4% historical average over the previous 12 quarters, yet still corresponding to a market-cap swing of roughly $280 billion. Reuters corroborated that same $280 billion figure.
What this means for you personally is the whole point of the exercise. The gap between a 5.4% implied move and a 7.4% historical average is not a technicality. It is the market telling you it expects a smaller-than-usual reaction, and if you are buying premium, you need that expectation to be wrong, in either direction, to profit.
| Cycle | Implied Move | Historical Average | Event-Week IV | Non-Event IV |
|---|---|---|---|---|
| May 2026 | ~6.5% | 7.6% (ORATS) | 85.24% | 45.20% |
| August 2026 | 5.4% | 7.4% | Not disclosed | Not disclosed |
The pattern across both cycles has a name: pre-earnings IV elevation followed by a post-earnings crush. Traders bid up near-term volatility as the report approaches, then that volatility collapses once the uncertainty resolves. For the current cycle, the original analysis expects IV to climb from around 34% to roughly 40% in the weeks before the release, implying an earnings move of about 22 to 23 points from a $223 to $225 base.
Earnings do not automatically reward option buyers. The implied-versus-historical comparison, and the crush that follows resolution, are what separate a trader with a thesis from one who simply bought cheap options and hoped.
Volatility crush, where near-term IV collapses the moment an earnings result resolves uncertainty, is the single biggest structural threat to any premium-buying position held through the report: the stock can move in the predicted direction and the option can still lose value if the actual move falls short of what IV had priced in.
How probability-weighted price targets work in options analysis
A price target like $245 sounds like a straightforward bullish call. Beneath it sits a probability framework that most retail analysis gets wrong, and getting it right changes how you evaluate the target entirely.
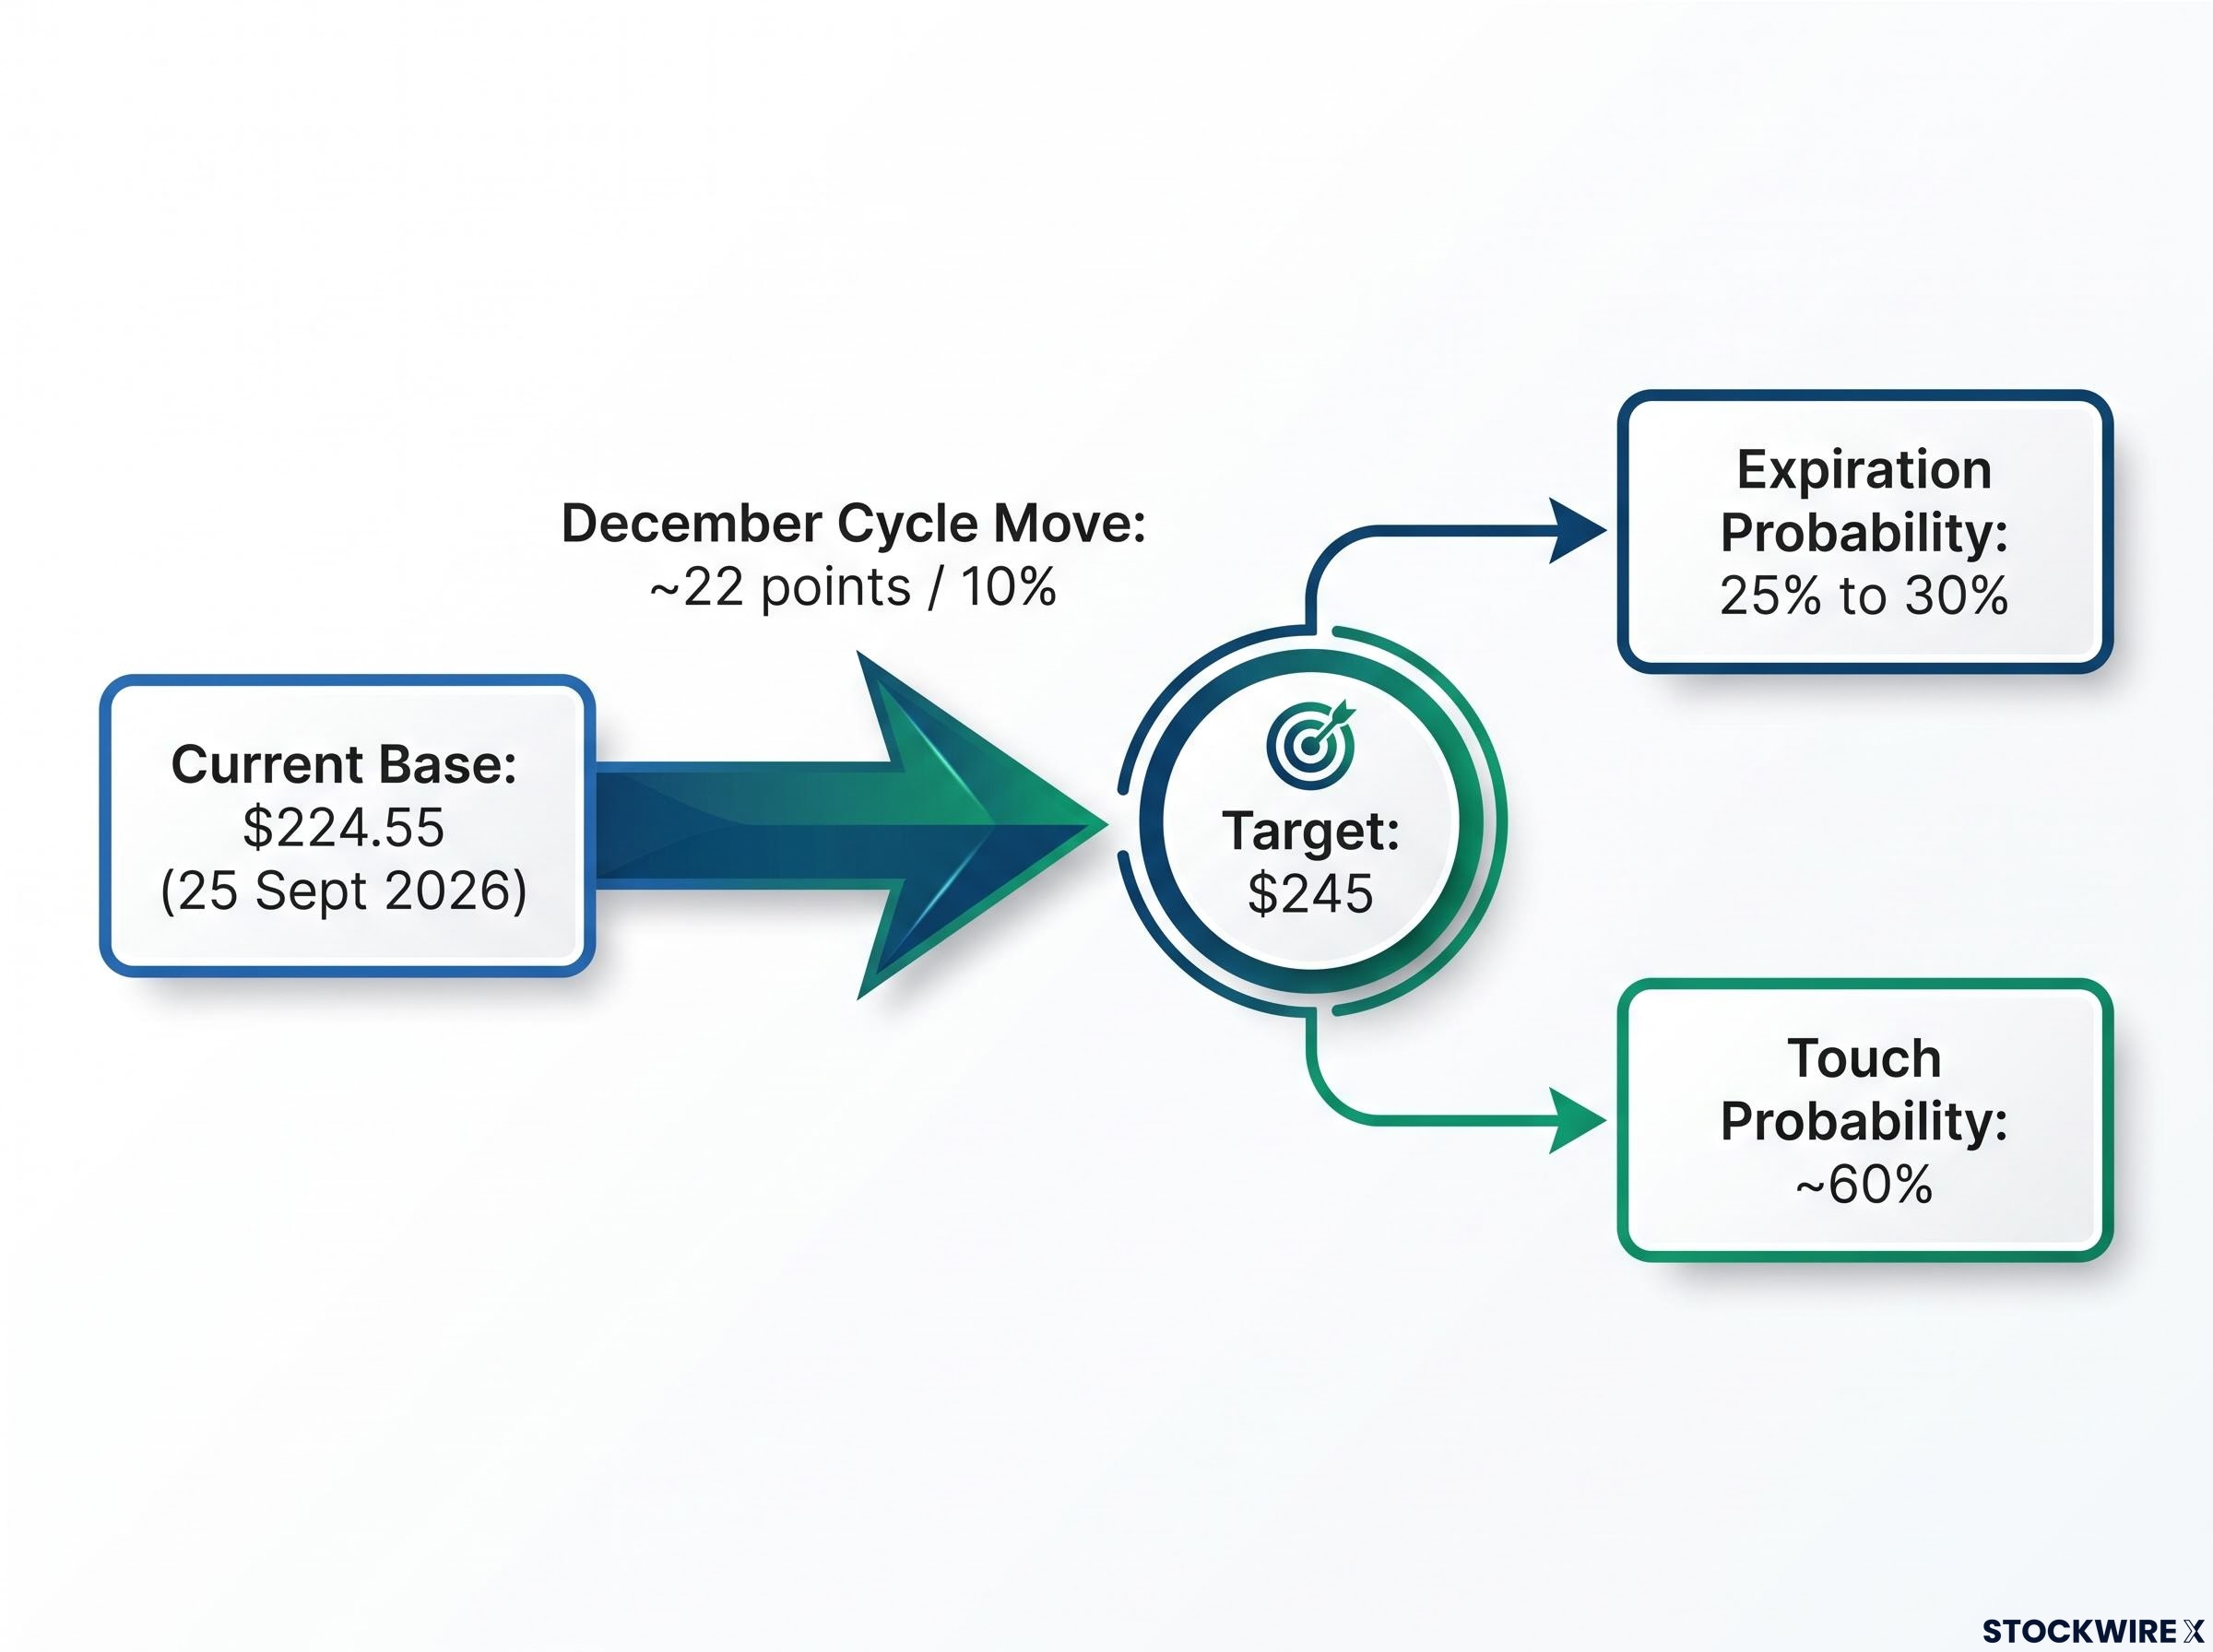
Two probability figures attach to that $245 level, and they answer two different questions. There is the probability that a call finishes in-the-money at expiration, and there is the probability that the stock touches $245 at any point during the cycle. These are not competing numbers. They are two outputs of the same framework.
Here is how the framework runs as a two-step sequence:
- Establish the expiration probability directly from the options chain. For a $245 call in the December cycle, the estimated probability of finishing in-the-money at expiry is 25% to 30%.
- Derive the touch probability using a common approximation: for out-of-the-money options, roughly double the expiration probability. That gives an estimated 60% chance the stock touches $245 at some point during the December cycle.
The doubling convention is useful precisely because it is quick, but it is an approximation, not an exact calculation. A stock can trade through a level and fall back well before expiry, which is exactly why the touch figure runs so much higher than the expiration figure.
Applying the framework to the December cycle
Put the specific numbers together. With Nvidia at $224.55 (Zacks BATS, 25 September 2026), reaching $245 requires a move of roughly 22 points, about 10% above the current level. That move carries a 25% to 30% expiration probability and a roughly 60% touch probability.
What this means for you personally is a matter of picking the right number for the decision. A 60% touch probability sounds compelling, but if your structure needs the option to finish in-the-money, the 25% to 30% figure is the one that governs your outcome. Conflating the two is one of the most common errors in retail options analysis, and it leads to very different calls on strike selection and position sizing.
To make a long $245 call attractive despite the 25% to 30% expiration odds, you would need a specific conviction that the November earnings move will exceed the muted expectation the market is pricing. There is scale context worth holding here too: a 10% move translates to roughly half a trillion dollars of market-cap change, pushing Nvidia toward that $6 trillion threshold.
What low IV rank actually costs the long-premium buyer
Cheap options are genuinely attractive in absolute dollar terms. That much is true, and it is why a 2.7% IV Rank draws buyers in. But cheap does not mean low risk, and the structural reasons are worth laying out plainly.
For a long-premium buyer in a low-IV-rank environment, five risks sit in the way:
- Movement risk, because the stock must beat a muted implied expectation, with the August cycle implying just 5.4% against a 7.4% historical average.
- Directional overconfidence, because low prices tempt oversized positions and disguise the fact that low IV reflects a consensus of lower near-term uncertainty.
- Theta decay, because time value erodes during any slow pre-earnings drift even when your directional view eventually proves right.
- Diminished IV-expansion payoffs, because with IV Rank already near the floor there is limited room for volatility to expand further and reward you.
- Structure selection as the primary lever, because in this regime the shape of the trade matters more than the direction.
The dollar-value reality cuts against the “muted” framing. As Investing.com noted, that 5.4% implied move still corresponded to a $280 billion market-cap swing. A small percentage in a stock this size is an enormous number.
Structure as the primary lever: what calendar spreads and debit spreads do differently
Saxo Bank’s May 2026 recommendation shows what structure selection can do. The trade was a calendar spread: sell the inflated event-week expiry at 85.24% IV, buy the 18 June monthly expiry at 45.20%, and harvest the IV differential rather than betting on direction.
Calendar spreads exploit the IV differential between expiries rather than betting on direction: selling an inflated front-month contract while buying a longer-dated one harvests the gap between event-week and post-event implied volatility, which is exactly the structure Saxo Bank applied to Nvidia’s May 2026 cycle.
An outright long call or a debit spread works differently. It requires both directional accuracy and either an IV expansion or at least a neutral IV outcome to deliver its full payoff. When IV Rank sits at 2.7%, there is little room for that expansion, which makes the calendar structure especially relevant.
That leaves the interpretive question, and the sources genuinely disagree. CNBC, on 22 September 2026, framed Nvidia’s IV near its lowest level of the past year as rational pricing of a stable, well-understood backdrop. Investing.com flagged the $280 billion swing as evidence that even a muted implied move is enormous in dollar terms. The original analysis raised the complacency question head-on.
Nvidia is the largest weighting in the most concentrated market since 1999.
That framing matters because it turns the question from a single-stock debate into a systemic one. What this means for you personally is that deciding whether low IV reflects rational calm or underpriced tail risk is not an abstract exercise. It is the actual trade decision, and you should make that call explicitly rather than default into it by buying whatever looks cheap.
Reading the setup clearly before the November catalyst
Pull the four layers together and the Nvidia setup becomes a decision-point rather than a simple buy-or-pass. The measurement tools tell you options are near their annual floor. The earnings dynamics tell you that calm is temporary, with a consensus window of 16 to 21 November 2026. The probability mechanics tell you a $245 target is a 25% to 30% proposition at expiry. And the risk structure tells you the shape of the trade matters more than the direction.
The implied versus historical move comparison is a calibration reference rather than a precise forecast: the premium baked into implied figures reflects compensation for jump risk and correlation spikes, not systematic mispricing, and that premium can invert sharply when a catalyst produces realised moves that dwarf what any options chain had priced.
Before entering, three questions demand explicit answers:
- Is the current low IV rational pricing of reduced uncertainty, or complacency about tail risk?
- Do you expect the November earnings move to exceed the implied expectation, given the 5.4% implied versus 7.4% historical gap seen in August?
- Which structure best matches your answers to the first two questions?
There is one more layer to hold. Nvidia is both a single-stock trade and a market proxy, sitting, as the original analysis put it, in the middle of its price range with a very large market capitalisation. Anyone taking a long position into November is also, in effect, betting on broad AI and index sentiment, and a 10% move toward that $6 trillion mark carries weight well beyond the options payoff itself.
The tools covered here, IV Rank, IVX, implied versus historical move, touch versus expiration probability, and structure selection, are the specific inputs to that decision. What you take away is a repeatable framework, not a view on one stock in one month.
This article is for informational purposes only and should not be considered financial advice. Investors should conduct their own research and consult with financial professionals before making investment decisions.
Past performance does not guarantee future results. Financial projections and probability estimates are subject to market conditions and various risk factors, and these forward-looking figures are speculative and subject to change based on market developments and company performance.