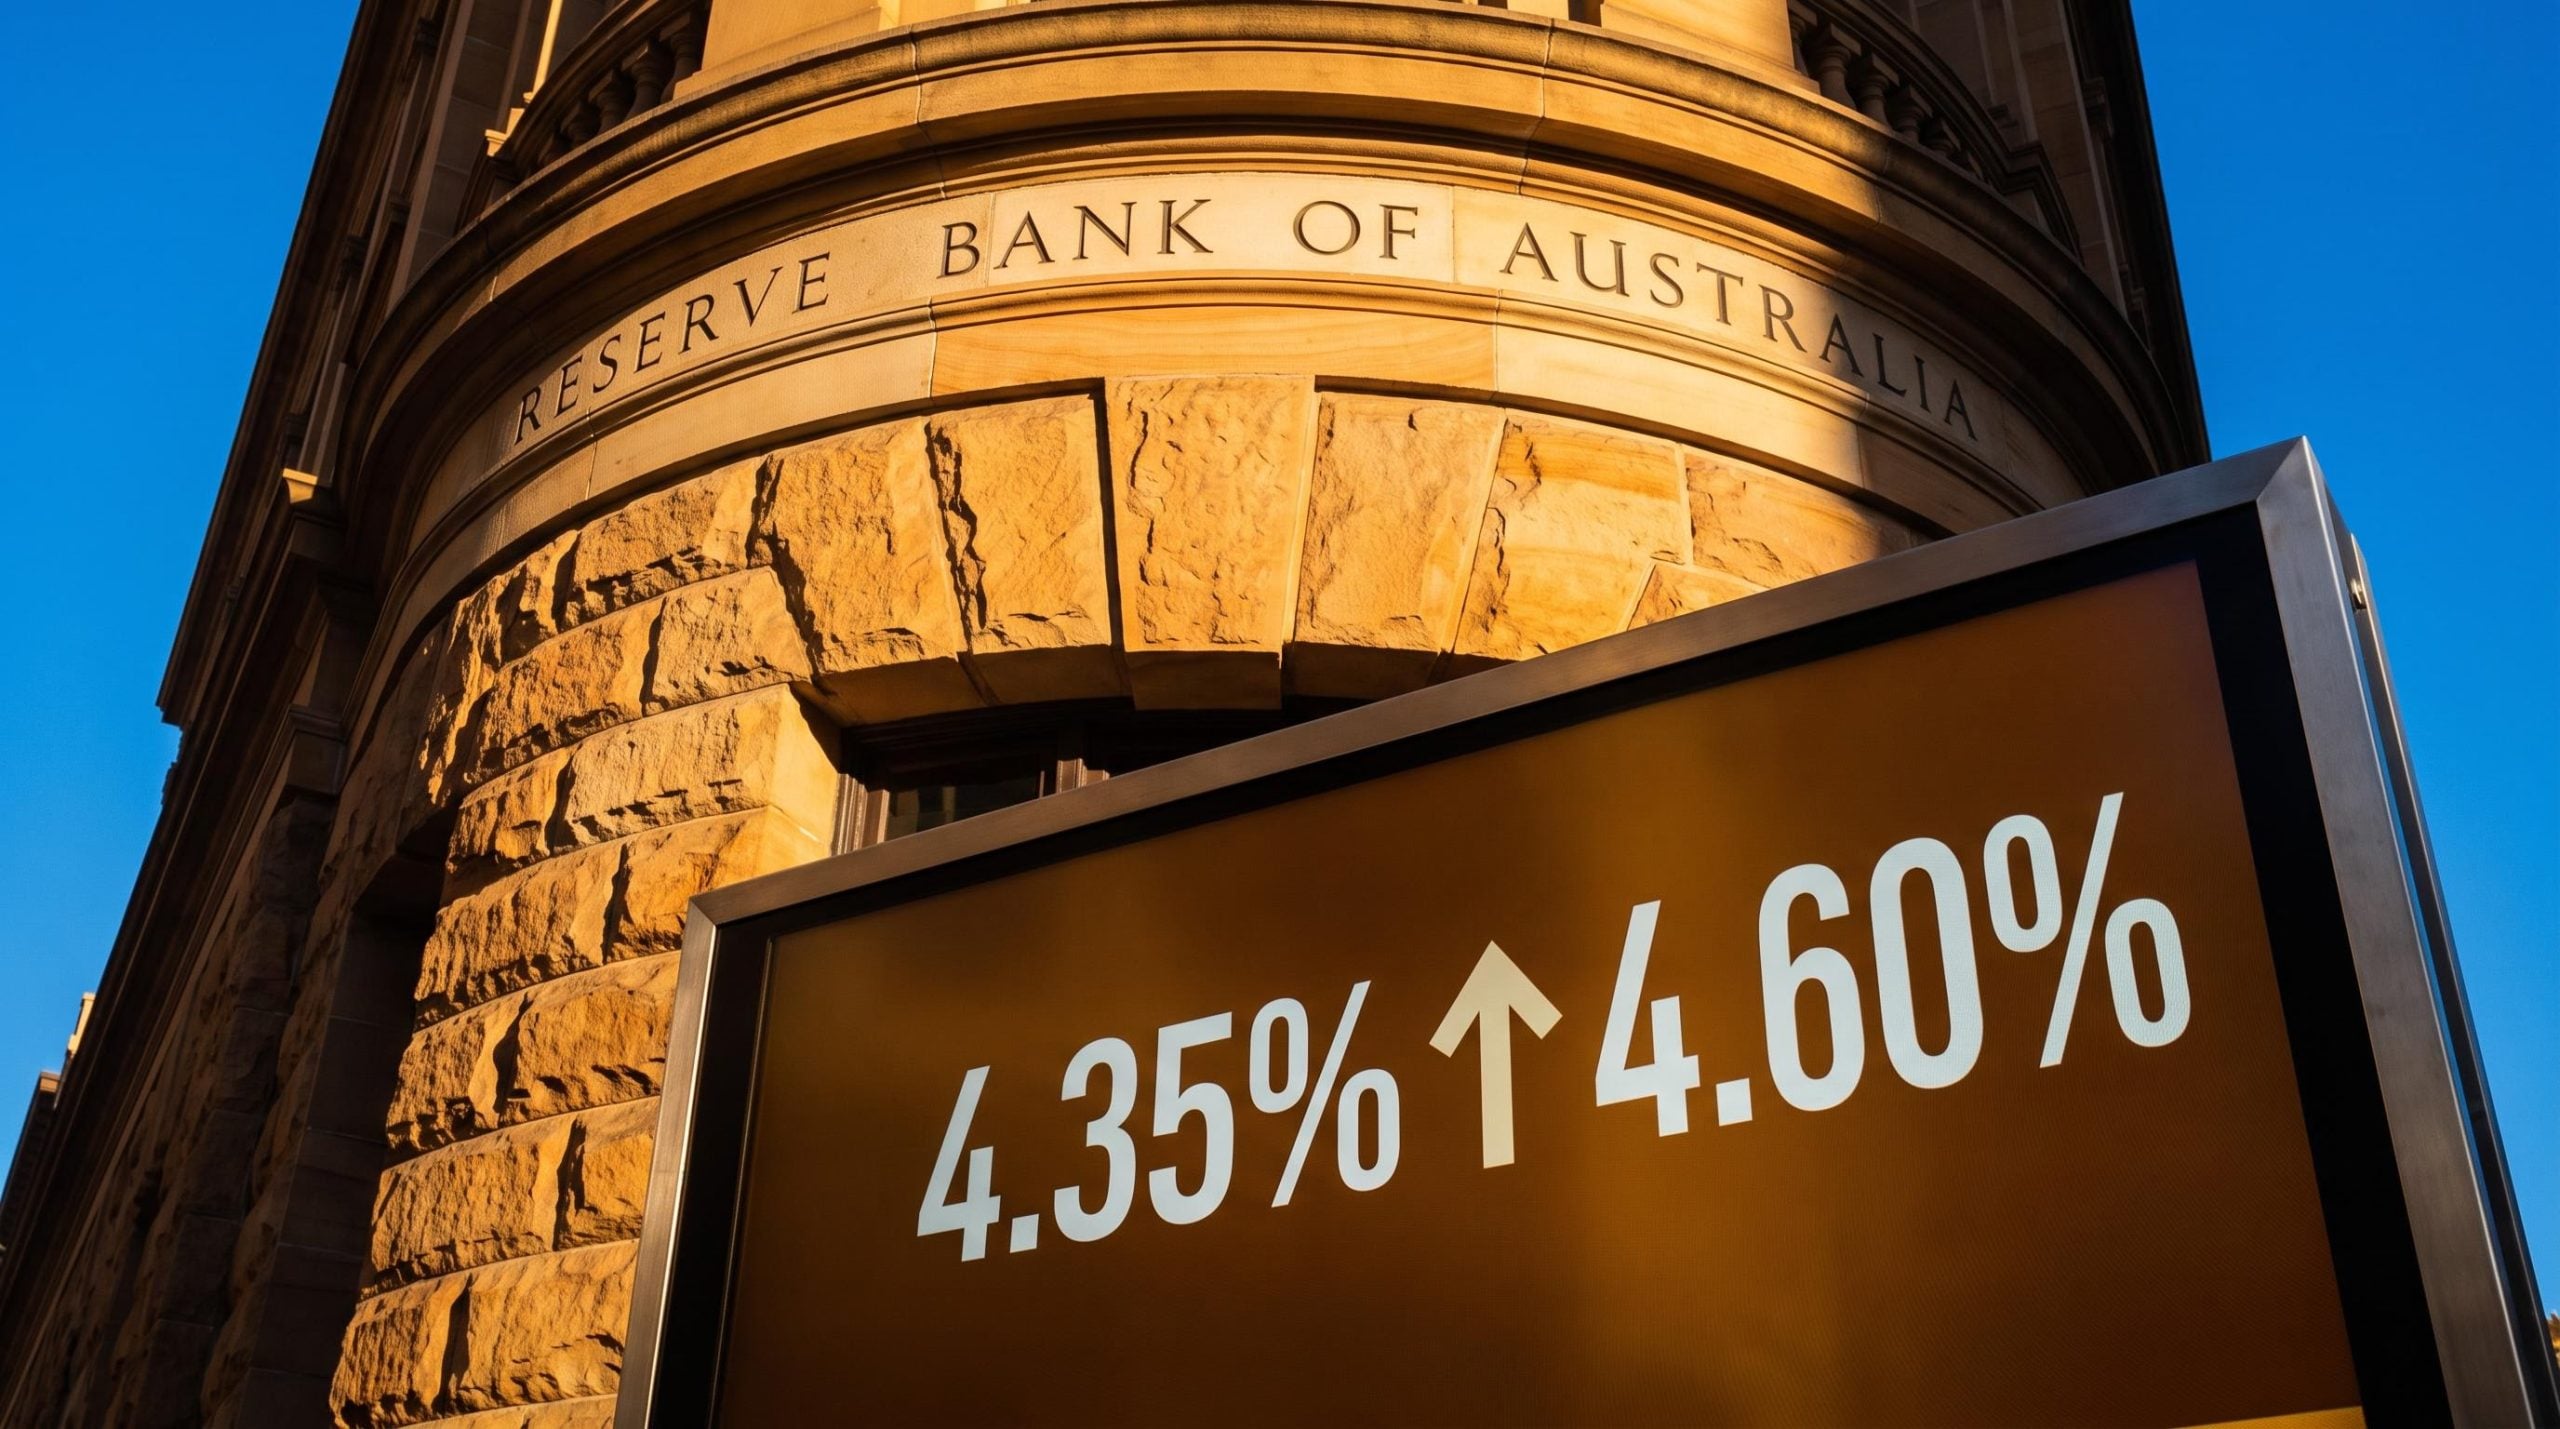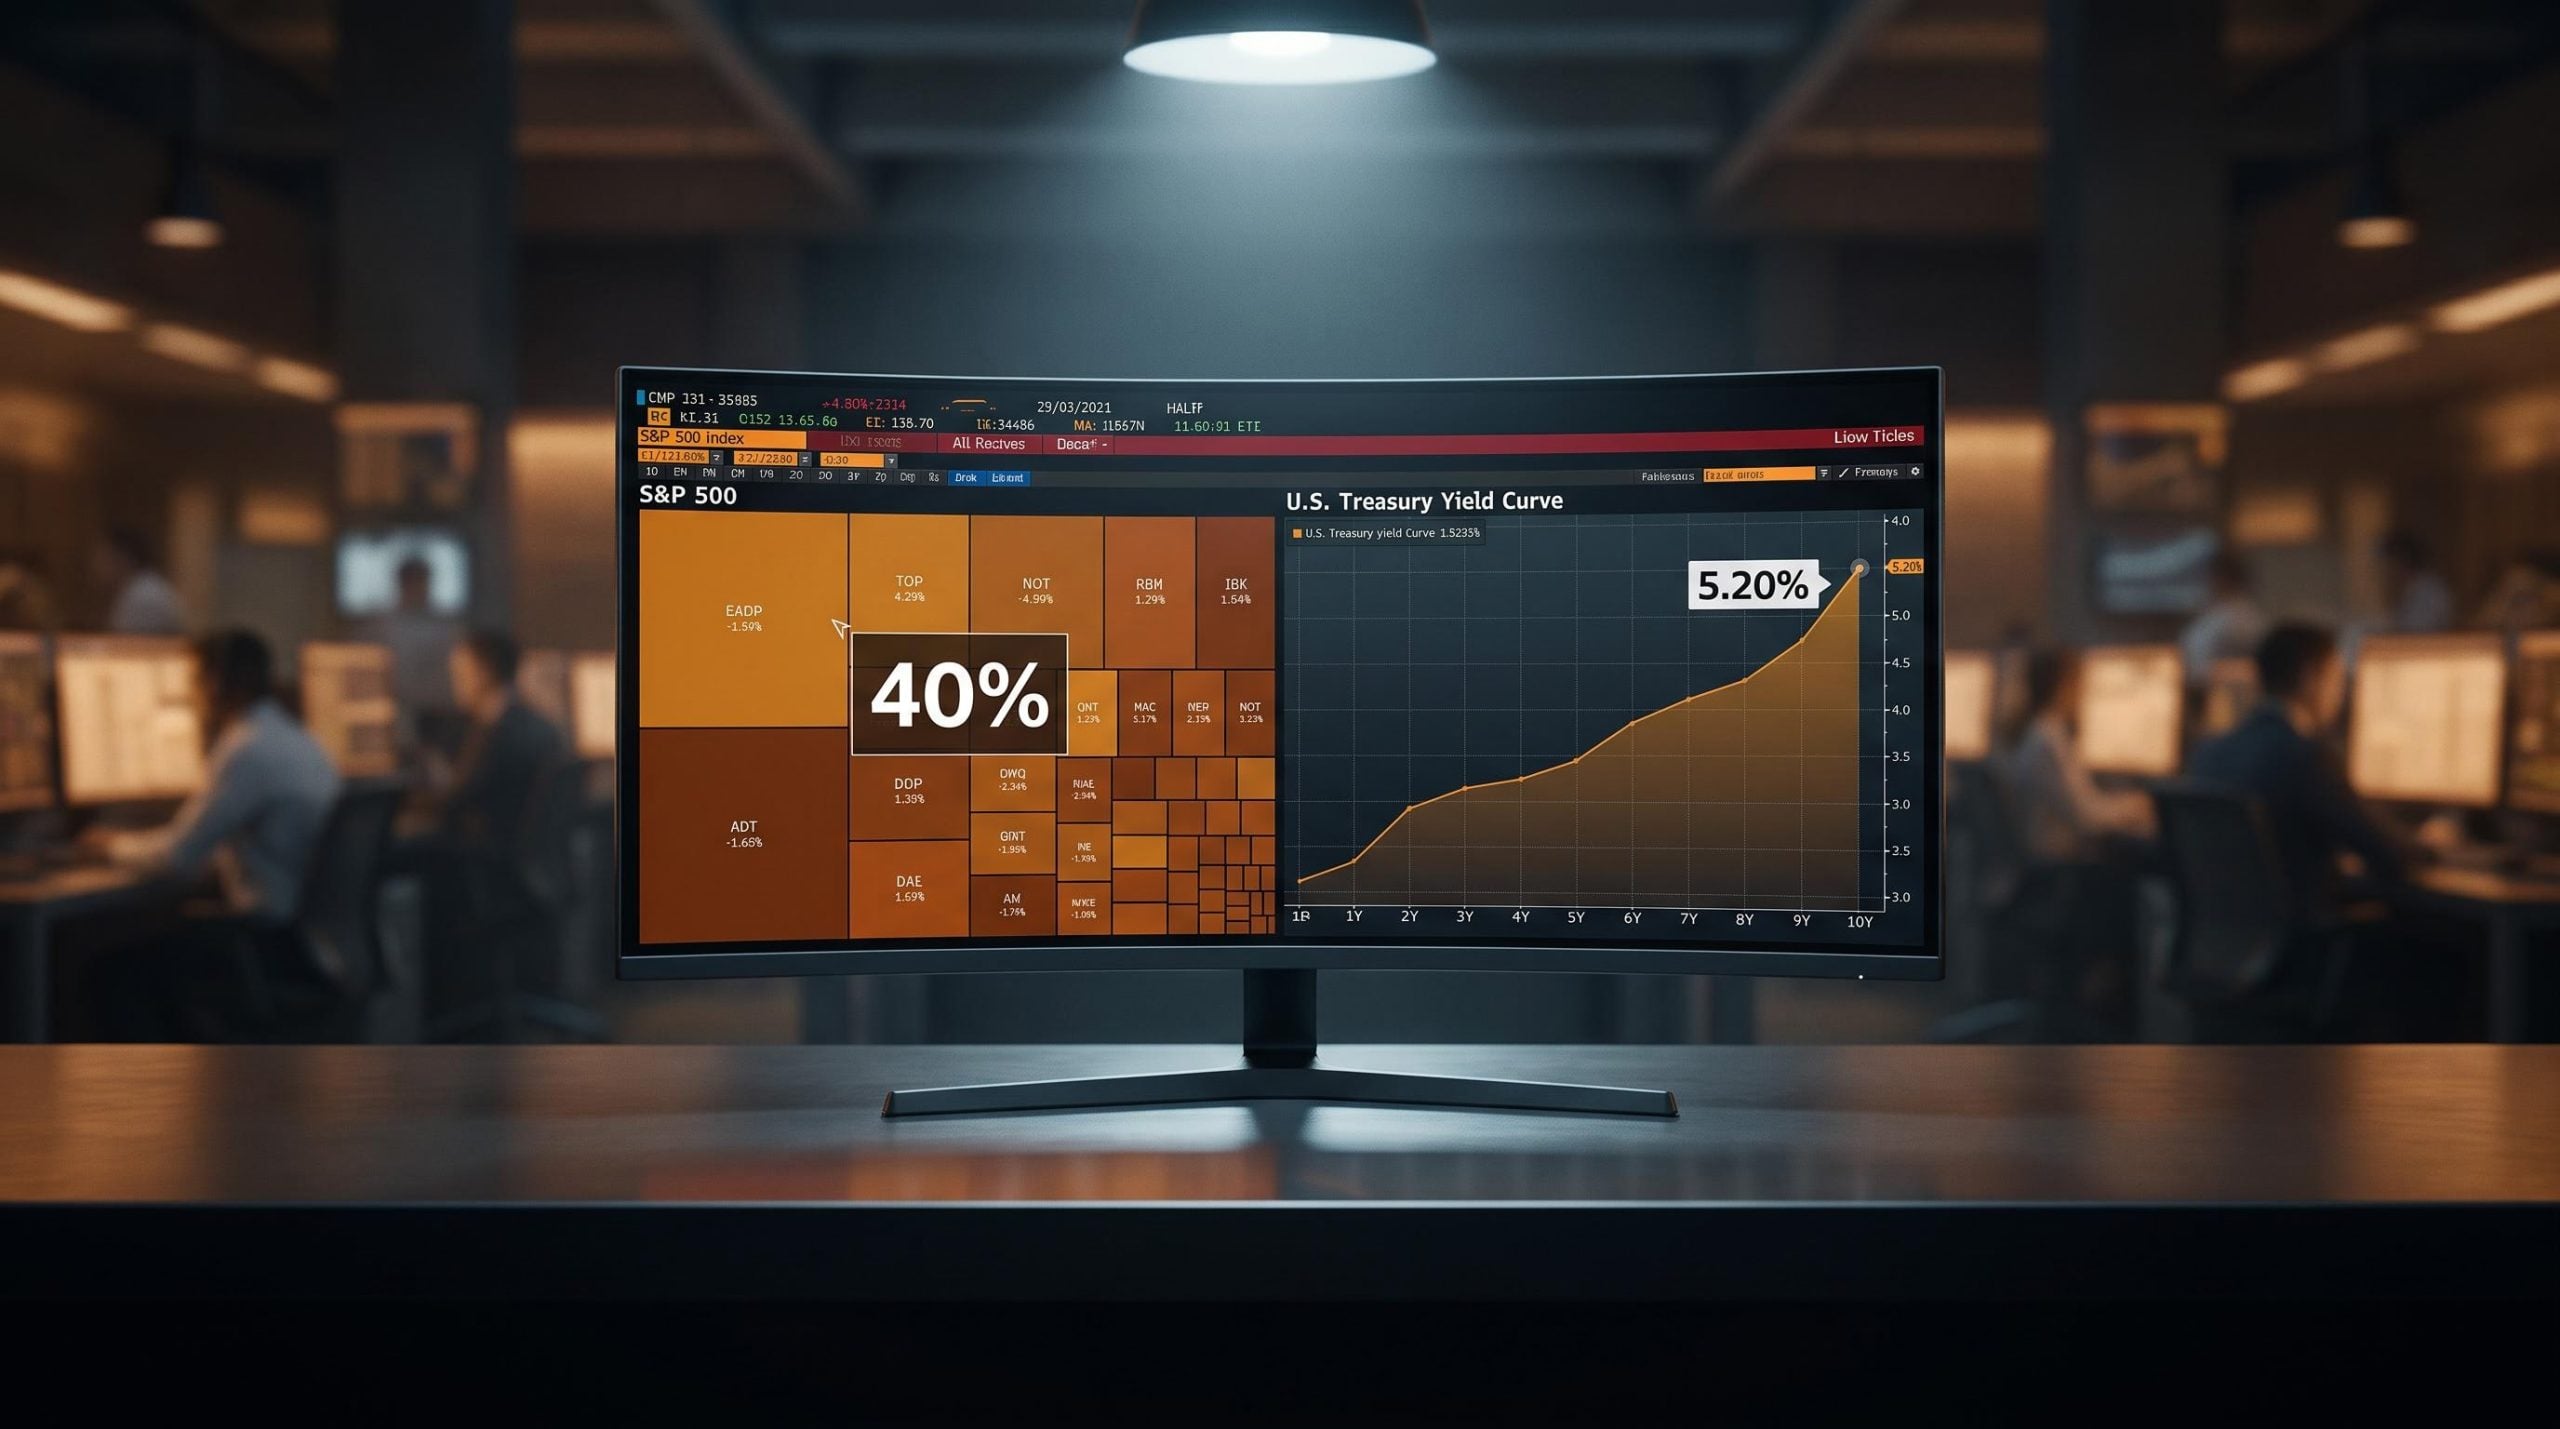
Two numbers sit in the market right now that have not shared the same room since the mid-2000s. The top ten stocks in the S&P 500 command roughly 40% of the entire index by value, while the 10-year Treasury yield closed at approximately 5.20% on 24 September 2026, its highest reading since 2007.
Equity markets are priced as though a small cluster of AI and platform giants have grown so dominant that concentration risk barely registers. The bond market is simultaneously pricing for a “higher for longer” rate regime, the kind of setup that has repeatedly preceded major valuation corrections. Both readings cannot be fully correct.
Serious analysts disagree on which signal to trust, and the disagreement is not lazy. One camp reads the concentration as a fragility waiting for a trigger. The other reads it as a structural feature that high rates may actually reinforce.
What follows below breaks the tension into its parts: what the concentration data actually shows, how these episodes have ended historically, the mechanical channel through which yields press on growth valuations, and the strongest case for why the mega-caps may not crack this time. After reading, you will have an evidence-based framework for forming your own view on current market risk, not a verdict handed to you.
How concentrated is the S&P 500, and is that unprecedented?
Start with the headline figure. According to VanEck research published in July 2026, the top ten S&P 500 stocks accounted for approximately 40% of total index market value as of 31 May 2026. That is nearly double their share from a decade ago.
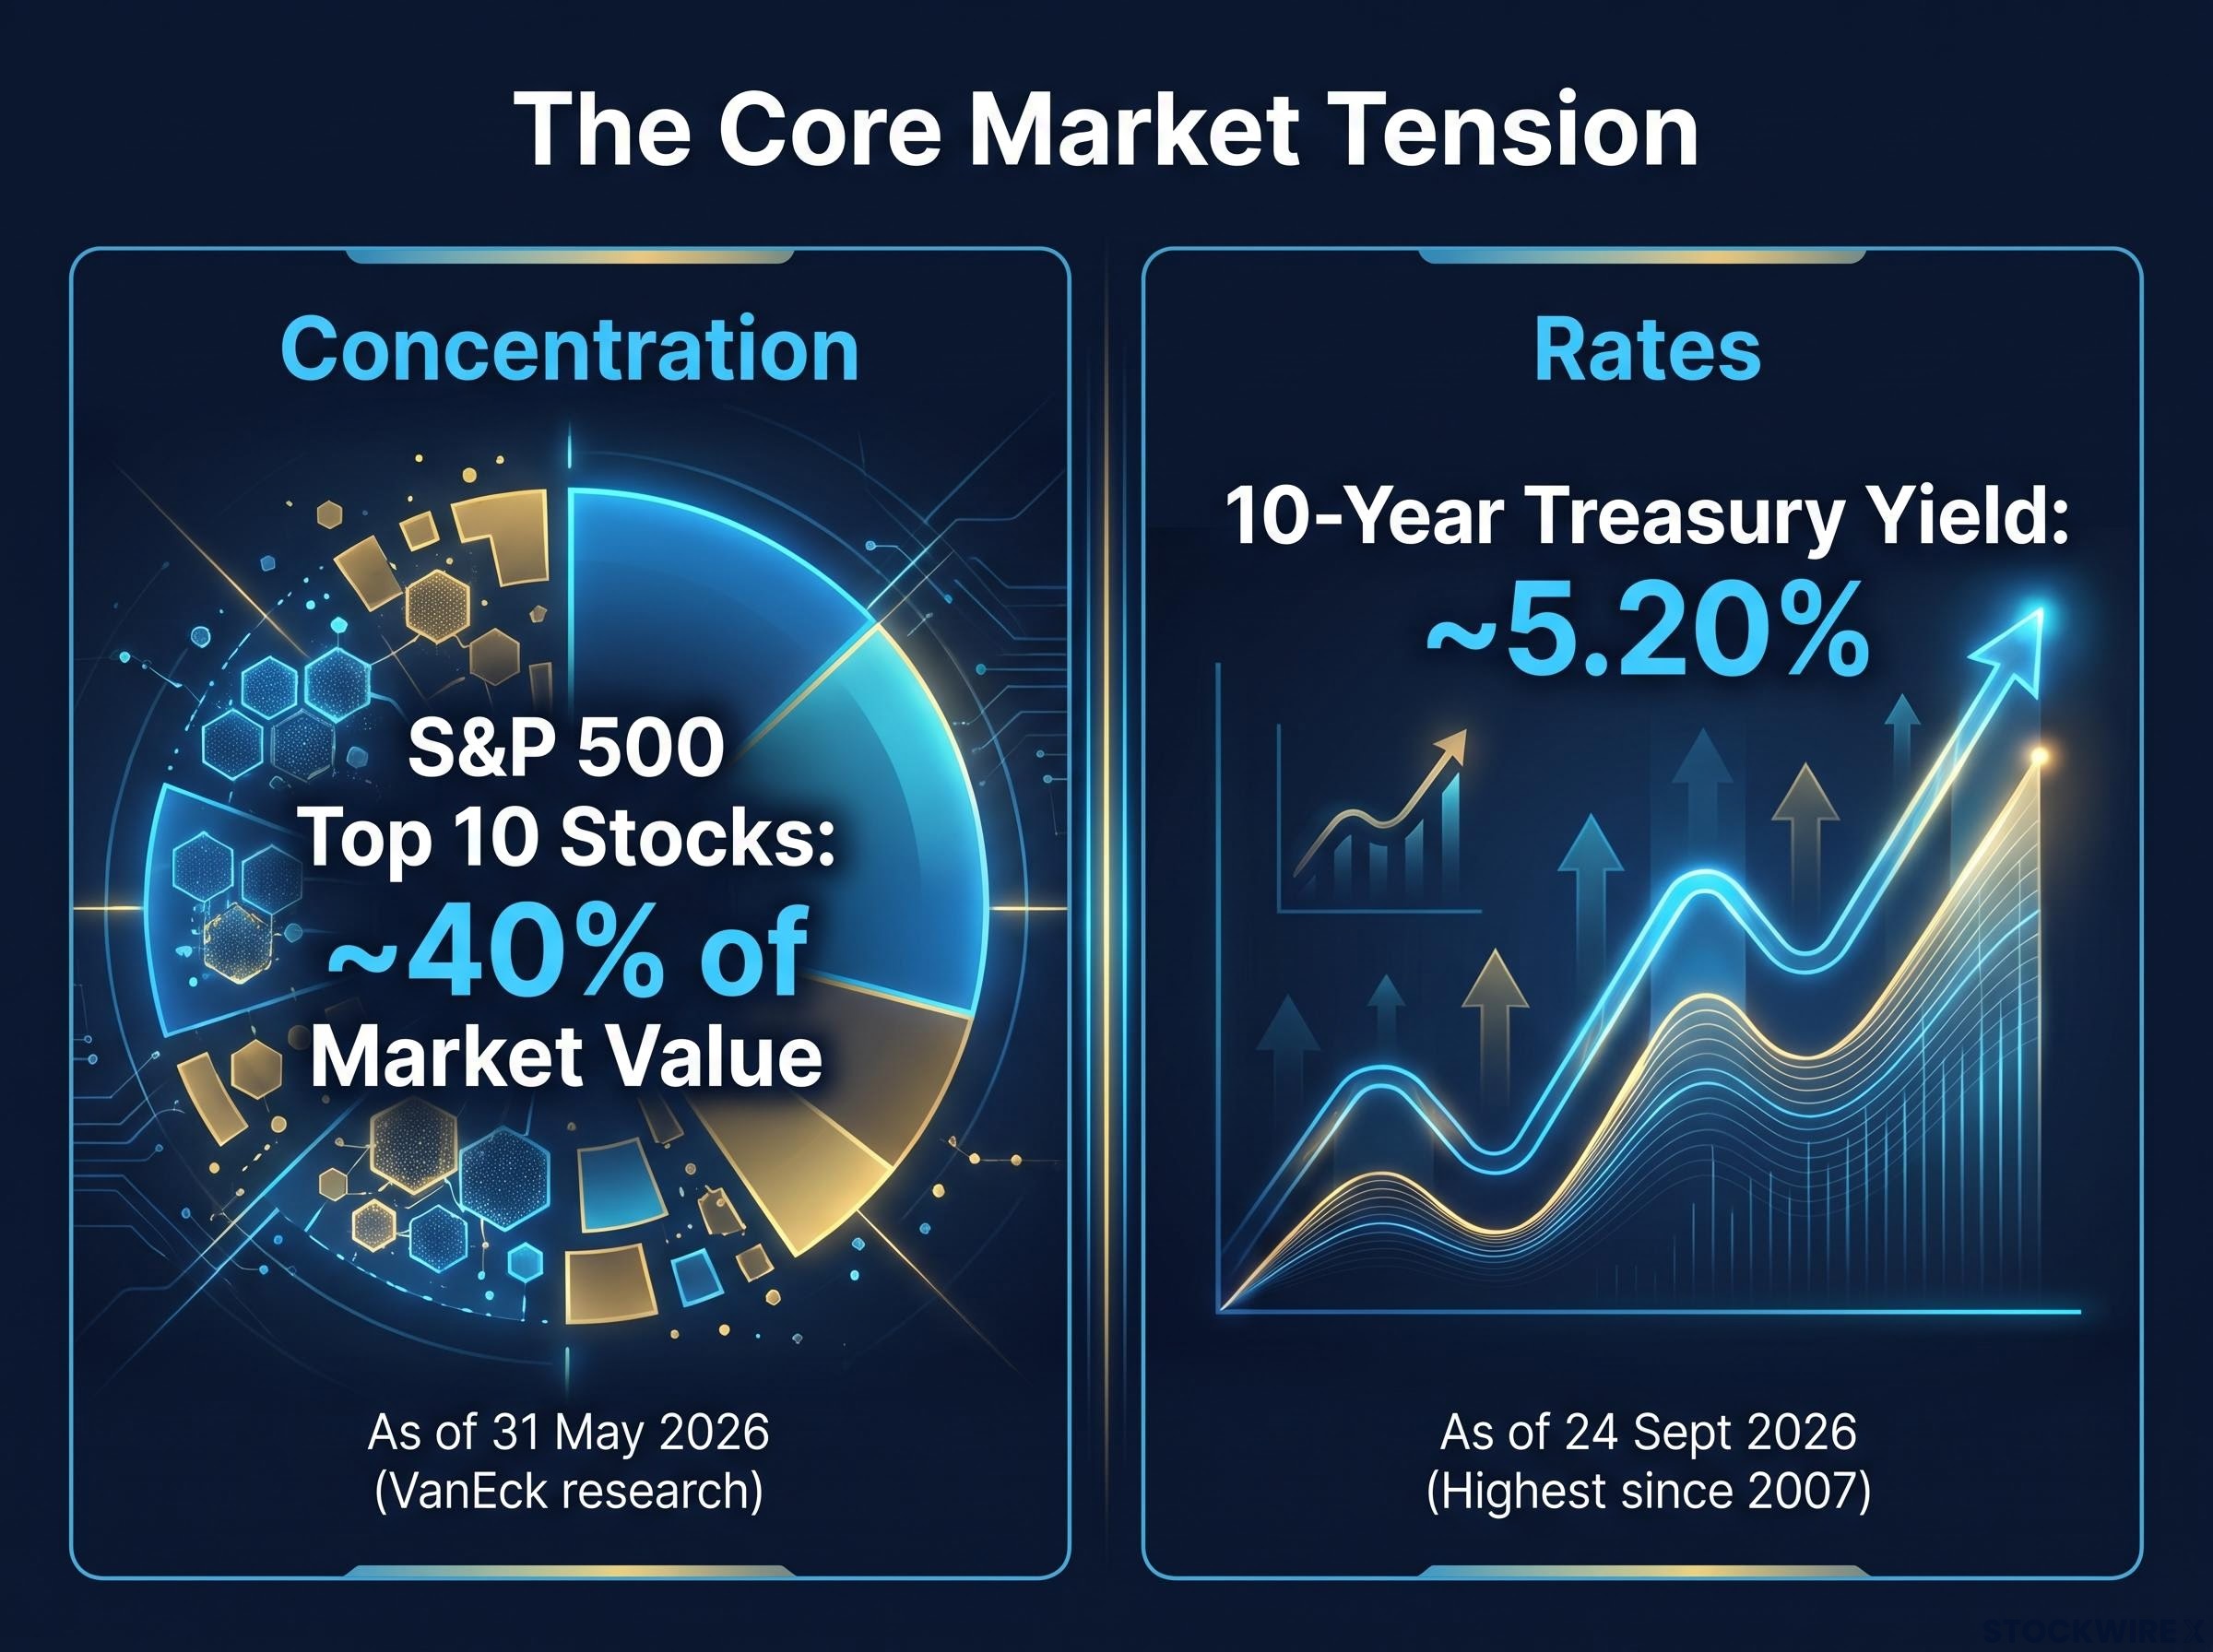
The composition tells you what you are actually holding. Those ten names span AI infrastructure and platform companies: the seven largest tech giants alongside Broadcom, AMD, and Micron.
The scale in plain terms Roughly 40 cents of every dollar invested in the S&P 500 now sits in ten AI and platform names.
There is one detail that stops this from being a simple bubble story. VanEck notes that these same top-ten firms contribute a proportionately large share of total S&P 500 earnings and earnings growth, not just market capitalisation. That matters because it means the concentration is not purely a valuation artefact. A flat “this is a bubble” call and a flat “this is structurally justified” dismissal both skip over something real.
For any US investor with broad index exposure, this is the starting point for an honest risk read. A standard retirement or brokerage portfolio built on a market-cap-weighted index fund is, functionally, a concentrated bet on about a dozen AI and platform names, whether or not that was ever the intention.
Passive indexer exposure to this top-heavy structure runs deeper than most portfolio statements reveal: Morgan Stanley estimates passive investors collectively hold approximately 50% of S&P 500 weight via ETFs, meaning the concentration is not a discretionary tilt but a default condition baked into the most common retirement savings vehicle.
Where today’s concentration sits in the historical record
The rarity comes into focus against the long record, which Bank of America has tracked back to the railroad era.
The railroad bubble of the 19th century is one of only two episodes ever to exceed current US levels. Japan in 1989 is the other, and remains the most extreme concentration reading in modern market history. The dot-com peak in 1999, by contrast, recorded tech-sector concentration of around 33%, which the present roughly 40% top-ten weight now exceeds under comparable definitions.
What makes the current picture historically unusual is not the concentration alone. It is that concentration above the dot-com peak is occurring alongside rate conditions comparable to or exceeding 2007, a combination the historical record rarely shows.
| Historical episode | Approximate peak concentration | Rate environment at peak | Outcome |
|---|---|---|---|
| Dot-com 1999 | ≈33% (tech sector) | Elevated, tightening | Prolonged, severe drawdown |
| Japan 1989 | Highest in modern history | Shifting policy | Multi-decade underperformance |
| Railroad era | Above current US levels | Shifting borrowing costs | Bubble collapse |
| US September 2026 | ≈40% (top ten) | 10-year ≈5.20%, highest since 2007 | Unresolved |
When big ASX news breaks, our subscribers know first
What rising Treasury yields mean for overweight growth positions
If concentration is the position, yields are the pressure on it. The mechanics run through four channels, and they accumulate.
- The discount rate channel. Long-duration growth stocks hold most of their value in cash flows expected years into the future. A higher risk-free rate compresses the present value of those distant cash flows more sharply than for mature, high-dividend sectors. A 10-year sustained above 5% therefore weighs hardest on exactly the names that dominate the index.
- Competition from risk-free yield. At 5%+ on Treasuries, an investor can secure a high return without taking equity risk at all. That raises the hurdle rate for stocks, and the high price-to-earnings index leaders face the most direct competition for capital.
- Credit conditions and funding costs. Expensive capital squeezes smaller, levered, and unprofitable firms hardest. That can narrow market breadth further, or, if growth slows sharply, pull cyclical earnings estimates down faster than defensive mega-cap estimates.
- Volatility and deleveraging. Elevated yields tend to travel with macro uncertainty. Rising volatility can trigger risk-parity and multi-asset strategies to rebalance away from high-beta tech, and the selling tends to hit the largest, most liquid names first.
NBER research on interest rates and equity valuations provides a formal theoretical basis for the discount-rate channel, finding that long-term shifts in the rate environment explain a substantial portion of the variation in aggregate equity price-to-earnings multiples, precisely the mechanism at work when yields move from near-zero to above 5%.
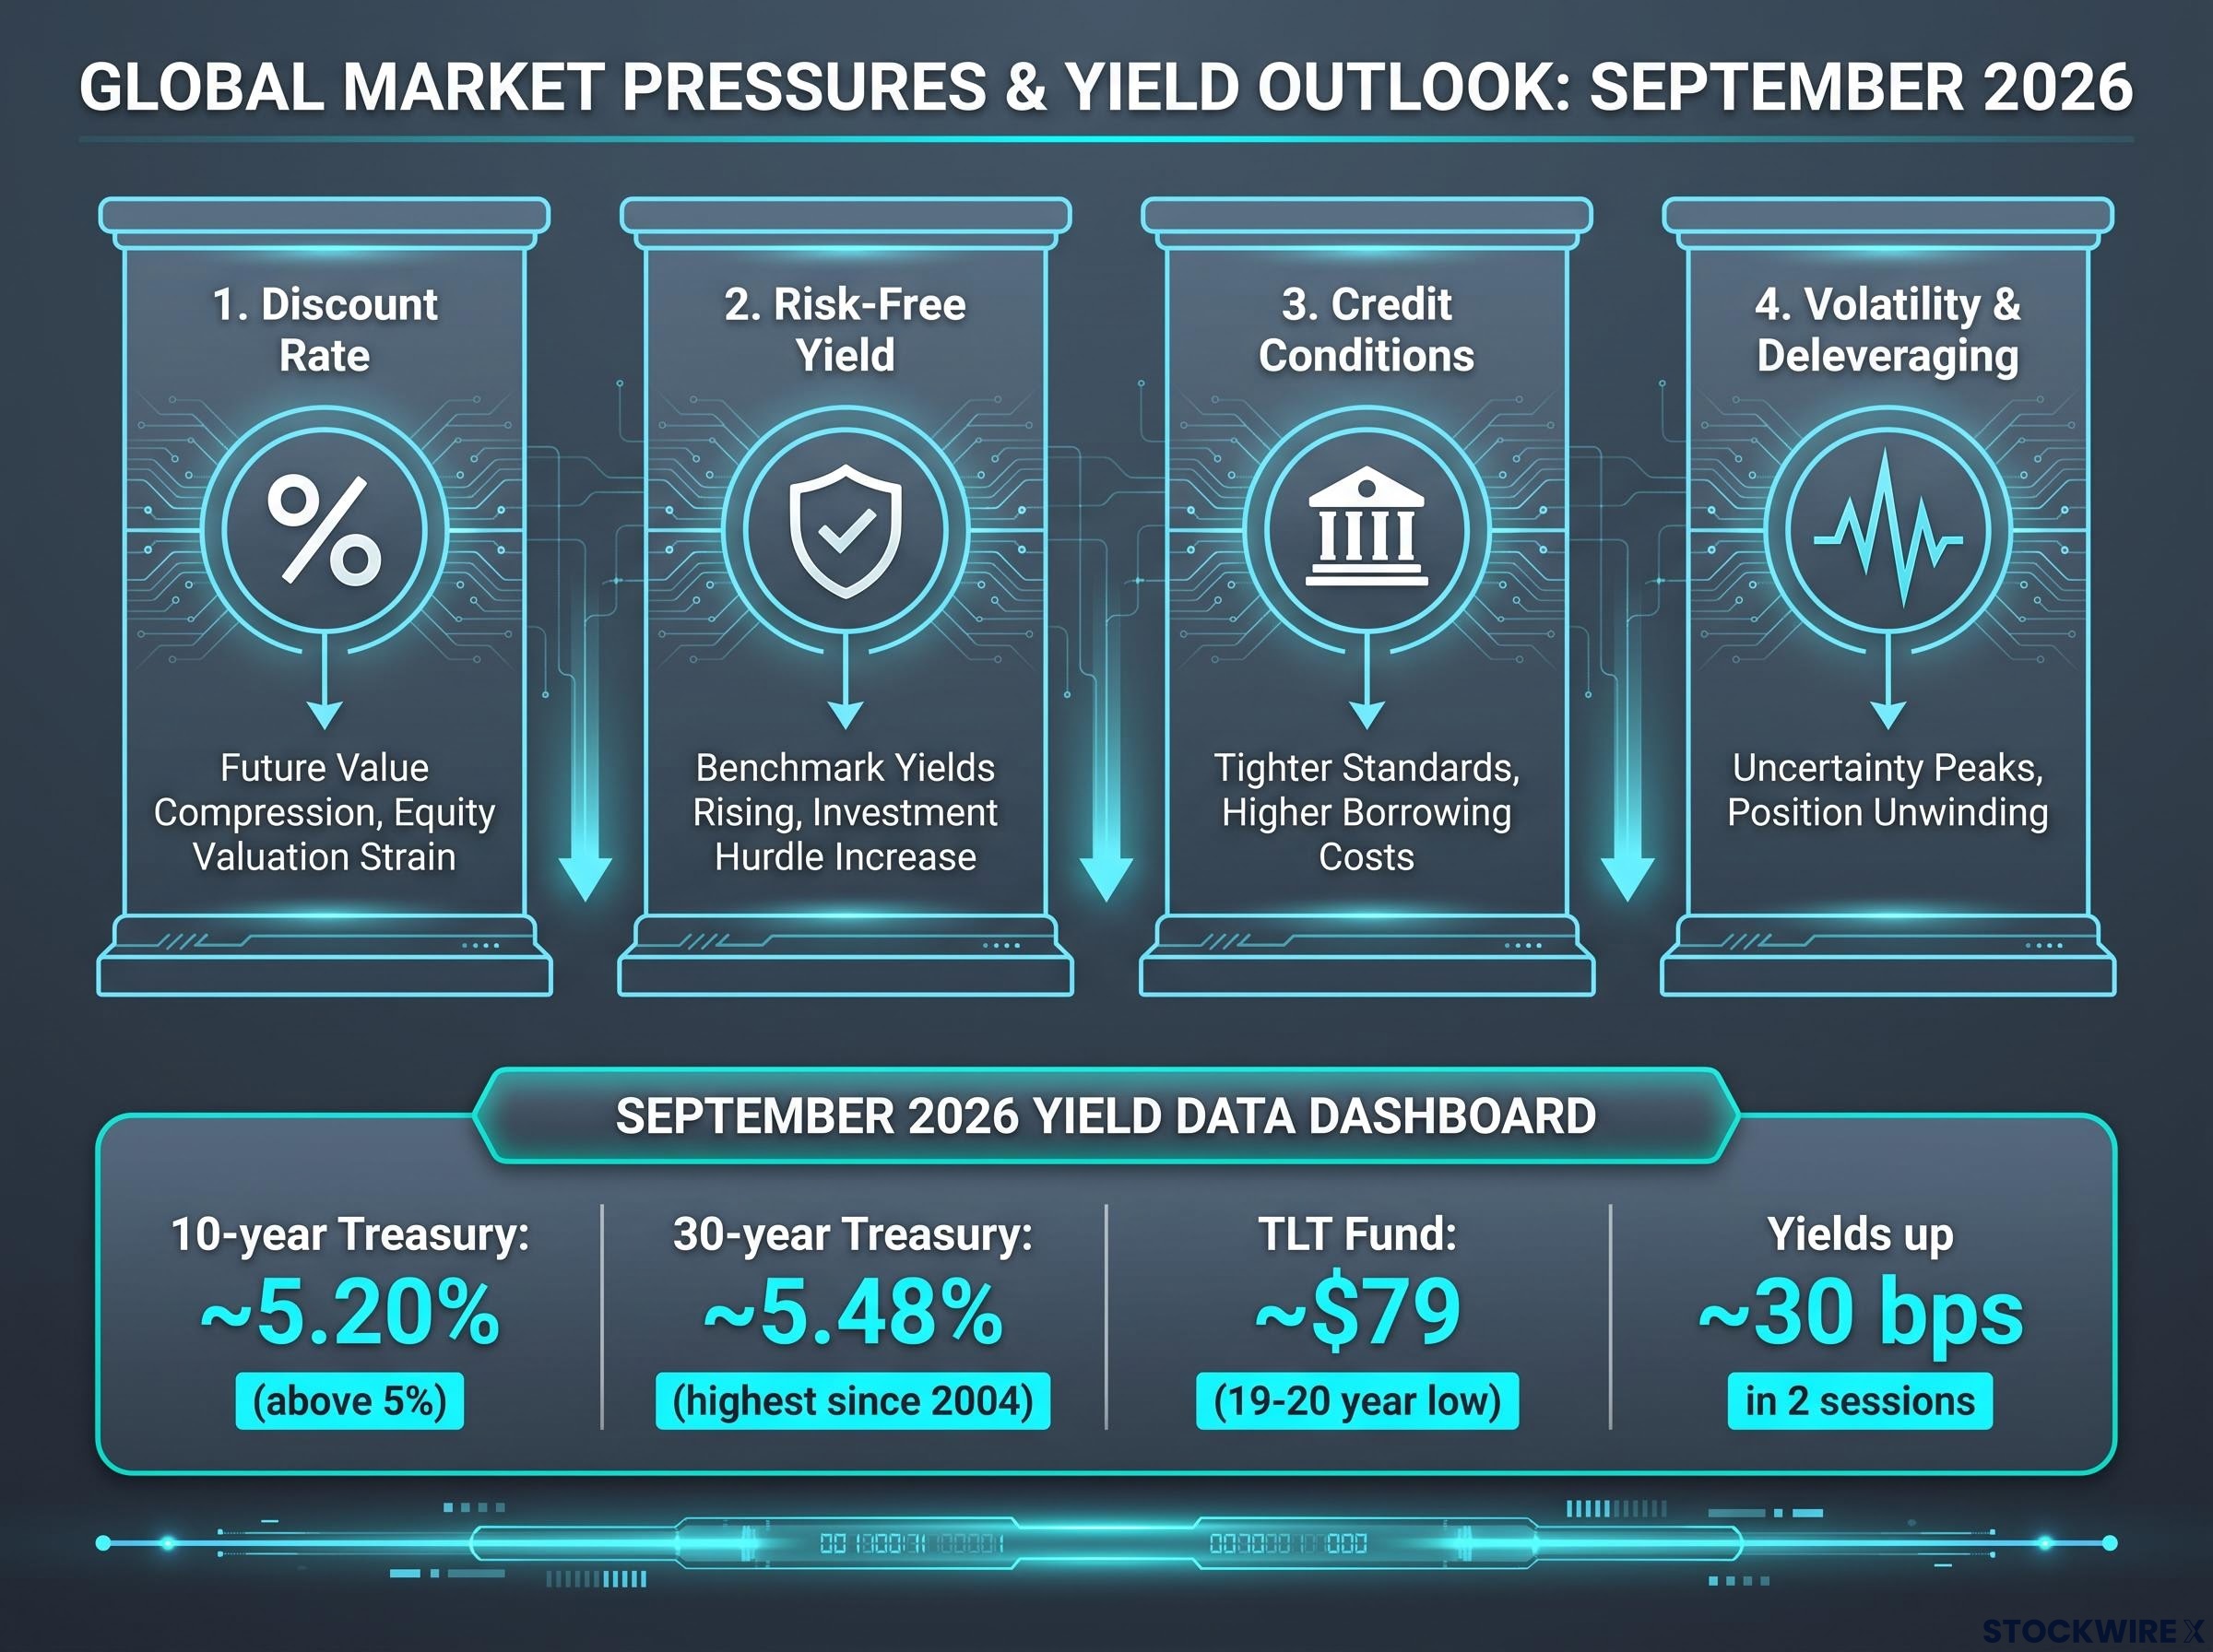
The current numbers put real weight behind the framework. Reuters reported the 10-year at approximately 5.20% and the 30-year at approximately 5.48% on 24 September 2026, the latter its highest since 2004. The TLT long-Treasury bond fund has fallen to around $79, a roughly 19 to 20 year low.
The move itself is the tell. Yields rose about 30 basis points across two sessions, and that speed matters more than the level alone. It signals a bond market still repricing rather than settling, and that kind of sustained valuation uncertainty is the sort that tends to precede equity multiple compression, not the sharp but recoverable shock markets digest and move past.
The Treasury yield surge itself carries diagnostic weight beyond the absolute level: a $70 billion five-year auction produced the second-largest tail on record and a bid-to-cover ratio not seen since December 2018, signalling that demand is thinning precisely as supply expands.
The historical anchor Bank of America’s analysis of major market bubbles back to the railroad era finds a common thread: each one ended when the cost of borrowing shifted.
For an investor holding a market-cap-weighted index fund, none of this is abstract macro colour. Rising yields are a direct mechanical pressure on the valuations of the specific names that make up the largest slice of that portfolio.
What concentration actually looked like when it ended before
History does not repeat on a template, but three prior concentrations offer progressively more sobering lessons. Read in sequence, they erode the confidence behind most “this time is different” arguments.
The dot-com parallel and where it breaks
The 1999 concentration was built on a genuinely transformative technology narrative, and the narrative was correct. The internet did reshape the economy. Even so, a correct thesis did not spare investors from a severe and prolonged drawdown.
- The parallel: narrative-driven leadership, with passive flows and momentum reinforcing a narrow group of names, then as now.
- The caveat: many 1999 leaders were pre-profit and speculative, whereas today’s top-ten are profitable and cash-generative. That is the single most important structural difference in the mega-caps’ favour.
The dot-com concentration mechanics differed in one measurable way that matters for today’s comparison: the Nasdaq 100 forward P/E reached approximately 58x at the 2000 peak against roughly 25x today, and top-ten concentration of 47.8% in the Nasdaq 100 now actually exceeds the 27% recorded at the 1999-2000 S&P 500 peak.
The Nifty Fifty and the rate regime lesson
The early 1970s “one-decision” growth stocks were high-quality businesses trading at high multiples. Stagflation and tighter policy then re-rated them downward, even though many of the companies remained sound.
- The parallel: great companies can still be poor investments at the wrong entry multiple, which makes concentration risk as much about price paid as business quality.
- The caveat, and the sharper edge: the trigger was a rate regime change. The move today, from near-zero rates to 5%+ yields, is precisely that kind of shift, and it is already underway.
Japan 1989 as the extreme-case benchmark
Japan’s 1989 bubble is the most extreme concentration episode in modern market history, sustained for years by a structural narrative about Japanese corporate dominance, and followed by multi-decade underperformance.
- The parallel: structural narratives can hold concentration aloft well beyond what fundamentals justify.
- The caveat: US mega-caps are globally diversified, embedded in worldwide supply chains and platforms, and not analogous to Japan Inc. The lesson is not that the US is Japan, only that dominance narratives can run long.
The thread across all three is consistent. The unwinding was never driven by a sudden discovery that the technology or business quality was fraudulent. In each case, valuations and index weights overshot, and a shift in the rate or narrative environment was the catalyst. That is what to watch for now: not a revelation of failure, but a repricing of the premium that dominance was assumed to justify. The rate shift is already here.
The case that high rates entrench, not erode, mega-cap dominance
There is a serious argument that the same rate environment strengthens the incumbents rather than toppling them. It deserves to be heard at full strength.
Tom Lee’s core thesis Analyst Tom Lee argues that elevated rates may reinforce dominant technology firms, because financing remains accessible only to the cash-rich, while interest income on large cash reserves turns the rate environment itself into an earnings tailwind.
The entrenchment case rests on four supports:
- Access to financing: when capital is expensive, mega-caps can still fund investment while smaller rivals cannot.
- Interest income on cash: large cash reserves generate rising passive income as rates climb. Nvidia, with substantial capital expenditure capacity and sizeable reserves, is cited as an example.
- A widening competitive moat: with capital scarce, weaker challengers cannot fund long-term AI and cloud build-outs, narrowing the field of credible competitors.
- A quality-factor tailwind: research on the quality factor finds that high-return-on-equity, low-leverage firms tend to outperform when credit is tight and dispersion is high, a profile most mega-cap tech names fit.
Buybacks add an internal support. When funded from free cash flow rather than debt, they create a source of demand for the shares that partly offsets valuation pressure from rising rates.
The counterarguments carry equal weight:
- Discount-rate mechanics still apply: even a fortress balance sheet does not exempt an equity valuation from higher discount rates. A large upward move in yields should compress price-to-earnings multiples regardless.
- Fiscal-stress inflation risk: if high yields reflect fiscal strain rather than healthy growth, the real value of cash reserves erodes and input costs, including wages, can rise.
- Antitrust risk: persistent winner-takes-most dynamics attract regulatory scrutiny, a factor the entrenchment thesis tends to underweight.
- Diversification incentives: high rates can push investors to trim concentrated positions on risk-management grounds, independent of fundamentals.
The two theses are not mutually exclusive, and that is the point most easily missed. It is entirely possible for high rates to compress the whole index multiple while simultaneously widening the gap between the mega-caps and everyone else. In that scenario, the top ten outperform on a relative basis while still losing absolute value. For an investor weighing whether to rebalance out of a concentrated index position, this is the strongest honest case for staying, and it deserves to be set against the historical precedents rather than instead of them.
Reported figures suggesting institutional buying of roughly $4.1 billion weekly against an eight-week retail selling streak appear in market commentary without clear source attribution and are not independently confirmed. They are flagged here rather than relied upon.
What a concentrated market at 5% rates means for how you position now
None of this resolves cleanly. The evidence does not collapse into “bubble about to pop” or “mega-caps dominant indefinitely,” and any framework claiming otherwise is oversimplifying a genuine analytical tension.
The central tension Concentration sits at a historically extreme level, roughly 40% in the top ten, at the same moment yields sit at the kind of level, a 10-year near 5.20%, that history identifies as a common bubble trigger. Both extremes are present at once.
Three variables will determine which thesis prevails. Treat them as a watchlist:
- The trajectory of the 10-year yield from here. Sustained above 5% supports the pressure thesis. Reversion relieves it. The recent 30-basis-point two-day move suggests the market has not yet settled.
- The quality and breadth of AI-driven earnings in the upcoming reporting cycle. VanEck’s point that the top-ten carry the earnings, not just the market cap, holds only if the earnings keep coming and broaden.
- Whether flows keep absorbing concentration or begin rotating. Passive and institutional buying has so far absorbed the top-heavy structure. A shift toward active rotation would change the picture.
Here is the practical read. The concentration itself is not the risk. The risk is concentration at a historically extreme level combined with a rate environment that has repeatedly been the trigger for mean reversion. That makes position sizing and drawdown tolerance, not market timing, the operative levers.
What the evidence demands is not a timing call but a risk acknowledgment. If you hold a standard market-cap-weighted index fund, you are carrying more concentrated exposure than any conventional diversification framework was built to handle, and knowing that changes what a prudent portfolio looks like for you. The historical record says extreme concentration resolves eventually. The rate environment supplies a plausible catalyst. And the entrenchment thesis supplies a plausible reason for the resolution to take longer than traditional models would suggest.
For investors ready to convert this analysis into concrete portfolio adjustments, our dedicated guide to managing AI concentration risk walks through a five-strategy framework including position-sizing caps, layer diversification across chips, cloud, software, and applications, and a quarterly rebalance trigger designed for the kind of short-duration selloffs the current rate environment can produce.
This article is for informational purposes only and should not be considered financial advice. Investors should conduct their own research and consult with financial professionals before making investment decisions. Past performance does not guarantee future results, and these forward-looking assessments are speculative and subject to change based on market developments.