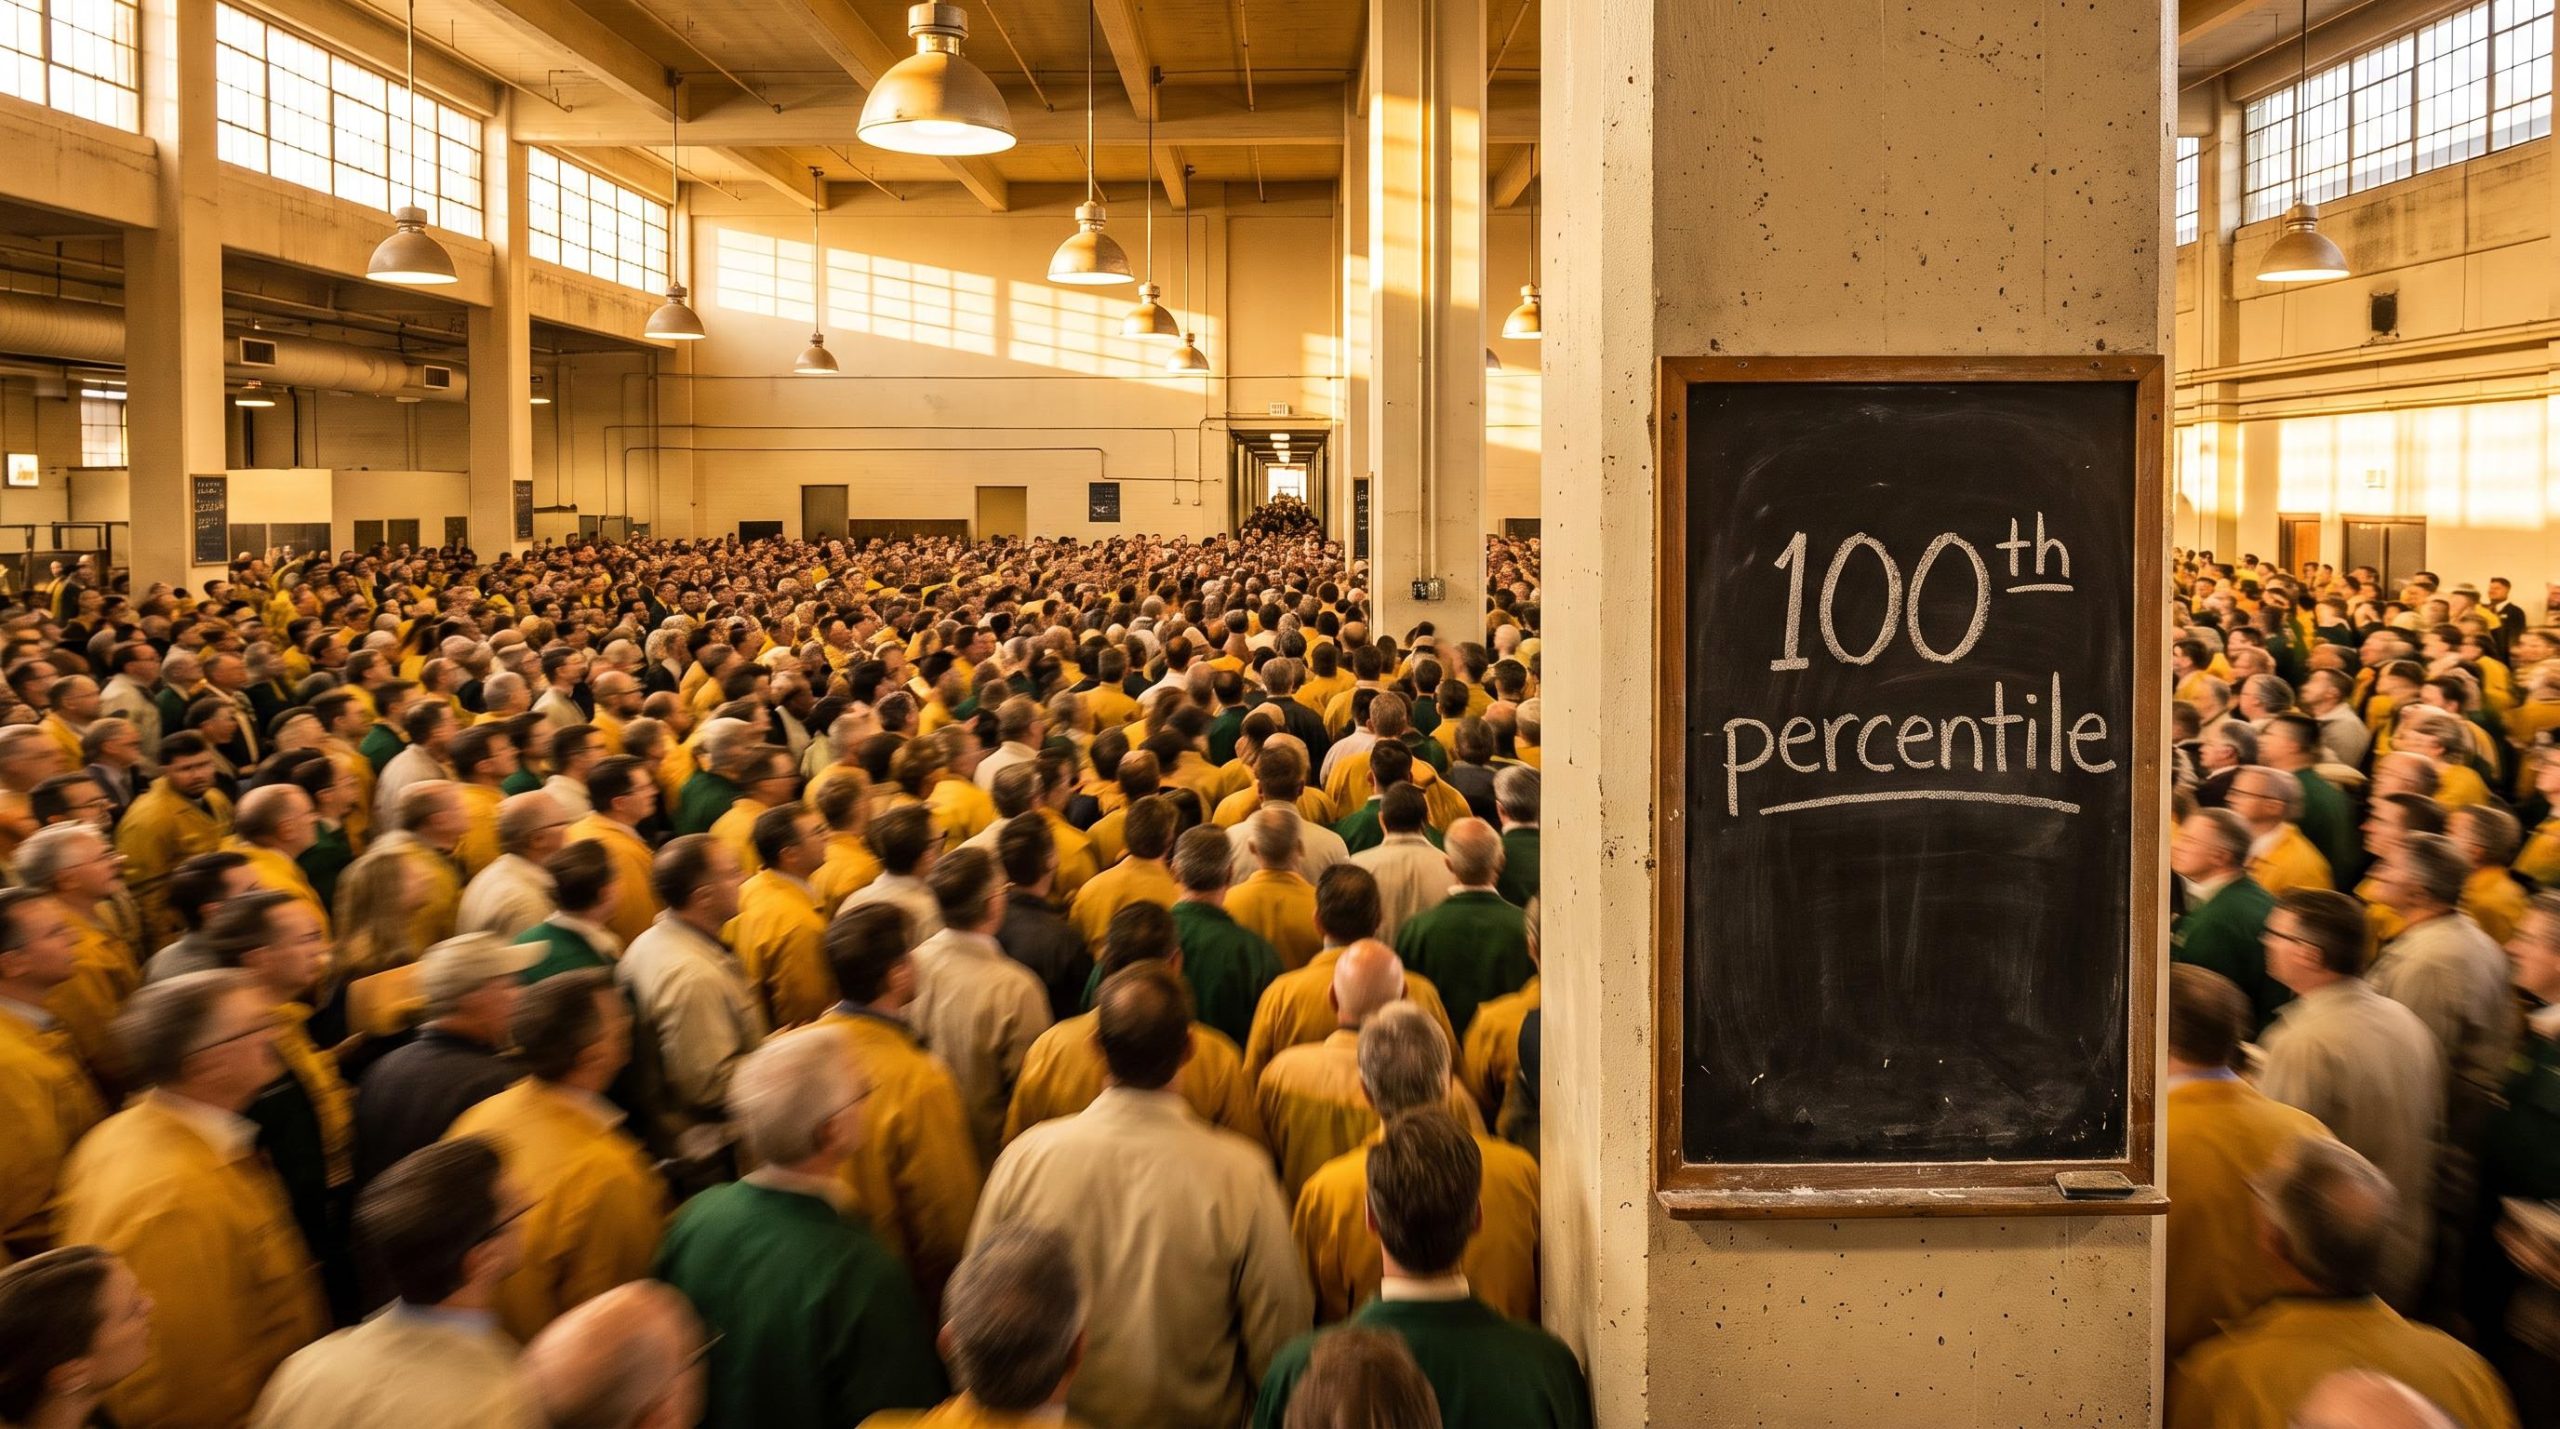
Soybean meal net-long positioning is sitting at the 100th percentile of its recent ranges. That is the statistical ceiling. It means, in practical terms, that professional speculators have already bought about as much of this market as they ever have.
Most retail investors have never been trained to read that number, and the ignorance carries a cost. A signal that tells you where the exit-door risk lives is worth learning to read.
Agricultural commodity markets in September 2026 are carrying some of the most concentrated speculative long positions on record. Two forces are pulling capital in at once: a record-strength El Nino event disrupting rainfall across key producing regions, and sustained supply disruption from Ukraine keeping a risk premium on grains and oilseeds. The convergence of climatic and geopolitical risk is a compelling story, and compelling stories are exactly what draw crowded commodity trades into existence.
Here is the tension at the centre of it all: being right about the direction is not the same as having a good trade.
This piece hands you a working framework for reading crowded positioning signals, understanding what overcrowding does and does not change about market probability, and deciding when that information is genuinely useful versus when it is just noise.
What the COT data is telling you right now
Start with the raw numbers, because they are unusually stark. As of mid-to-late September 2026, managed money and large speculators were holding heavily one-sided long positions across the agricultural complex.
| Commodity | Net Long Contracts | Positioning Percentile | Data Reference Date |
|---|---|---|---|
| Corn | 542,384 | Elevated | Week of mid-September 2026 |
| Soybeans | 261,200 | Elevated | Week ending 18 September 2026 |
| Soybean Meal | 207,751 | 100th percentile | Week ending 15 September 2026 |
| Sugar | 182,515 | Elevated | Mid-September 2026 |
Those figures come from the Commitments of Traders (COT) report, published weekly by the US Commodity Futures Trading Commission (CFTC). The report breaks down who holds futures positions by category, and the “managed money” line captures hedge funds and large speculators. When that line runs deeply net long, it signals that professional capital has committed heavily to one side of the trade.
The OFR’s COT methodology reference explains how the CFTC consolidates open interest across trader categories, including the definitional boundaries of the managed-money classification that places hedge funds and large speculators into a single net-position figure.
Soybean meal at the ceiling Soybean meal’s net-long positioning sits at the 100th percentile of its recent ranges. Not merely high. At the statistical maximum of observed positioning history.
That reading tells you something specific: virtually all the speculative buying power in soybean meal has already been deployed. When the marginal buyer has already bought, the question stops being who is left to push prices higher, and becomes who is left to sell if the narrative cracks.
What COT data does not tell you
The COT report is a powerful map, but it has three limits you need to hold in mind.
First, it is lagged. The data is typically released with a standard three-day delay, so what you are reading describes where positioning was, not where it is today.
Second, it aggregates. The managed-money category lumps together many different traders with different time horizons and different reasons for being long, so a single net figure hides a lot of heterogeneity.
Third, and most important, it carries no timing signal. A high net-long reading does not tell you when a market will turn. These readings can persist for weeks or months when fundamentals keep aligning with the prevailing story, which is exactly what has been happening here.
When big ASX news breaks, our subscribers know first
Why these commodities, and why now
Crowded positioning does not appear out of nowhere. It clusters where a persuasive narrative gives speculators a defensible reason to stay long, and right now two narratives are reinforcing each other.
The first is climatic. A historically strong El Nino event has raised the probability of disrupted rainfall, drought, and yield losses across producing regions in the Americas and Asia. The primary benchmark for tracking it is the Nino 3.4 index, which measures sea-surface temperature anomalies in a defined stretch of the equatorial Pacific.
The latest readings are extreme. According to the NOAA Climate Prediction Center on 21 September 2026:
- Nino 3.4: +2.1 degrees C sea-surface temperature departure
- Nino 3: +3.0 degrees C
- Nino 1+2: +3.9 degrees C
The International Research Institute at Columbia University, in its September 2026 assessment, put the weekly Nino 3.4 index centred on 16 September 2026 at +3.0 degrees C, with the August monthly value at +2.52 degrees C. Readings of this magnitude translate directly into elevated risk of rainfall disruption in exactly the regions that grow the world’s grains and oilseeds.
The second narrative is geopolitical. Ukraine, a major global source of wheat and grain, remains subject to ongoing logistical constraints, and those constraints have kept a structural risk premium embedded in maize and wheat prices. That premium is what keeps speculative capital comfortable staying long.
The forward signal that matters most Multi-model ensemble forecasts indicate a greater than 90% probability of very strong El Nino conditions (Nino 3.4 at or above +2.0 degrees C) persisting through September-November 2026 into the November-January 2026-27 window, with gradual weakening in early 2027.
That forecast matters because it points to at least one more Northern Hemisphere growing season under El Nino influence. Here is the awkward part for anyone hoping these trades unwind cleanly: when a record climatic event and a persistent supply disruption both point the same way, there is no obvious moment where the bulls are clearly wrong. A coherent, defensible narrative is precisely what makes a crowded trade structurally difficult to unwind.
The mechanics of crowded trade risk: what overcrowding actually changes
Here is the counterintuitive claim that most people get wrong: crowded positioning does not change the directional probability of a market outcome.
El Nino either disrupts production enough to justify current prices or it does not. Ukraine constraints either persist or they ease. Those outcomes remain roughly a coin flip, driven by weather, war, and policy, not by how many speculators are already long. Crowded does not mean wrong.
What crowding changes is magnitude. In a stretched market, the payoff structure becomes lopsided.
The asymmetry, in numbers A favourable outcome in a heavily long market may deliver roughly 70 cents of profit per unit. An unfavourable outcome, a reversal, produces a 30-cent loss. The direction is uncertain, but the risk-reward is already skewed against the latecomer.
This is why the concept to internalise is not “crowded equals reversal” but “crowded equals asymmetric magnitude.” One market analyst cited in the research noted that roughly 70% of their own trades of this type end in losses, a grounding reminder that acting on overcrowding is difficult even when the analysis is sound.
How a reversal cascade unfolds in practice
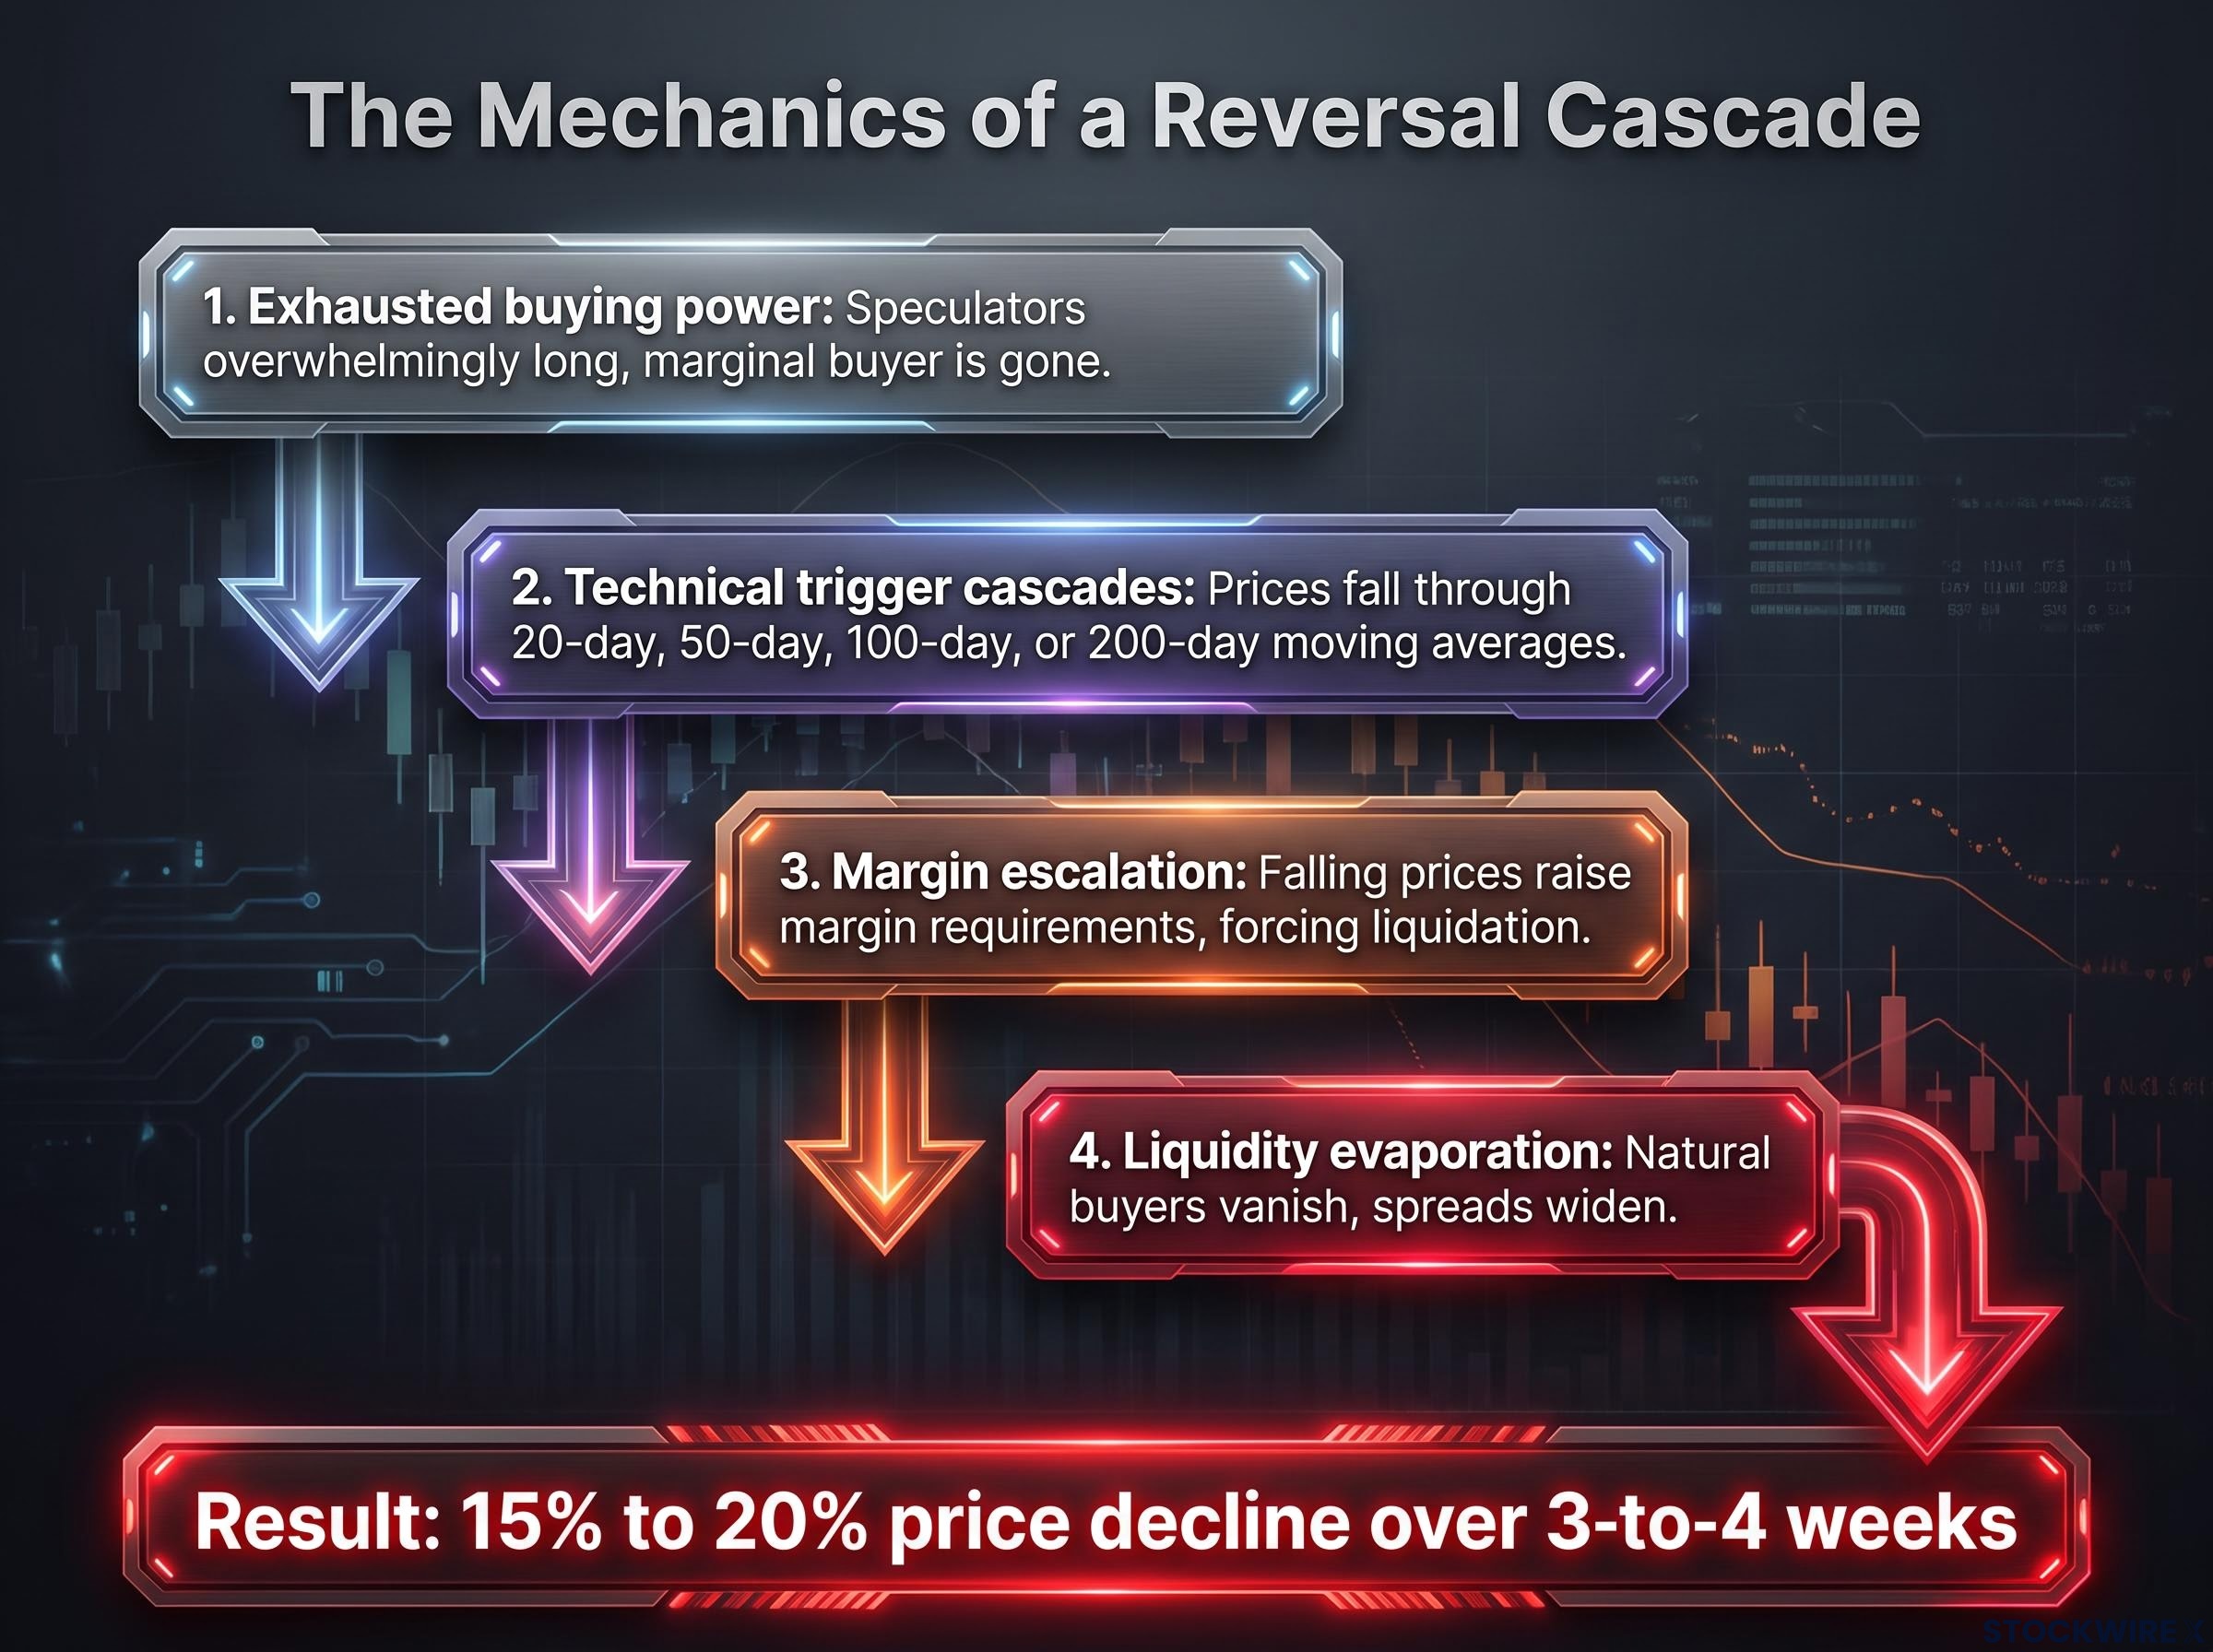
When a reversal does hit a crowded market, it tends to move through four connected stages.
- Exhausted buying power. With speculators overwhelmingly long, the marginal buyer is gone. Any negative surprise, an unexpected rainfall forecast or a localised de-escalation, forces the concentrated cohort to sell at the same time.
- Technical trigger cascades. As prices fall through key moving averages (the 20-day, 50-day, 100-day, or 200-day), clustered stop-loss orders fire, converting a decline into forced mechanical selling.
- Margin escalation. Falling prices raise margin requirements. Leveraged positions breach risk limits, and traders are compelled to liquidate whether they want to or not.
- Liquidity evaporation. Natural buyers vanish, market makers widen their spreads, and large sell orders push prices disproportionately lower, often through gap-moves.
The important thing to see is that this process is mechanical. It is largely indifferent to whether the underlying thesis is ultimately right or wrong.
The mechanical sequence described here is not unique to agricultural futures; CTA selling driven by rule-based threshold breaches follows the same cascade logic across asset classes, and Goldman Sachs identified an asymmetric downside exposure exceeding $100 billion in US equity futures under the same structural conditions: concentrated positioning, algorithm-executed deleveraging, and no discretionary override.
So a crowded trade is not a signal to act. It is a signal to recalibrate. If the fundamental narrative breaks, the exit door will be far narrower than the entry door ever was.
What a potential unwind means for food prices, and how long it lasts
Put concrete parameters on the reversal scenario, because vague warnings help no one. Drawing on historical pattern analysis in the research, an unwind of these positions could produce a decline of roughly 15% to 20% over a three-to-four-week period as the speculative cohort exits.
The reversal, sized and timed A 15-20% price decline over approximately three to four weeks as heavily long speculators clear out is the working estimate for how one of these unwinds tends to play out.
To keep this grounded in the real world, anchor it against physical food prices rather than futures alone. The FAO Food Price Index (FFPI), which tracks actual global food commodity prices, tells a notably different story from the futures market.
| Month | FFPI Reading | Change vs Prior Month | Change vs Year Ago |
|---|---|---|---|
| August 2026 | 133.3 points | Reference point | Not stated |
| September 2026 | 121.5 points | Broadly stable | -10.7% |
Here is the tension worth sitting with. Speculative futures positioning is at or near record extremes, yet the physical food index sits 10.7% below year-ago levels. The financial market and the physical market are telling different stories, and that gap is itself a rough measure of the speculative premium built into current prices. It is a premium that could compress quickly if the narrative shifts.
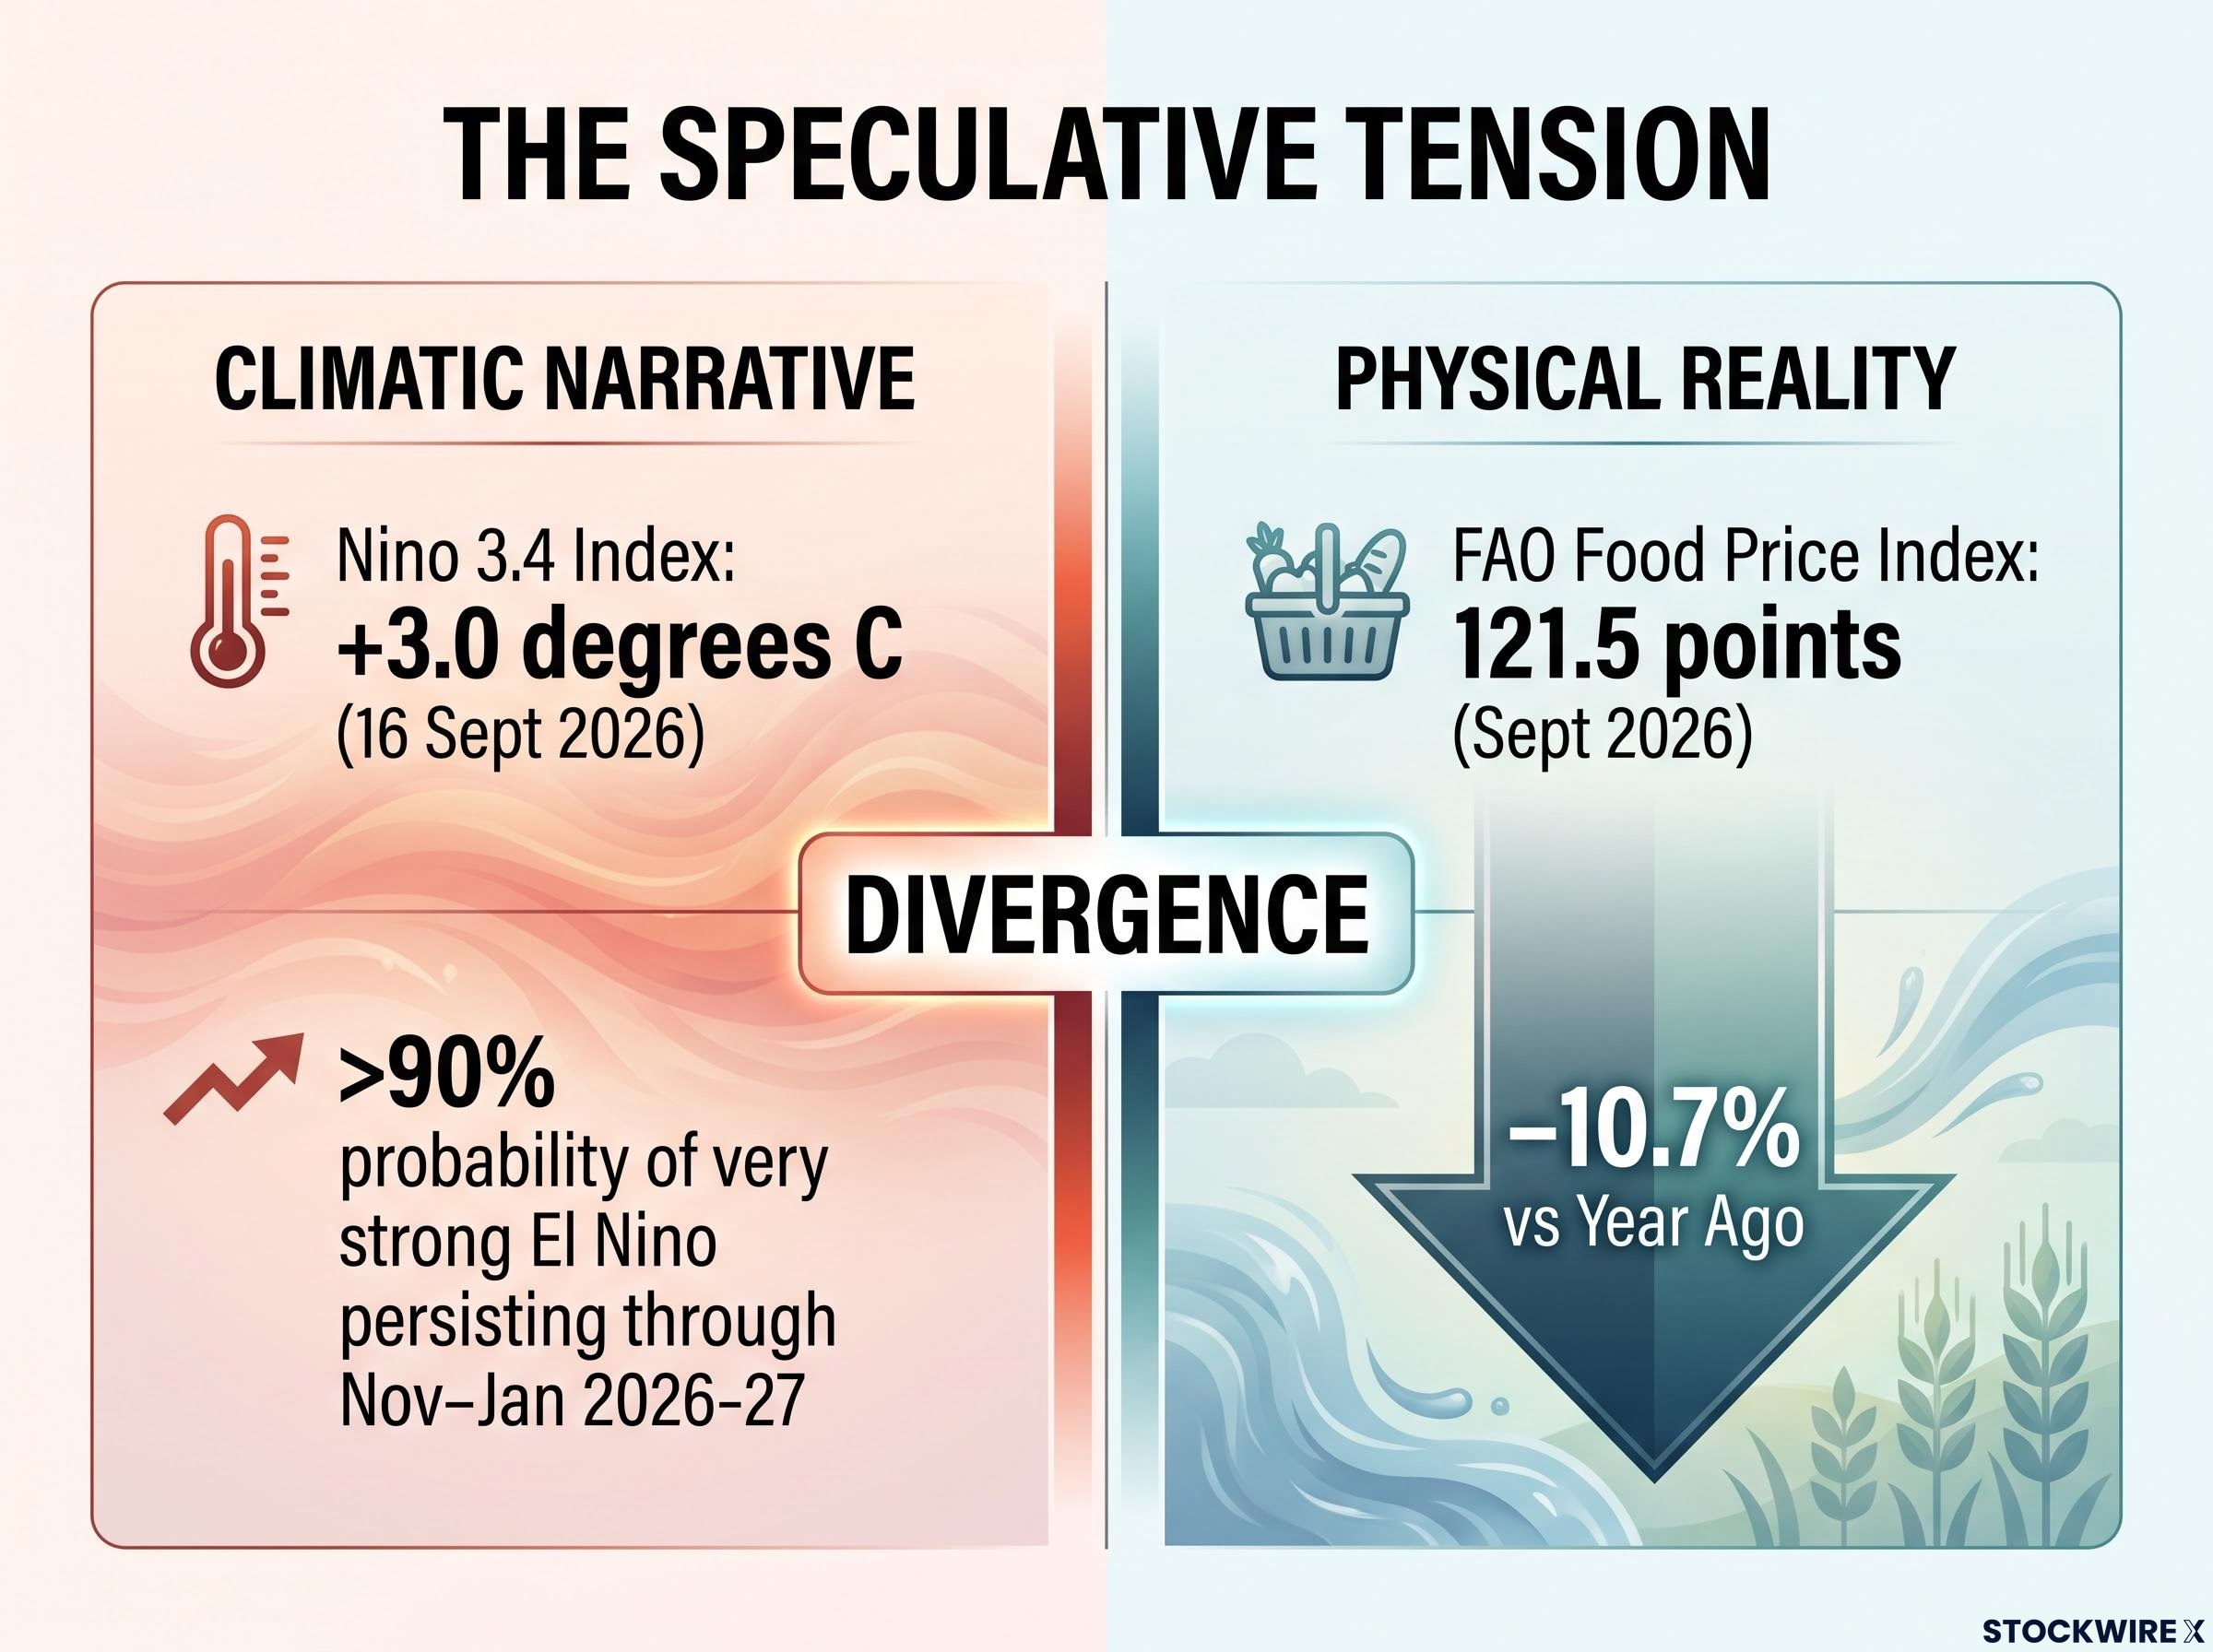
The cereal sub-index does carry genuine support from Ukraine-linked wheat and maize supply concerns, so this is not purely froth. But the divergence fuels a real debate: are current futures prices a fundamentally justified response to El Nino and geopolitics, or are they inflated beyond actual physical scarcity?
What happens after an unwind depends on the fundamentals:
- If the drivers stay intact: With El Nino severity and Ukraine constraints unchanged, prices are likely to push back toward prior, fundamentally justified levels once speculative excess clears. The reversal becomes a temporary pullback, not a structural re-pricing.
- If the drivers weaken: Should the fundamental support fade alongside the positioning, a partial reversal could harden into a more lasting move lower.
For anyone who buys groceries and watches inflation, the read is this: a reversal, if it comes, may deliver temporary relief on food costs without resolving the underlying supply pressures beneath them.
Reading crowded positioning signals without being misled by them
Turn all of this into a usable lens. The core reframe is simple: crowded positioning data is a risk-calibration input, not a trade signal. It tells you something about the potential magnitude of a move, nothing reliable about its timing or direction.
To make COT data actionable, layer three additional inputs on top of it, in sequence:
- Weather and crop progress reports for El Nino affected regions, to judge whether the climatic thesis is strengthening or fading.
- Export and demand data for Ukraine-linked grains, to test whether the geopolitical risk premium is holding.
- Liquidity indicators, specifically bid-ask spreads and open interest trends, as an early warning that market stress is building beneath the surface.
Now the harder truth about acting on this signal. Trying to fade a crowded long, betting against it directly, exposes you to short-squeeze dynamics: if fundamentals stay tight, prices can spike against you as margins rise and liquidity thins. The research notes that even analysts who correctly identify overcrowded trades still lose roughly 70% of such trades, largely because the timing is so difficult and fundamentally supported trends persist longer than anyone expects.
The 70% loss rate cited here is not an anomaly specific to agricultural futures; research into contrarian trades built on COT crowding signals finds the same figure holds across asset classes, with the edge residing in payout asymmetry rather than in any superior ability to call the turning point.
The three-to-four-week reversal window cuts both ways. It shows how quickly these moves can complete, which means the profitable window for a short-seller is narrow even when the analysis is right.
Trading expectancy is the metric that converts the 70% loss rate from a discouraging statistic into a usable framework: a strategy that loses 70% of the time can still carry a positive expected value if the average win is large enough relative to the average loss, which is precisely the asymmetric payout structure that makes selective positioning-signal trades viable despite the low hit rate.
The framing principle to keep Use crowded positioning to widen your margin-of-safety calculation, not to call a top.
The genuinely useful question this data prompts is a risk-management one, not an entry one: if you are already long here, how much downside can you absorb before your own exit becomes part of the cascade?
This article is for informational purposes only and should not be considered financial advice. Investors should conduct their own research and consult with financial professionals before making investment decisions. Past performance does not guarantee future results, and the reversal scenarios described are speculative and subject to change based on market developments.
What this market cycle reveals about the limits and uses of positioning data
The agricultural commodity cycle of 2026 is a working case study in how legitimate fundamental narratives attract and concentrate speculative capital until the positioning itself becomes a risk factor, independent of the original thesis.
El Nino and Ukraine gave speculators a coherent reason to be long. That reasoning drew capital in until soybean meal reached the 100th percentile of its positioning history. Two things are now true at once: the positioning is at an extreme, and the fundamental driver, a record El Nino, remains unresolved. Extreme positioning and intact fundamentals can coexist without either one invalidating the other.
With very strong conditions forecast at a greater than 90% probability through the November-January 2026-27 window and into the next growing season, the narrative is not exhausted. That means crowding risk stays elevated even as individual speculative positions eventually rotate.
The transferable lesson In any crowded market, treat two questions as separate: is the narrative durable, and is the positioning sustainable? They are not the same question, and confusing them is how latecomers get hurt.
So the question to ask in a crowded market is not whether the thesis is right. It is whether the thesis has enough remaining upside to justify the exit-door risk that concentrated positioning creates. Answer that well, and you have learned the difference between a good fundamental trade and a good risk-reward trade, which is the more durable skill.
For readers wanting to understand how systematic trend-following frameworks handle concentrated commodity positioning at a portfolio level, our dedicated guide to diversified futures portfolio strategy examines the correlation and position-sizing discipline that institutional managers use to manage exposure when individual commodity markets reach extreme readings.