Something odd is happening in the relationship between oil and bonds. In some scenarios, oil prices are falling, but Treasury yields are not following them down. That inverts the assumption most investors have carried for years.
It is a signal buried under the daily normalisation headlines, and most market commentary has walked straight past it. If you own bonds, equities, or anything sensitive to interest rates, this is the part of the oil story that actually matters to your portfolio.
Here is where the numbers sit. Crude oil back-month futures contracts have been trading near $80 per barrel, with elevated pricing embedded through at least May 2027. Institutional forecasts for 2026 span an extraordinary range, from roughly $58 to $115 per barrel, depending entirely on how long supply disruptions persist. That spread is not noise. It is the clearest measure available of how much genuine uncertainty surrounds oil prices macro risk right now.
After reading this, you will understand the specific mechanism by which oil threatens bonds and equities at the same time, know which price thresholds actually matter and why, and be able to read the major institutional forecasts with enough context to form your own view on where your exposure sits.
Why oil futures are pricing in elevated risk far longer than markets realise
Forget the daily spot price for a moment. The more revealing number is what the futures market is charging for oil to be delivered many months from now.
Back-month futures are contracts for delivery in later months, well beyond the current front-month period. According to Brent Kochuba of Spot Gamma, these contracts have been sitting near $80 per barrel, with elevated pricing carried through to at least May 2027. That matters far more than any single-day spot move, because it tells you what professional traders are willing to lock in for oil more than a year out.
Futures curve backwardation has been one of the clearest real-time signals of how much fear premium is embedded in spot prices: with WTI spot at $107 and the one-year forward contract at $73, the $34 spread represents the market’s own estimate of what resolves when geopolitical risk normalises.
Here is the dissonance. Financial media has largely settled on a normalisation story, oil calming down, supply returning, prices drifting lower. Yet the traded curve says something different: a multi-quarter risk premium is baked in, not a fleeting spike that fades in a fortnight.
That distinction is the whole point. A geopolitical scare that spikes oil for a week is one thing. A market that prices elevated crude out to mid-2027 is telling you that participants who put real capital at risk expect this to last. That is a very different signal for your rate expectations than a headline-driven pop.
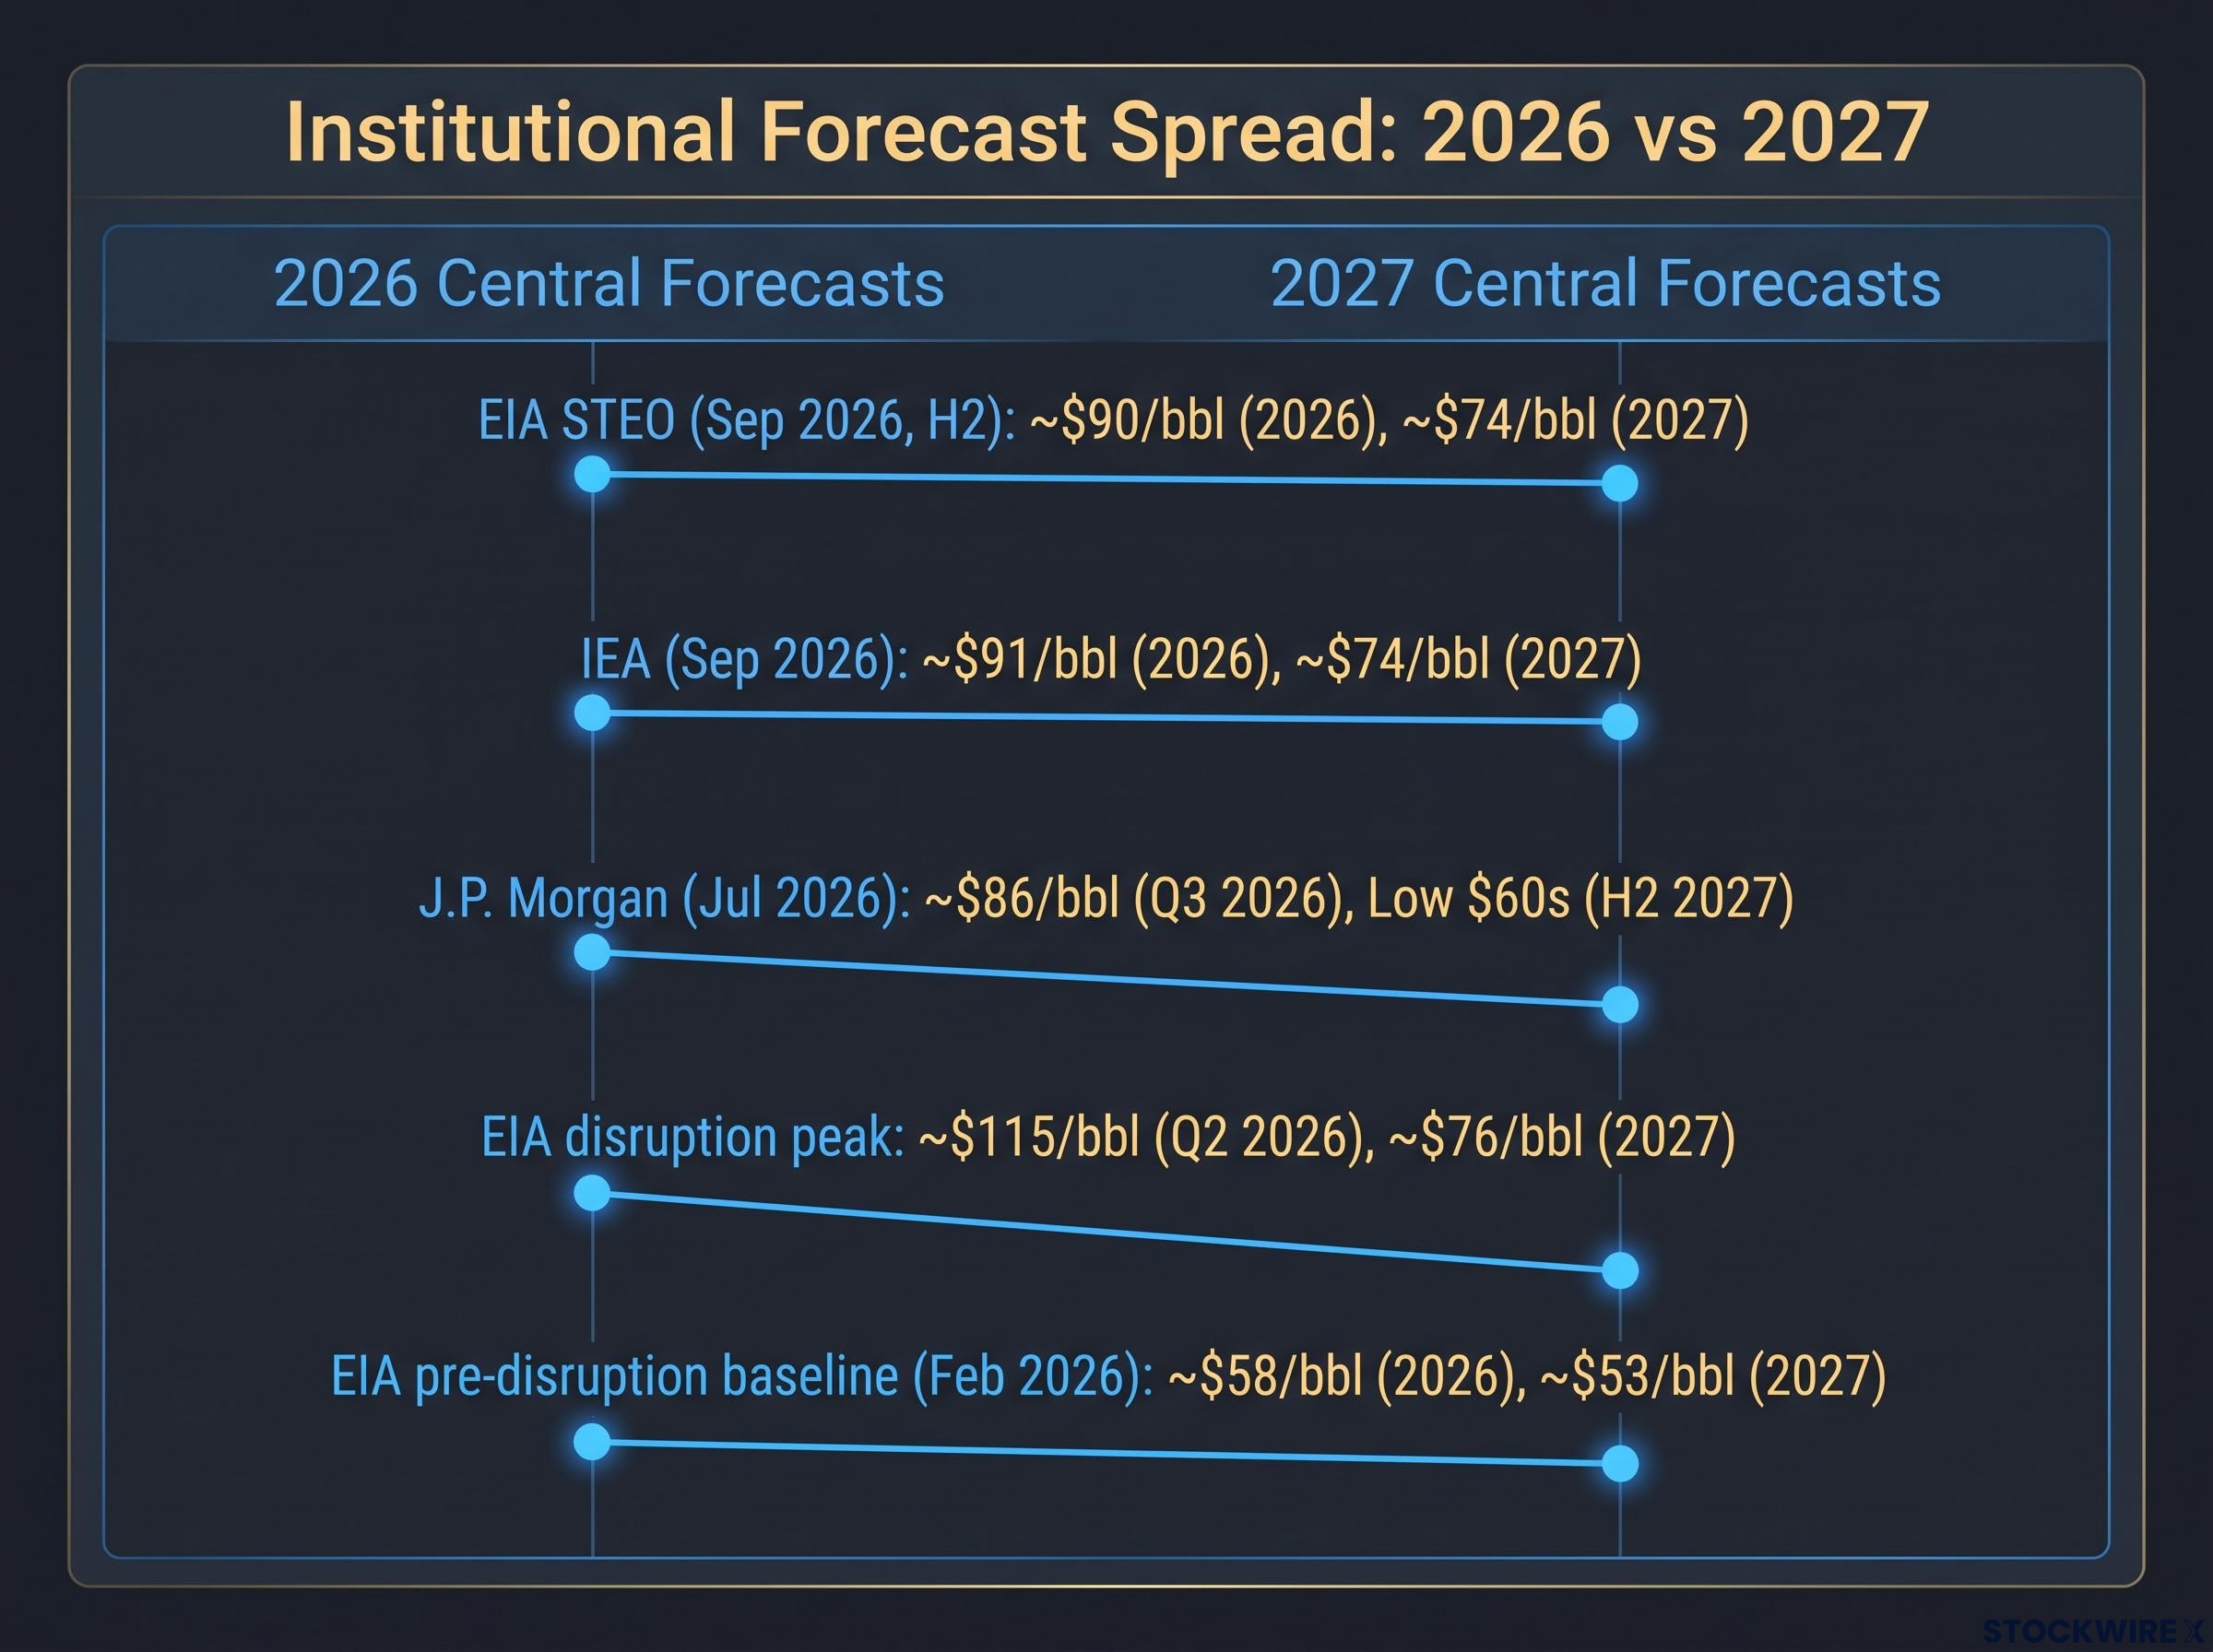
The wide institutional forecast range makes the uncertainty impossible to ignore. Here is how the major forecasters stack up.
| Source | Brent 2026 (central) | Brent 2027 (central) |
|---|---|---|
| EIA STEO (Sep 2026, H2) | ~$90/bbl | ~$74/bbl |
| IEA (via Anadolu, Sep 2026) | ~$91/bbl | ~$74/bbl |
| J.P. Morgan (Jul 2026) | ~$86/bbl (Q3) | Low $60s (H2) |
| EIA disruption peak | ~$115/bbl (Q2) | ~$76/bbl |
| EIA pre-disruption baseline (Feb 2026) | ~$58/bbl | ~$53/bbl |
The gap between the $58 per barrel pre-disruption baseline and the $115 per barrel disruption peak is not a rounding error. It is the signal itself. When serious agencies disagree by nearly double, the honest read is that oil prices in 2026 depend on a geopolitical variable no forecast can pin down.
Supply disruption versus demand signal: why it matters which one is driving prices
The reason behind an oil move changes everything about what it means for you.
A demand-driven spike, where prices rise because the economy is running hot, tends to push inflation expectations and Treasury yields up together. That is the relationship investors are used to. A supply-driven spike is the opposite animal: it behaves like a tax on consumers, draining spending power and dragging on growth even as it lifts prices.
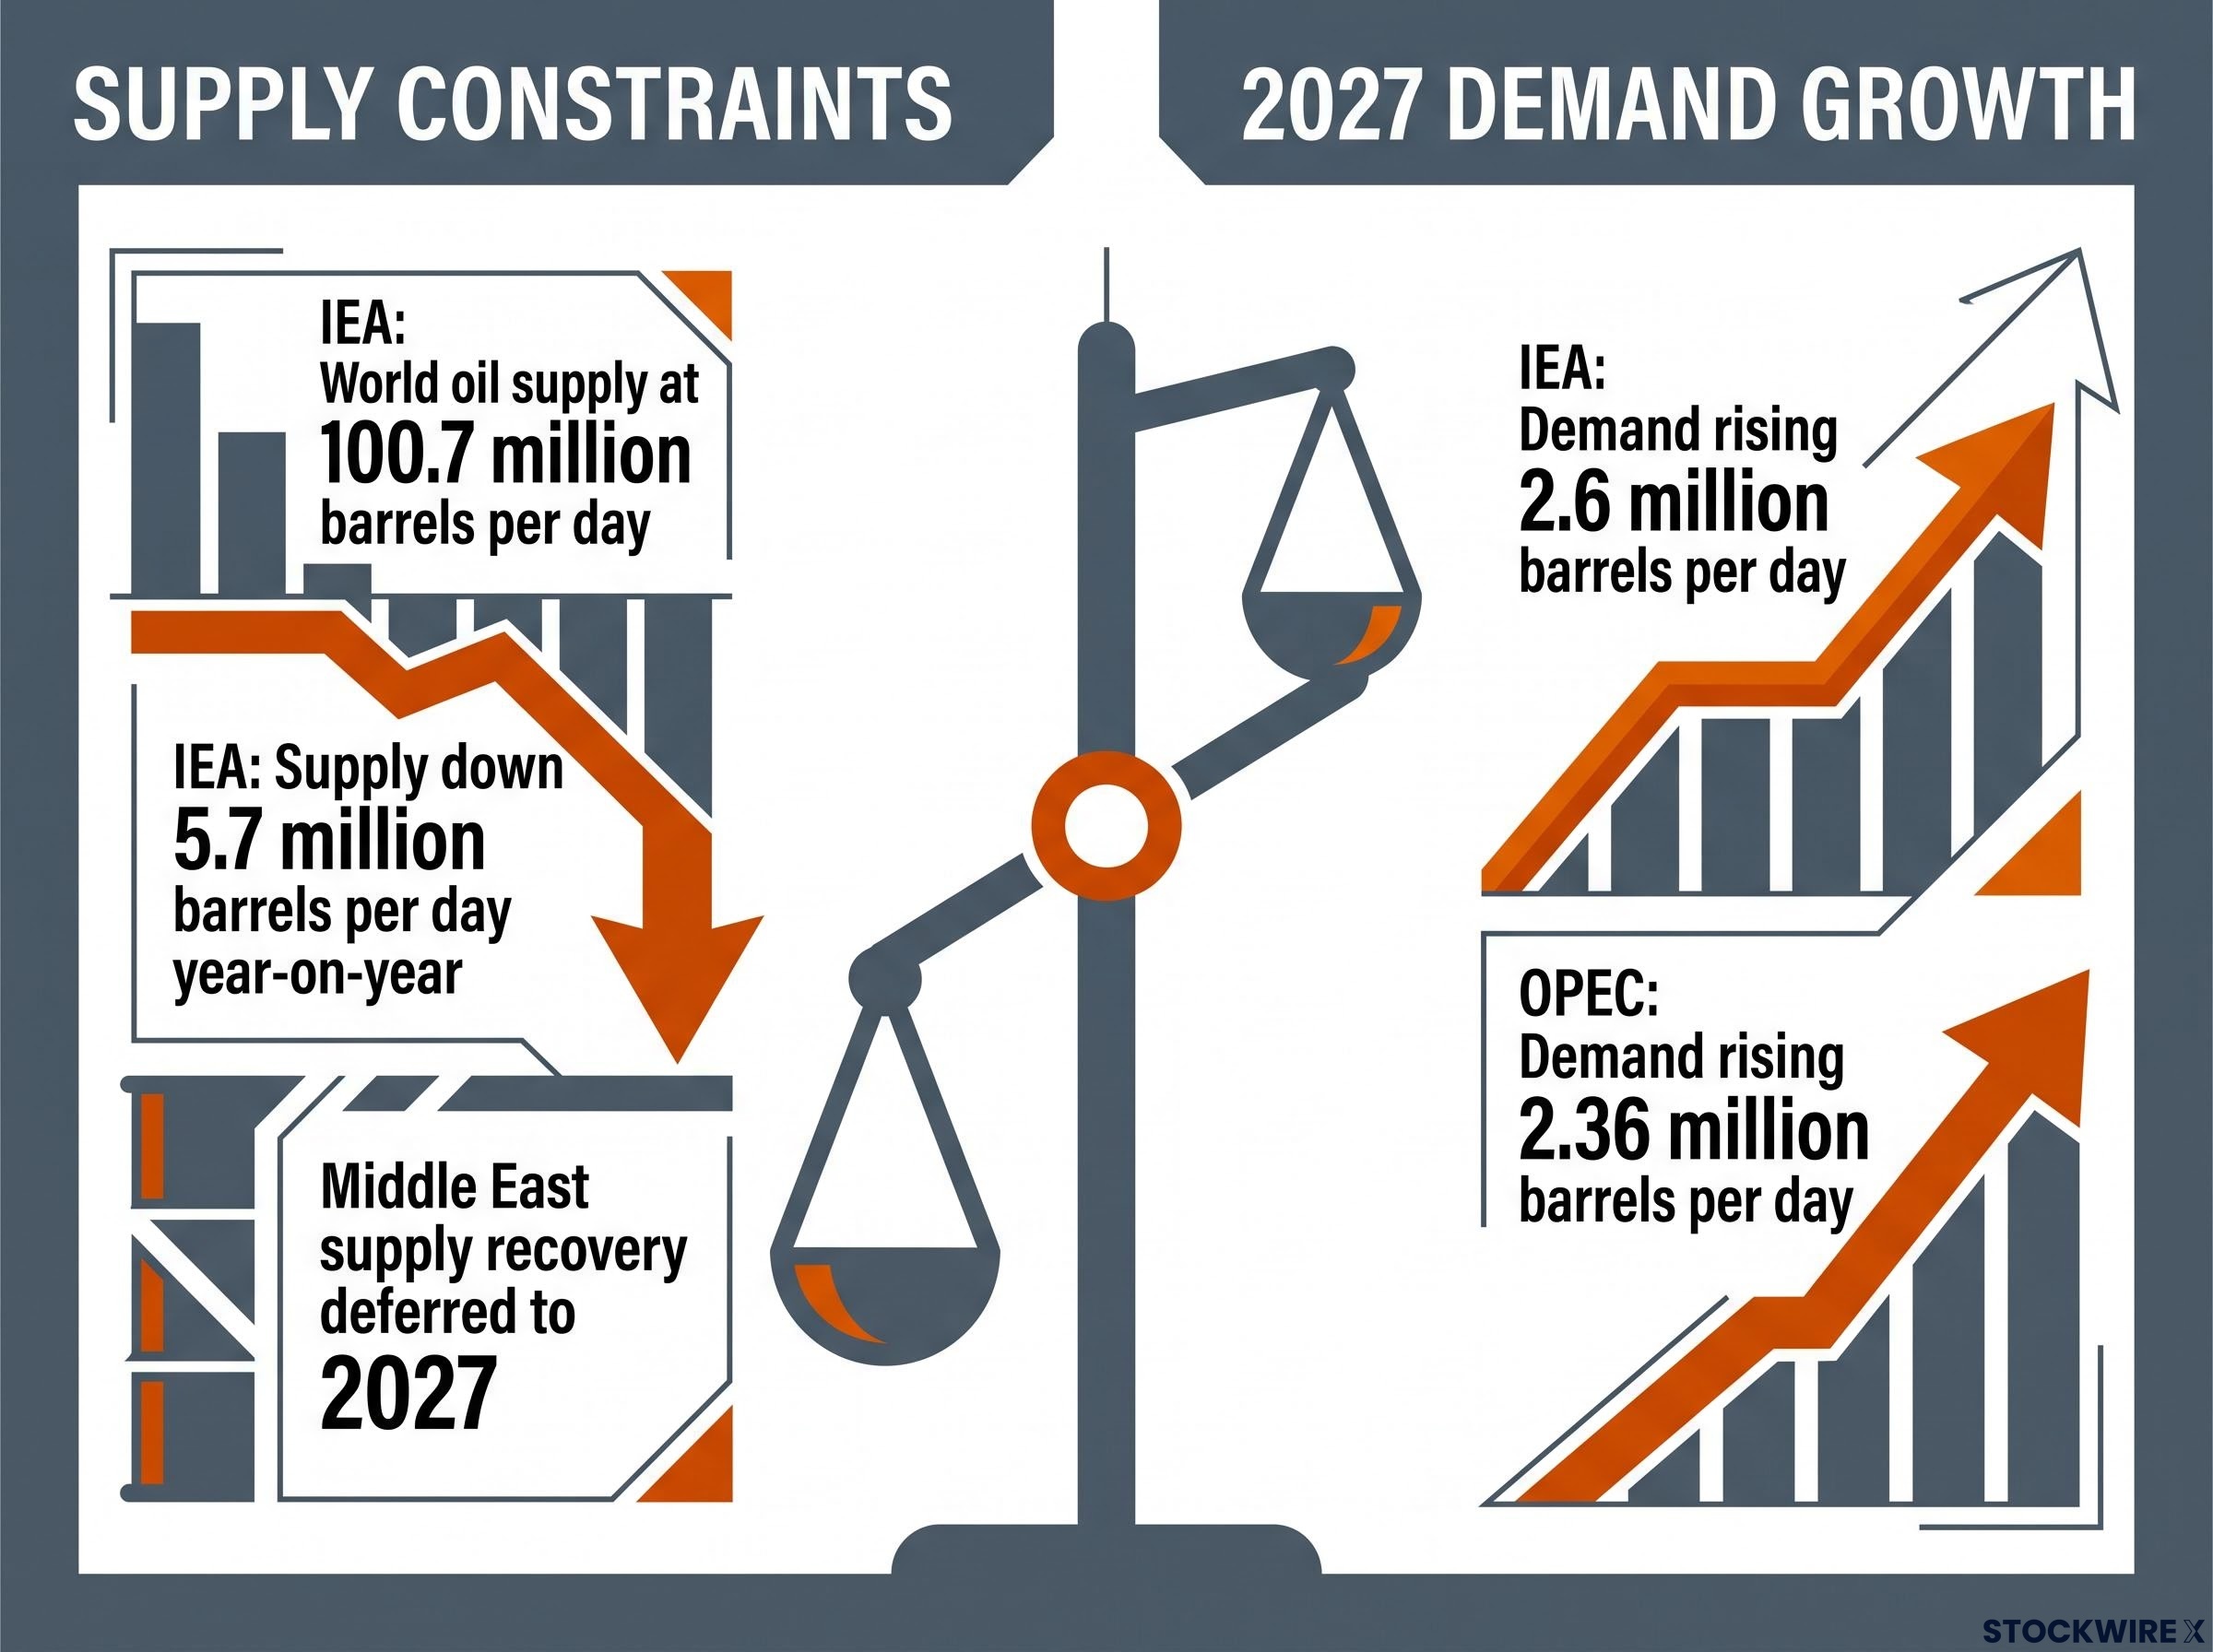
The IEA and EIA both document that the current environment is supply-led, driven by disruptions around the Strait of Hormuz, a critical shipping channel for global crude. The IEA’s September 2026 report projected world oil supply at 100.7 million barrels per day, down 5.7 million barrels per day year-on-year, with full Middle East supply recovery pushed out to 2027. That is a growth-drag story, not a booming-demand story, and it is why the usual oil-yield playbook may no longer apply.
When big ASX news breaks, our subscribers know first
How oil and Treasury yields became joined at the hip, and why that link is now unreliable
For a stretch before the picture shifted, oil prices and Treasury yields moved together in a strong positive correlation. When oil fell, yields tended to fall with it. That gave rate-sensitive investors a quiet built-in hedge: cheaper oil meant lower inflation pressure, which meant relief on rates.
Then a session arrived that broke the pattern. According to Kochuba, yields rose sharply while oil was not meaningfully elevated, an early sign the two series had begun to decouple.
That is the part worth sitting with. If oil can fall without dragging yields down, the automatic inflation-relief mechanism that many portfolios quietly relied on may no longer be there.
The oil-yield correlation has reached its strongest positive reading since 1989, according to Commerzbank analysts, with Brent above $100 and the 5-year Treasury yield approaching 5% simultaneously, a pairing that dismantles the assumption bonds and energy exposures offset each other.
The Federal Reserve’s own record shows this relationship was never as direct as it felt. The Fed’s February 2025 Monetary Policy Report noted that personal consumption expenditures (PCE) energy prices fell 1.1 percent over the 12 months to December 2024, yet the policy rate path stayed constrained. Cheaper energy did not mechanically translate into rate relief.
Governor Christopher Waller made the channel explicit in a speech on 13 July 2026, citing declining oil as a disinflationary force. But note how he framed it.
Governor Waller pointed to declining oil prices as a force expected to put downward pressure on headline inflation in the months ahead, tying the effect to the inflation channel rather than any direct link to Treasury yields.
That framing is the key. The Fed treats oil as something that works through inflation, not as a direct lever on yields. If inflation is only one of several forces setting yields, then oil losing its grip on rates is entirely plausible.
Three structural mechanisms could explain the decoupling:
- Supply-driven growth drag: When oil rises because supply is choked rather than demand is strong, it dampens growth rather than stoking the demand-led inflation that historically pulled yields higher.
- Geopolitical risk premium: A premium in oil driven by conflict and shipping risk is disconnected from the demand dynamics that once bound the commodity to yields.
- Fiscal factors: Yields can stay elevated for reasons tied to government borrowing and debt, entirely independent of energy-driven inflation.
One important caveat. No named institution has formally documented a structural breakdown in the oil-yield correlation in the reviewed research through September 2026. This is an observed market dynamic, not yet a codified thesis.
That distinction matters for how you use it. The breakdown reframes oil as a one-way risk: higher oil still threatens both yields and equities, but lower oil may no longer hand you the offsetting relief you have counted on. If your hedging logic assumes falling oil rescues your bond exposure, that assumption now needs revisiting.
The $100 and $120 thresholds: what they are and what breaks above them
Oil risk becomes far easier to think about once you stop treating price as a smooth line and start treating certain levels as regime shifts. Two numbers do the heavy lifting.
The first is $100 per barrel. According to Kochuba, this is the psychological and technical threshold markets watch closely, the level that traders, algorithmic systems, and options markets treat as a line rather than just another price. Cross it, and behaviour changes even before the economics do.
The second is $120 per barrel, cited in the same discussion as the macro damage threshold on which macro analysts broadly agree. This is where oil stops merely lifting inflation and starts materially impairing the wider economy.
Here is what makes these levels concrete rather than hypothetical. The EIA’s April 2026 STEO reported Brent averaging $103 per barrel in March 2026, rising to a peak near $115 per barrel in Q2 2026. The July disruption scenario put Brent around $106 per barrel in May and June 2026. Oil had also reached roughly $105 per barrel two to three weeks before Kochuba’s interview.
In other words, realised prices have already lived inside the $100 to $120 band. That tells you the $120 damage threshold is not some distant tail risk. It is a plausible extension of conditions that have already occurred this year.
| Price level | Market significance | Primary risk channel |
|---|---|---|
| Sub-$80 | Back-month baseline | Contained; normal inflation input |
| $80-$100 | Elevated but contained | Rising headline inflation pressure |
| $100 | Psychological/technical threshold | Market behaviour and positioning shift |
| $100-$120 | Macro stress zone | Consumer and margin compression begins |
| Above $120 | Macro damage threshold | Broad growth impairment, policy bind |
Above $120, the transmission channels sharpen. Consumer spending compresses as fuel eats into household budgets. Corporate margins tighten across energy-intensive sectors. And central banks face a genuine dilemma, caught between growth damage and inflation that refuses to cool.
The central bank dilemma at $120 and above
This is where policy gets genuinely hard. Above $120 per barrel, energy costs keep inflation elevated while growth deteriorates at the same time, a stagflationary bind.
Cut rates to protect growth, and you risk re-igniting inflation. Hold rates to contain inflation, and you accelerate the damage to growth. There is no clean move, which is precisely why this level marks a different kind of risk rather than simply a higher one.
The central bank policy bind above $120 is not hypothetical: Brent crossing $100 in September 2026 was already sufficient to invalidate inflation baselines embedded in existing rate guidance, with Rabobank’s Michael Every arguing that forward guidance calibrated to peacetime assumptions becomes obsolete the moment those assumptions fail.
What the institutional forecasts actually disagree about, and what that tells you
The forecasts do not disagree because someone is wrong. They disagree because each is pricing a different world. Read them as scenario maps rather than competing guesses, and the divergence becomes useful rather than confusing.
Three broad regimes are on the table:
- Pre-disruption oversupply: The EIA’s February 2026 baseline of $58 per barrel for 2026, built on production outrunning demand before Strait of Hormuz disruptions escalated.
- Post-disruption tightening: The IEA at $91.01 per barrel and the EIA at roughly $90 per barrel for H2 2026, reflecting constrained supply and delayed Gulf recovery.
- Reversion and normalisation: J.P. Morgan’s call for a slide into the low $60s in H2 2027 as supply returns and demand softens.
Both the oversupply and tightening cases are internally coherent. They just assume different things about geopolitics. That is the honest core of the uncertainty.
J.P. Morgan’s July 2026 view is the most bearish among the major banks reviewed. Having forecast around $86 per barrel in Q3 2026, the bank argued the backdrop ultimately sets up a reversion toward a $60 regime, with prices entering the low $60s in the second half of 2027. The logic is straightforward: supply normalises, demand weakens, and prices mean-revert.
The near-term picture is actually fairly anchored. IEA and EIA central forecasts cluster around $90 to $91 for 2026. The disagreement opens up in 2027, where the EIA sees roughly $74 per barrel and its own pre-disruption baseline sees just $53, a gap of more than $20 per barrel.
That spread tells you something specific: the 2027 outlook rests almost entirely on how fast disrupted supply comes back online. That is a geopolitical question, not an economic one, which is why no model can resolve it cleanly.
Demand complicates matters further. The IEA projects oil demand rising 2.6 million barrels per day in 2027, with OPEC close behind at 2.36 million barrels per day. Even if supply recovers, a strong demand rebound could keep the market tight.
There is also a credibility problem sitting underneath all of this. According to Kochuba, markets have steadily discounted official reassurances about energy price stabilisation, and that erosion widens the window in which elevated macro risk stays live.
Governor Waller’s July 2026 framing of declining oil as a disinflationary force sits in visible tension with EIA disruption scenarios that put Brent at $103 to $115 per barrel earlier in 2026, a reminder that policy optimism and structural supply constraints do not always point the same way.
For you, the practical move is not to pick a favourite forecast. It is to stress-test your exposure against both the J.P. Morgan reversion case and the IEA and EIA tighter-supply scenario, rather than anchoring your entire view to a single number.
Making sense of the risk before the next price move
Three ideas carry through everything above. The futures curve embeds a longer risk window than spot headlines suggest, with elevated pricing running to mid-2027. The oil-yield correlation can no longer be assumed to hand your portfolio automatic relief when oil falls. And the $100 to $120 band is a realised risk zone, not a theory.
The pivotal unknown is timing. If Middle East supply disruptions resolve on the IEA and EIA schedule, the 2027 normalisation thesis holds and prices drift toward the EIA’s $74 per barrel central call. If they persist, elevated pricing endures and the yield-impact channel stays open. The IEA’s projected supply gap of 5.7 million barrels per day year-on-year, with full recovery deferred to 2027, is the number that decides which path wins.
Be honest about the uncertainty. No institution has formally confirmed the correlation breakdown, and J.P. Morgan’s low $60s reversion is a credible alternative to the tighter-supply story. The gap between a J.P. Morgan $60s world and an IEA $74 per barrel world is not just a price disagreement. It reflects whether geopolitical supply risk fades or becomes a permanent feature, and that changes how you should weigh energy exposure across a multi-year horizon.
For readers wanting to trace how a sustained crude surge flows through to repriced rate expectations at the Fed, ECB, and Bank of England simultaneously, our full explainer on how oil reprices rate expectations across bond markets examines Morningstar’s three fixed income scenarios and what each implies for duration exposure.
Three signals worth watching before the next STEO revision
- Middle East supply restoration pace: Track whether Gulf flows recover ahead of the IEA and EIA deferred timeline. Faster recovery supports the reversion case; continued delay sustains elevated pricing and macro risk.
- Quarterly EIA STEO revisions: Treat each STEO update as a leading indicator of how institutions are shifting between scenarios. A downward revision signals the oversupply case gaining ground; an upward one confirms tightening.
- The yield-response test: Watch how Treasury yields react the next time oil moves significantly. If yields track oil again, the old correlation is back; if they diverge, the one-way risk framing holds.
This article is for informational purposes only and should not be considered financial advice. Investors should conduct their own research and consult with financial professionals before making investment decisions. Past performance does not guarantee future results. Financial projections are subject to market conditions and various risk factors, and forward-looking statements are speculative and subject to change based on market developments.