A company with $36 billion in annual revenue and tens of thousands of stores across the world sounds like it should sit in the same category as other giant restaurant chains. From the outside, Starbucks looks exactly like a franchise empire: familiar logo, standardised menu, locations on every corner. Its income statement tells a completely different story.
The way Starbucks structures its business is not just an operational footnote. It is the primary lens through which every revenue and profit figure on that income statement has to be read. Get the model wrong, and you will misinterpret the numbers.
The recent restructuring of the company’s China operations has shifted that model even further. Even investors who understood exactly how Starbucks reported revenue in fiscal 2024 are now reading a materially different financial document.
Here is what this article gives you: after reading it, you will know precisely which line items to interrogate, why the company’s revenue base just shrank while its profitability arguably improved, and what questions to ask before you treat any single year’s figures as a clean baseline.
Why Starbucks books revenue differently from nearly every chain you can name
Start with the fact that trips up most people who glance at the income statement. Starbucks owns and runs the majority of its stores directly. It does not hand them to franchisees and collect a fee.
That single structural choice reshapes everything below it. When you operate your own stores, every dollar a customer spends on a latte flows straight through your financial statements as revenue. There is no franchisee in between keeping the retail sale and passing you a royalty.
This is why the company reported roughly $36.2 billion in total net revenues for fiscal 2024. That figure is dominated by gross retail receipts from stores Starbucks itself owns.
Company-operated stores generated approximately 82% of total net revenues in fiscal 2024. The economic weight of the business sits overwhelmingly in stores the company runs itself.
The distinction that matters here is licensing, not franchising. Starbucks does have third-party operators, but it calls what it collects from them “licensing fees” rather than franchise fees, and the difference is more than semantics. A licensed location pays the company brand royalties and licensing income, which is structurally different from, and far smaller in volume than, the gross store sales a company-operated location contributes.
Picture a Starbucks counter inside a Target store. Target’s own employees typically staff it, Target runs the operation, and Starbucks records only the licensing and brand fees, not the gross sales rung up at that counter. That is why licensed locations, despite representing a large share of the physical footprint, contribute proportionally little to consolidated revenue.
The company reports three revenue streams, and knowing what each contains is the foundation for reading the rest:
- Company-operated store revenue: gross retail sales from stores Starbucks owns and runs directly. This is the dominant line.
- Licensed store revenue: licensing fees, brand royalties, and product sales to third-party operators like Target. Higher margin per dollar, far lower in volume.
- Other revenue: packaged goods, ready-to-drink products, and related income streams.
The concentration is regional too. Approximately 61% of U.S. Starbucks locations are directly operated by the company, and those company-owned U.S. stores generate roughly 85% of domestic revenue.
So when you see Starbucks reporting $36 billion in revenue, you are primarily looking at the gross retail receipts of a company that owns and operates most of its own stores, not the royalty and fee income of a brand licensor. That single fact changes how you should read every margin figure sitting beneath it. Investors who arrive expecting franchise-like economics will systematically misjudge both the scale of the revenue and where the cost exposure sits.
When big ASX news breaks, our subscribers know first
What Starbucks’ income statement would look like if it operated like McDonald’s
Run a thought experiment. Imagine Starbucks flipped its model overnight and started operating the way McDonald’s does, collecting franchise fees, rent, and royalties as its main source of revenue rather than running the stores itself.
The first thing that would happen is that reported revenue would fall, and fall sharply. A franchisor books only the fees and rent from franchisees, not the gross sales rung up at the counter. The $36 billion top line would compress to a fraction of that number.
The second thing is more interesting for anyone watching profitability: operating margins would rise. In a franchise-heavy model, the direct store-level costs, the wages, occupancy, benefits, and utilities, sit with the franchisees. The parent company collects high-margin fee income without carrying that cost base.
The same structural gap appears on the other side of the ledger: franchise model revenue at McDonald’s runs at an 83.9% segment margin versus roughly 14.8% for company-operated restaurants, which is precisely why the 2017 refranchising push shrank reported revenue while making the business more profitable.
Starbucks, by contrast, carries all of it. Because it owns its stores, its income statement absorbs wages, rent, benefits, and utilities directly, which makes its operating margin far more exposed to labour inflation, softening customer traffic, and ordinary cost cycles.
You can see that exposure in the numbers. Operating margin ran at 16.3% in fiscal 2023, compressed to 15.0% in fiscal 2024, and fell to 9.9% on a GAAP basis in Q3 fiscal 2025. Operating income itself dropped to $5.4 billion in fiscal 2024, down from $5.9 billion the year before.
Here is the interpretive point. That slide from 16% to under 10% within two years is not evidence that the Starbucks brand deteriorated. It is evidence of what a company-operated model does under pressure: it transmits operational and cost strain straight into reported profit in a way a franchise system simply does not. Knowing that framework is the difference between reading the compression as a structural flaw or as a potentially recoverable cycle.
| Attribute | Company-operated model (Starbucks) | Franchise-heavy model (e.g. McDonald’s) |
|---|---|---|
| Primary revenue source | Gross retail sales from owned stores | Franchise fees, rent, and royalties |
| Margin structure | Lower and more volatile operating margins | Structurally higher operating margins |
| Direct cost exposure | Wages, occupancy, benefits, utilities sit with the parent | Store-level costs sit with franchisees |
| Traffic deleverage sensitivity | High: traffic dips hit margins directly | Low: fixed-fee income cushions the parent |
| Capital intensity | Higher: company funds store build-out and operations | Lower: franchisees carry much of the capital load |
How deleverage turns a traffic dip into a margin problem
Deleverage is the mechanism that connects a soft quarter to a margin problem, and it is worth understanding in concrete terms. Deleverage refers to what happens when a fixed cost base gets spread across fewer sales dollars.
Operating leverage is the underlying mechanism at work here: a large fixed cost base means that each incremental dollar of traffic recovery flows through to profit at an amplified rate, just as each dollar of traffic decline hits margins disproportionately hard.
Starbucks carries a large base of costs that do not flex with customer traffic. Rent on a leased store is the same whether 400 or 300 customers walk in. Management salaries and minimum staffing levels hold steady regardless of how busy the counter is.
Now apply the Q3 fiscal 2025 numbers. Global comparable store sales declined 2% and comparable transactions declined 3%, only partly offset by customers spending more per visit. When transactions fall 3%, that fixed cost base is spread over fewer revenue dollars, and the margin compresses arithmetically even if nothing else in the business changes. That is deleverage, and in a company-operated model it lands squarely on the parent.
The China restructuring as a live case study in revenue recognition change
Everything above has been mechanics. The China restructuring is where those mechanics become visible in real reported numbers, and it explains how a revenue decline and a margin improvement happened in the same breath.
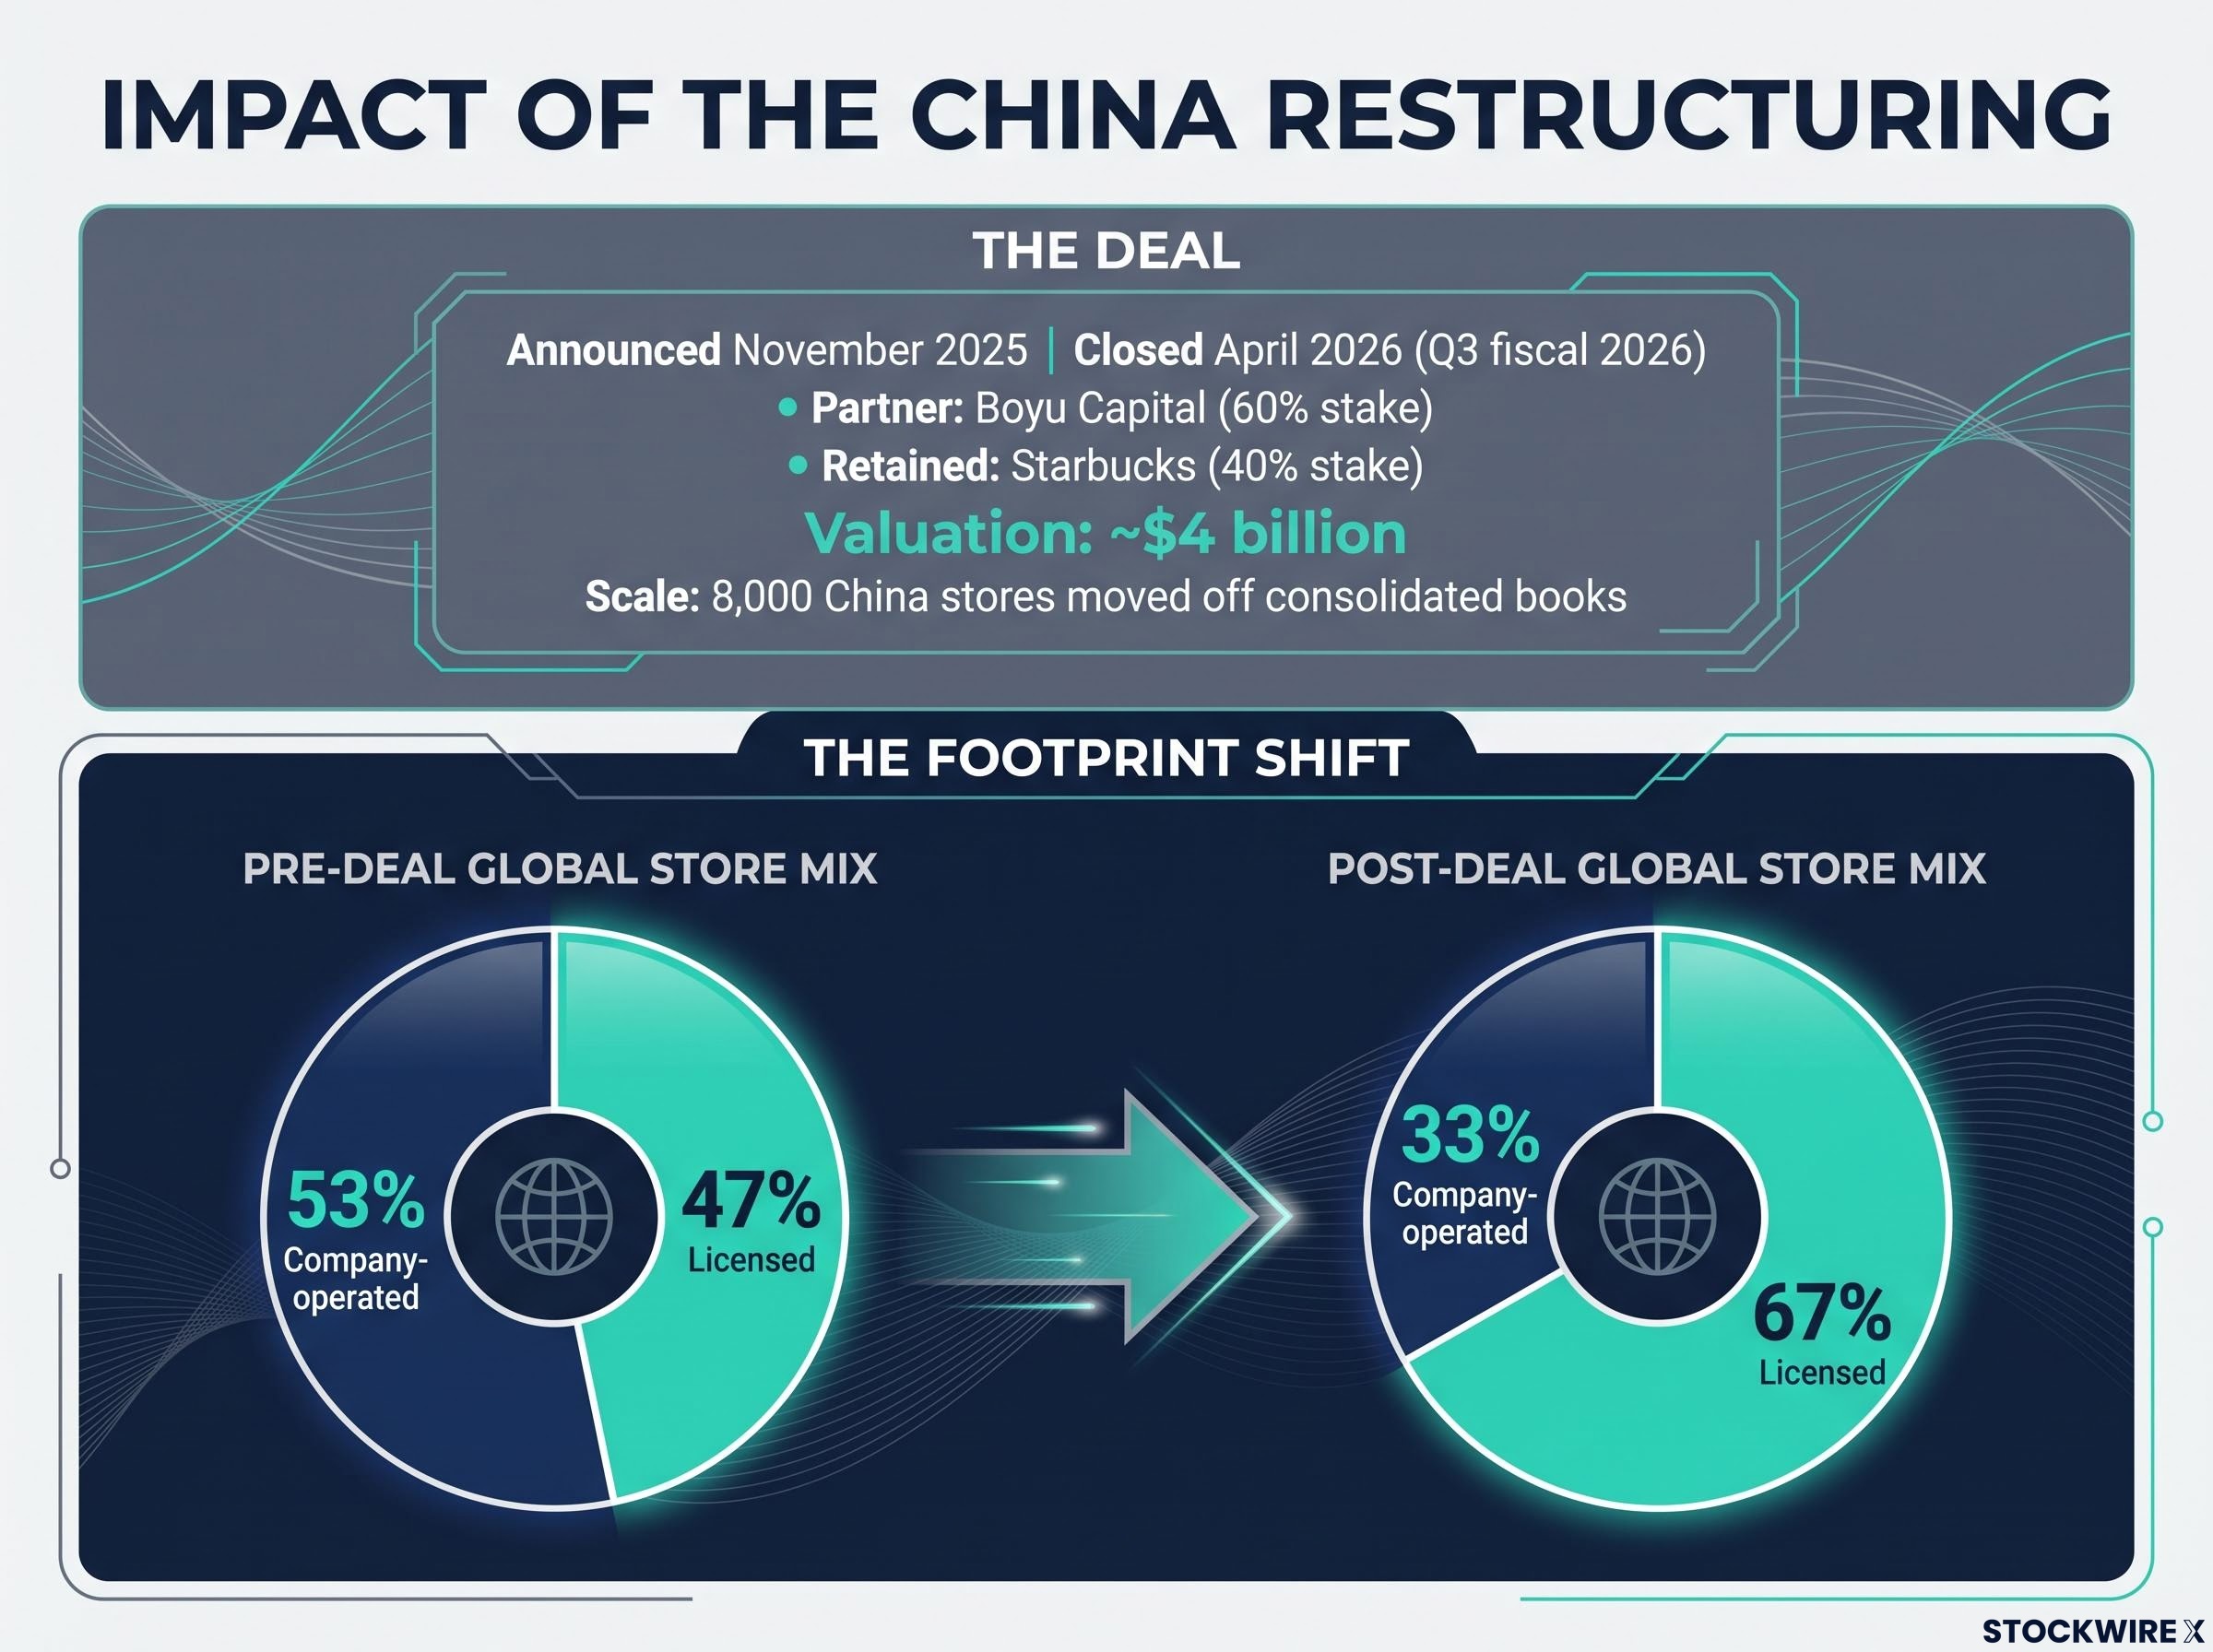
The transaction itself is straightforward to describe. Announced in November 2025 and closed in approximately April 2026 (the third quarter of fiscal 2026), Boyu Capital acquired a 60% stake in the China business, with Starbucks retaining 40%. The deal valued the operation at roughly $4 billion and moved approximately 8,000 China stores off the consolidated books.
The revenue recognition change is the part investors need to hold precisely. Before and after the deal, Starbucks records fundamentally different things from China:
- Before the deal: Starbucks consolidated the full gross retail revenues of its roughly 8,000 China stores onto its top line, and carried the full store-level cost base that came with them.
- After the deal: it no longer books those gross revenues. Instead it records brand licensing royalties, a percentage of China system sales, plus equity income representing its share of profit from the retained 40% stake.
- The net effect: consolidated revenue falls because the gross China sales disappear from the top line, but the income that remains is higher margin, because it arrives with no associated store-level cost burden.
The Q3 fiscal 2026 results show this in the actual numbers. Total net revenues came in at $9.3 billion, down 1% year-over-year, with Starbucks citing the China deconsolidation as the primary driver. At the same time, the GAAP operating margin recovered to 10.5%.
Non-GAAP operating margin reached 14.4% in Q3 fiscal 2026, a meaningful recovery from the 9.9% GAAP low of a year earlier. Removing thousands of lower-margin retail stores from the consolidated profit and loss statement is part of what drove that recovery.
The gap between GAAP and non-GAAP earnings at Starbucks in Q3 fiscal 2026, with a 10.5% GAAP margin sitting alongside a 14.4% non-GAAP figure, is a textbook example of why reading GAAP and non-GAAP earnings together rather than defaulting to either one is the more analytically rigorous approach.
The store mix tells the same story from a different angle. Before the deal, the global footprint ran at roughly 53% company-operated and 47% licensed. After it, the split shifted to approximately 33% company-operated and 67% licensed. That is a material change in the shape of the business, achieved in a single transaction.
Here is why this matters for how you read the reports. When Starbucks shows lower revenue in fiscal 2026 than fiscal 2025, that headline decline does not mean the business contracted. It means roughly 8,000 stores moved off the consolidated books. Anyone reading the top-line figure without this context will draw exactly the wrong conclusion about momentum, and they will do it because fiscal 2025 and fiscal 2026 are no longer comparable on a like-for-like basis.
Reading the margin trajectory as an investor: what is structural and what is recoverable
The margin figures you have now seen tell two different stories at once, and the discipline is holding both rather than defaulting to the simpler one. The recent compression came from three genuinely different sources, and separating them is where the analytical work sits.
The first source is cyclical traffic deleverage, the mechanism described earlier, where softer transactions spread fixed costs over fewer dollars. This is the most recoverable of the three, because it reverses when traffic returns.
The Q2 fiscal 2026 results provided the first confirmation that the deleverage cycle was turning: U.S. comparable store sales grew 7.1%, with more than four percentage points of that driven by transaction volume rather than price, the clearest signal yet that traffic was returning rather than simply being masked by ticket inflation.
The second is deliberate investment. Management’s “Back to Starbucks” plan has funded additional labour hours and leadership programmes, and analysts read these as chosen costs, near-term drag that management is absorbing on purpose to improve service and store operations. This is a decision, not a deterioration.
The third is structural: the inherent cost exposure of a company-operated model, which no amount of execution eliminates. With roughly 82% of revenue from owned stores, Starbucks will always feel wage and occupancy cost more directly than a franchisor would.
Against those three pressures, the China restructuring now works in the other direction. By moving approximately 8,000 lower-margin retail stores off the consolidated profit and loss statement and replacing them with higher-margin royalties and equity income, the deal has begun contributing to margin accretion.
| Period | Operating margin | Primary driver cited |
|---|---|---|
| Fiscal 2023 | 16.3% | Pre-compression baseline |
| Fiscal 2024 | 15.0% | Early softening in traffic and rising costs |
| Q3 fiscal 2025 | 9.9% GAAP | Traffic deleverage plus investment drag |
| Q3 fiscal 2026 | 10.5% GAAP / 14.4% non-GAAP | China deconsolidation plus early comp recovery |
The gap between the 9.9% GAAP low and the 14.4% non-GAAP figure in Q3 fiscal 2026 is not just an accounting footnote. It shows you exactly where to look for the distance between the structural earnings power of the business and the near-term investment drag that management is choosing to carry.
Five variables that will tell you whether the margin recovery is real
These are diagnostic tools you can watch yourself, not management commentary to take on trust. For each, there is a clear positive signal and a clear warning sign:
- Comparable store sales and transaction counts: positive comps, as reported in Q3 fiscal 2026, signal that deleverage is reversing. Sustained negative transactions are the red flag.
- Labour cost per hour and staffing levels: stable or improving productivity as service hours rise is the positive read. Wage costs climbing faster than sales is the warning.
- Pace and payoff of “Back to Starbucks” investments: margins and EPS recovering in line with management’s narrative is the signal to trust. Continued spend with no traffic response is the concern.
- China licensing and equity income contributions: growing royalty revenue and JV earnings validate the restructuring. Weak contribution suggests the local operator is struggling.
- Free cash flow consistency: steady cash generation supports the recovery thesis. Note that free cash flow has been inconsistent over the past decade, so this one warrants close attention.
Investors who can separate the structural floor of the margin from the cyclical and investment-related drag are in a materially stronger position to judge valuation and recovery timing than anyone taking the headline figure at face value.
What the business model tells you before you look at a single earnings figure
Pull the three layers together and a coherent framework emerges. The company-operated revenue structure explains why the top line is large and the margins volatile. The McDonald’s contrast explains why that volatility is a feature of the model rather than a failure of the brand. The China restructuring shows the company deliberately shifting a slice of its earnings toward a more asset-light mix of royalties and equity income.
Just how much has already changed is captured in one number. The global store mix moved from roughly 53% company-operated and 47% licensed before the deal to approximately 33% and 67% after it. The $4 billion valuation and the retained 40% stake mean Starbucks still participates economically in China; it simply does so through a different accounting door.
Peer-reviewed refranchising research on shareholder value draws on agency theory and transaction cost analysis to show that moving from company-operated to franchised or licensed units can structurally improve parent-level margins by transferring store-level cost burdens to the operating partner, precisely the dynamic visible in the Starbucks China deal.
The forward question is precise. Can the combination of “Back to Starbucks” investment, China’s transition to royalties and equity income, and any recovery in comparable store sales restore margins toward the mid-teens range the business has demonstrated historically, from the low double digits and high single digits of recent quarters?
Two interpretations sit side by side. One camp reads the model shift as a path to higher-quality, more stable, asset-light earnings. The other worries about lost top-line growth and the new dependence on Boyu Capital‘s execution in China.
The business you are analysing in late 2026 is structurally different from the one described in the 2024 annual report. Anyone calibrating their expectations to the old model is evaluating a company that no longer exists in that form.
This article is for informational purposes only and should not be considered financial advice. Investors should conduct their own research and consult with financial professionals before making investment decisions.
Past performance does not guarantee future results. Financial projections are subject to market conditions and various risk factors.