Why AI Is Pushing Memory Chip Prices Higher Through 2028
1 hr ago

Starbucks just posted its strongest North American transaction growth in roughly three years, and Wall Street responded by sending SBUX shares up nearly 6% in a single session. The Q2 FY2026 results, reported after market close on 28 April 2026, delivered beats across revenue, adjusted EPS, and comparable store sales, representing the most concrete evidence yet that CEO Brian Niccol’s “Back to Starbucks” turnaround strategy is translating into measurable financial improvement. What follows breaks down what the numbers showed, what drove the top-line recovery, what the China joint venture announcement means for the business, and how analysts are pricing the path ahead.
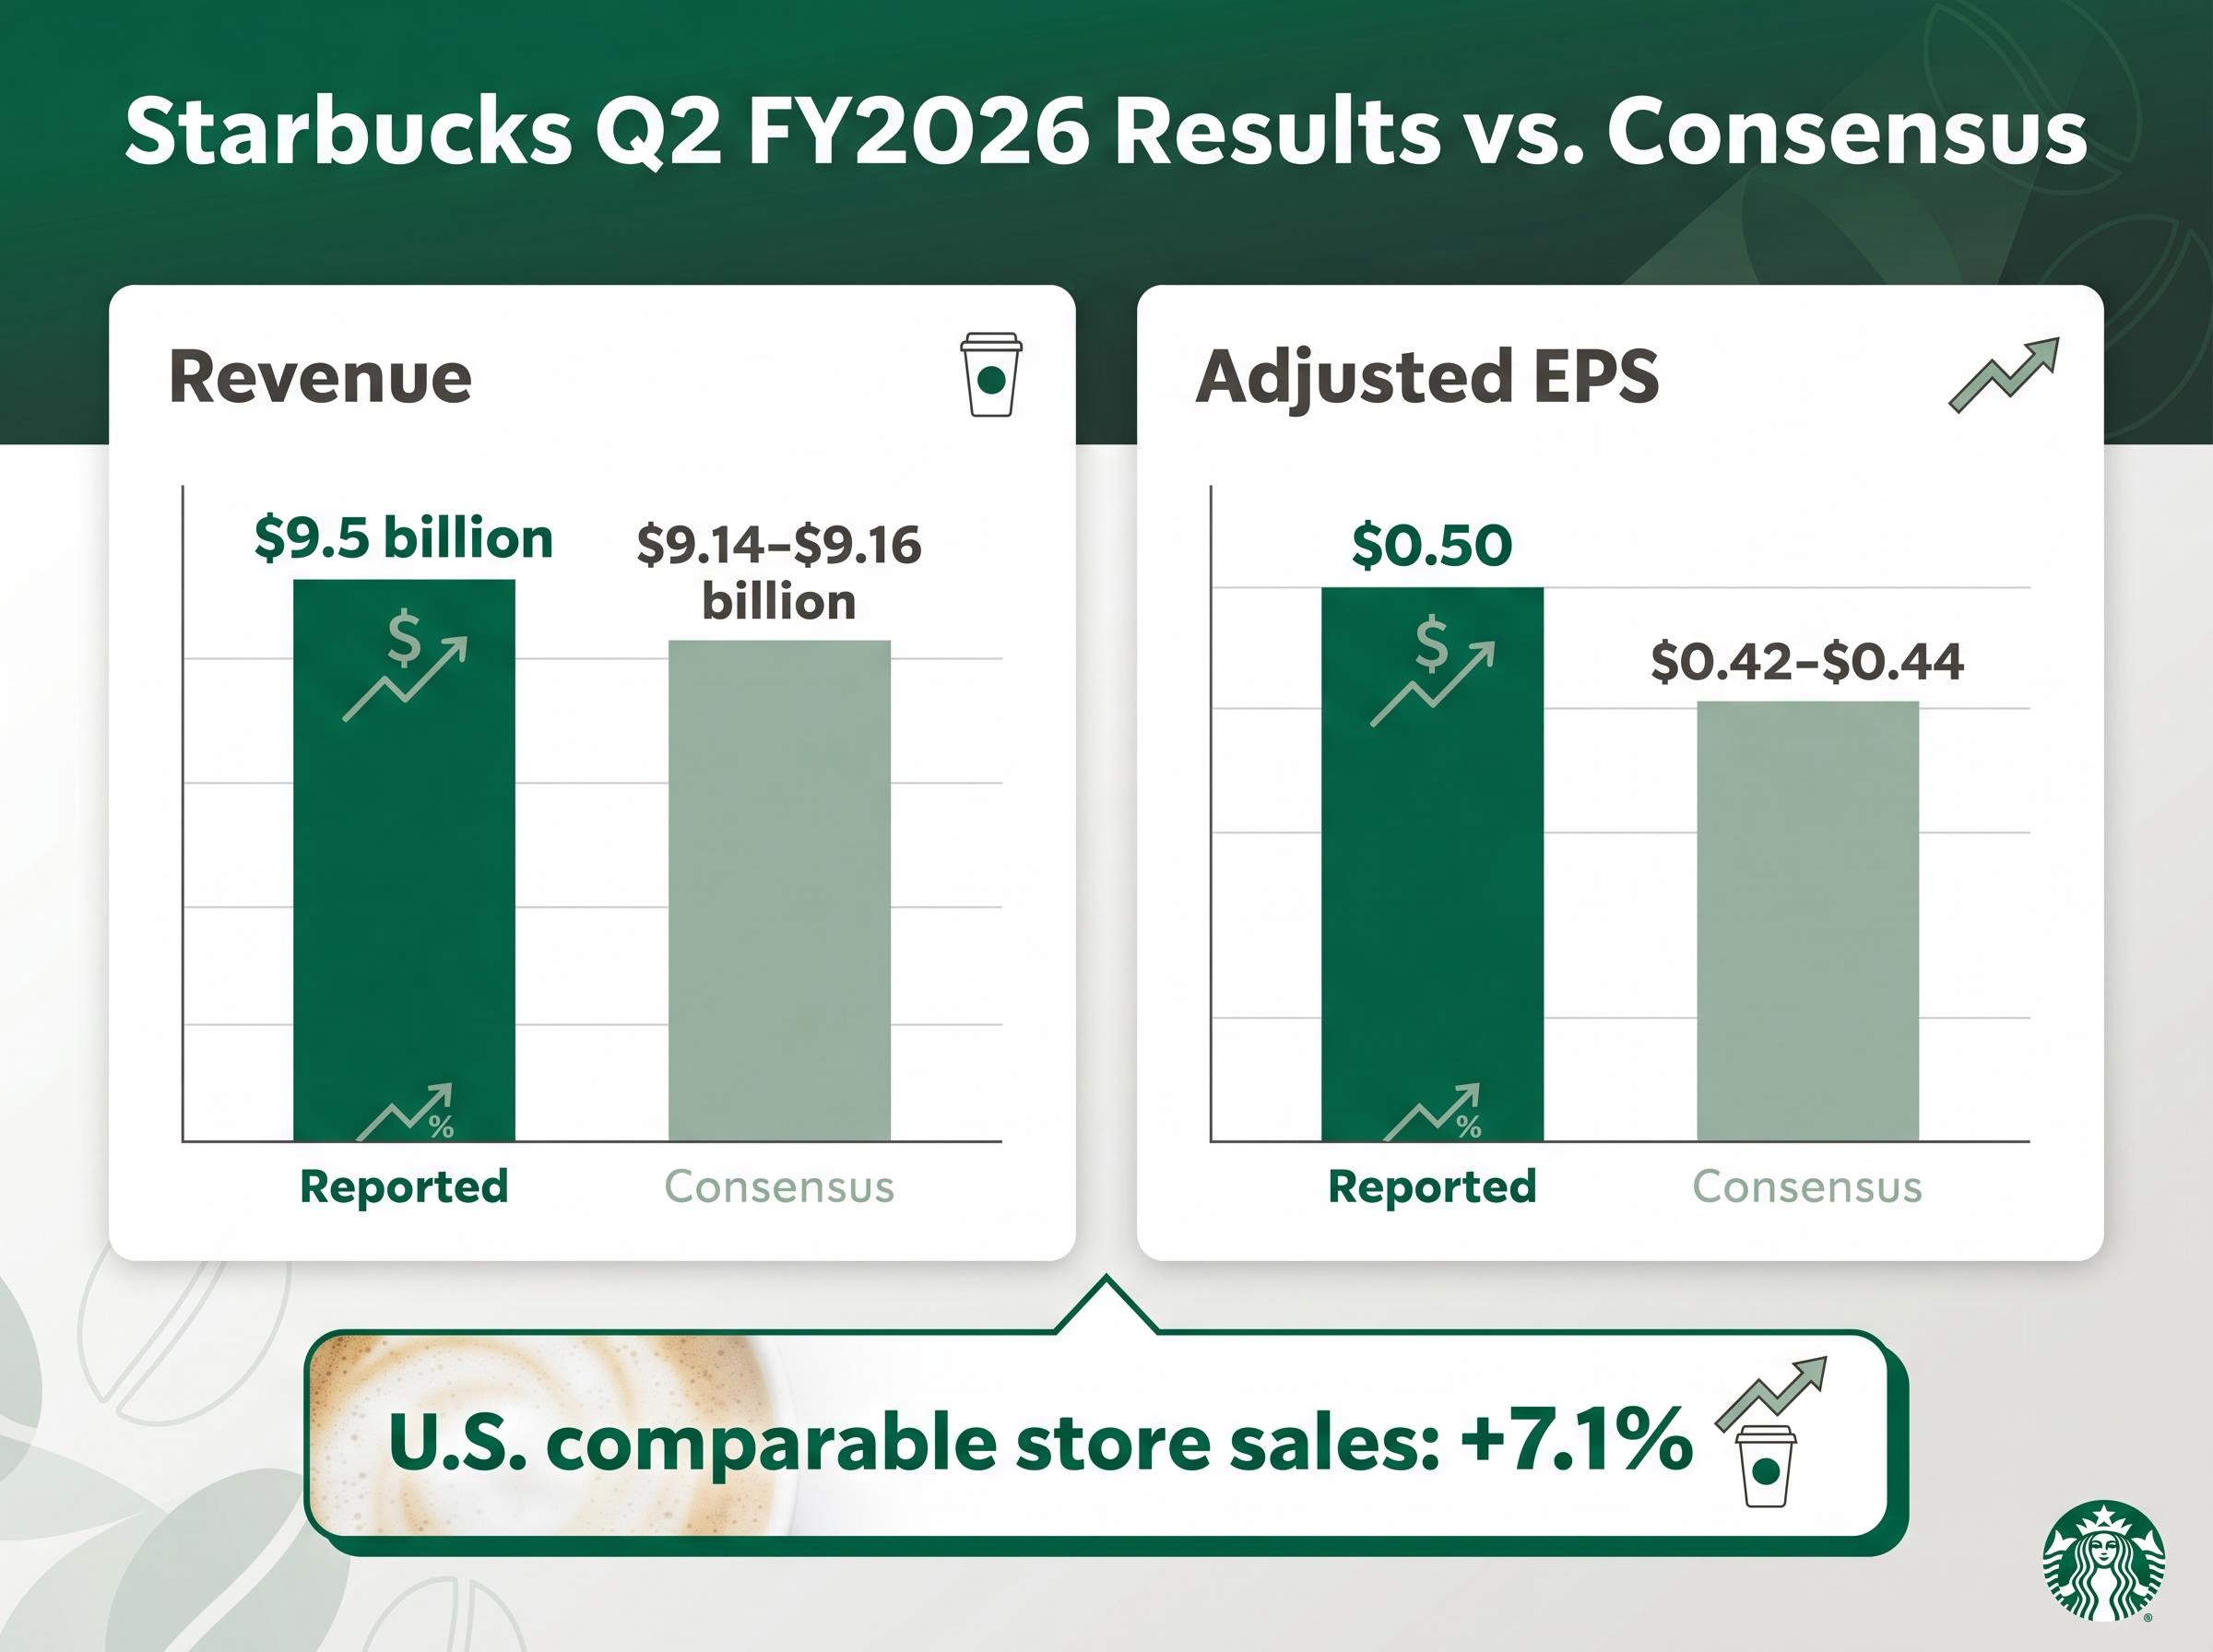
The gap between expectations and actuals was wide across every headline metric. Revenue came in at $9.5 billion, up 9% year over year, against a consensus estimate of approximately $9.14-$9.16 billion. Adjusted EPS hit $0.50, clearing the $0.42-$0.44 consensus range by a comfortable margin. GAAP EPS landed at $0.45, with net income of $510.9 million.
The Starbucks Q2 FY2026 earnings release confirmed revenue of $9.5 billion, adjusted EPS of $0.50, and U.S. comparable store sales growth of 7.1%, providing the primary financial record against which analyst estimates and consensus figures are measured.
| Metric | Reported | Consensus estimate |
|---|---|---|
| Revenue | $9.5 billion | $9.14-$9.16 billion |
| Adjusted EPS | $0.50 | $0.42-$0.44 |
| U.S. comparable store sales | +7.1% | Below reported figure |
Global comparable store sales rose 6.2%. U.S. comparable store sales grew 7.1%, the strongest domestic transaction reading in approximately three years. China delivered transaction-led comparable growth of 0.5%, marking its fourth consecutive quarter in positive territory.
The 7.1% U.S. comparable store sales figure breaks down further into a 4.4% transaction volume component, separating genuine traffic recovery from average ticket inflation and making the North American result read as demand-driven rather than price-driven.
According to Evercore, North America same-store sales growth improved 13 percentage points across the six most recent quarters, a trajectory that reframes this as a sustained recovery rather than a single-quarter anomaly.
SBUX shares closed at $102.28 on 28 April, up approximately 5.84% on the session.
The raw numbers point to a broad-based beat. The causal story behind them centres on Niccol’s three-pillar turnaround framework, each reinforcing the others to produce the transaction recovery that investors had been waiting to see.
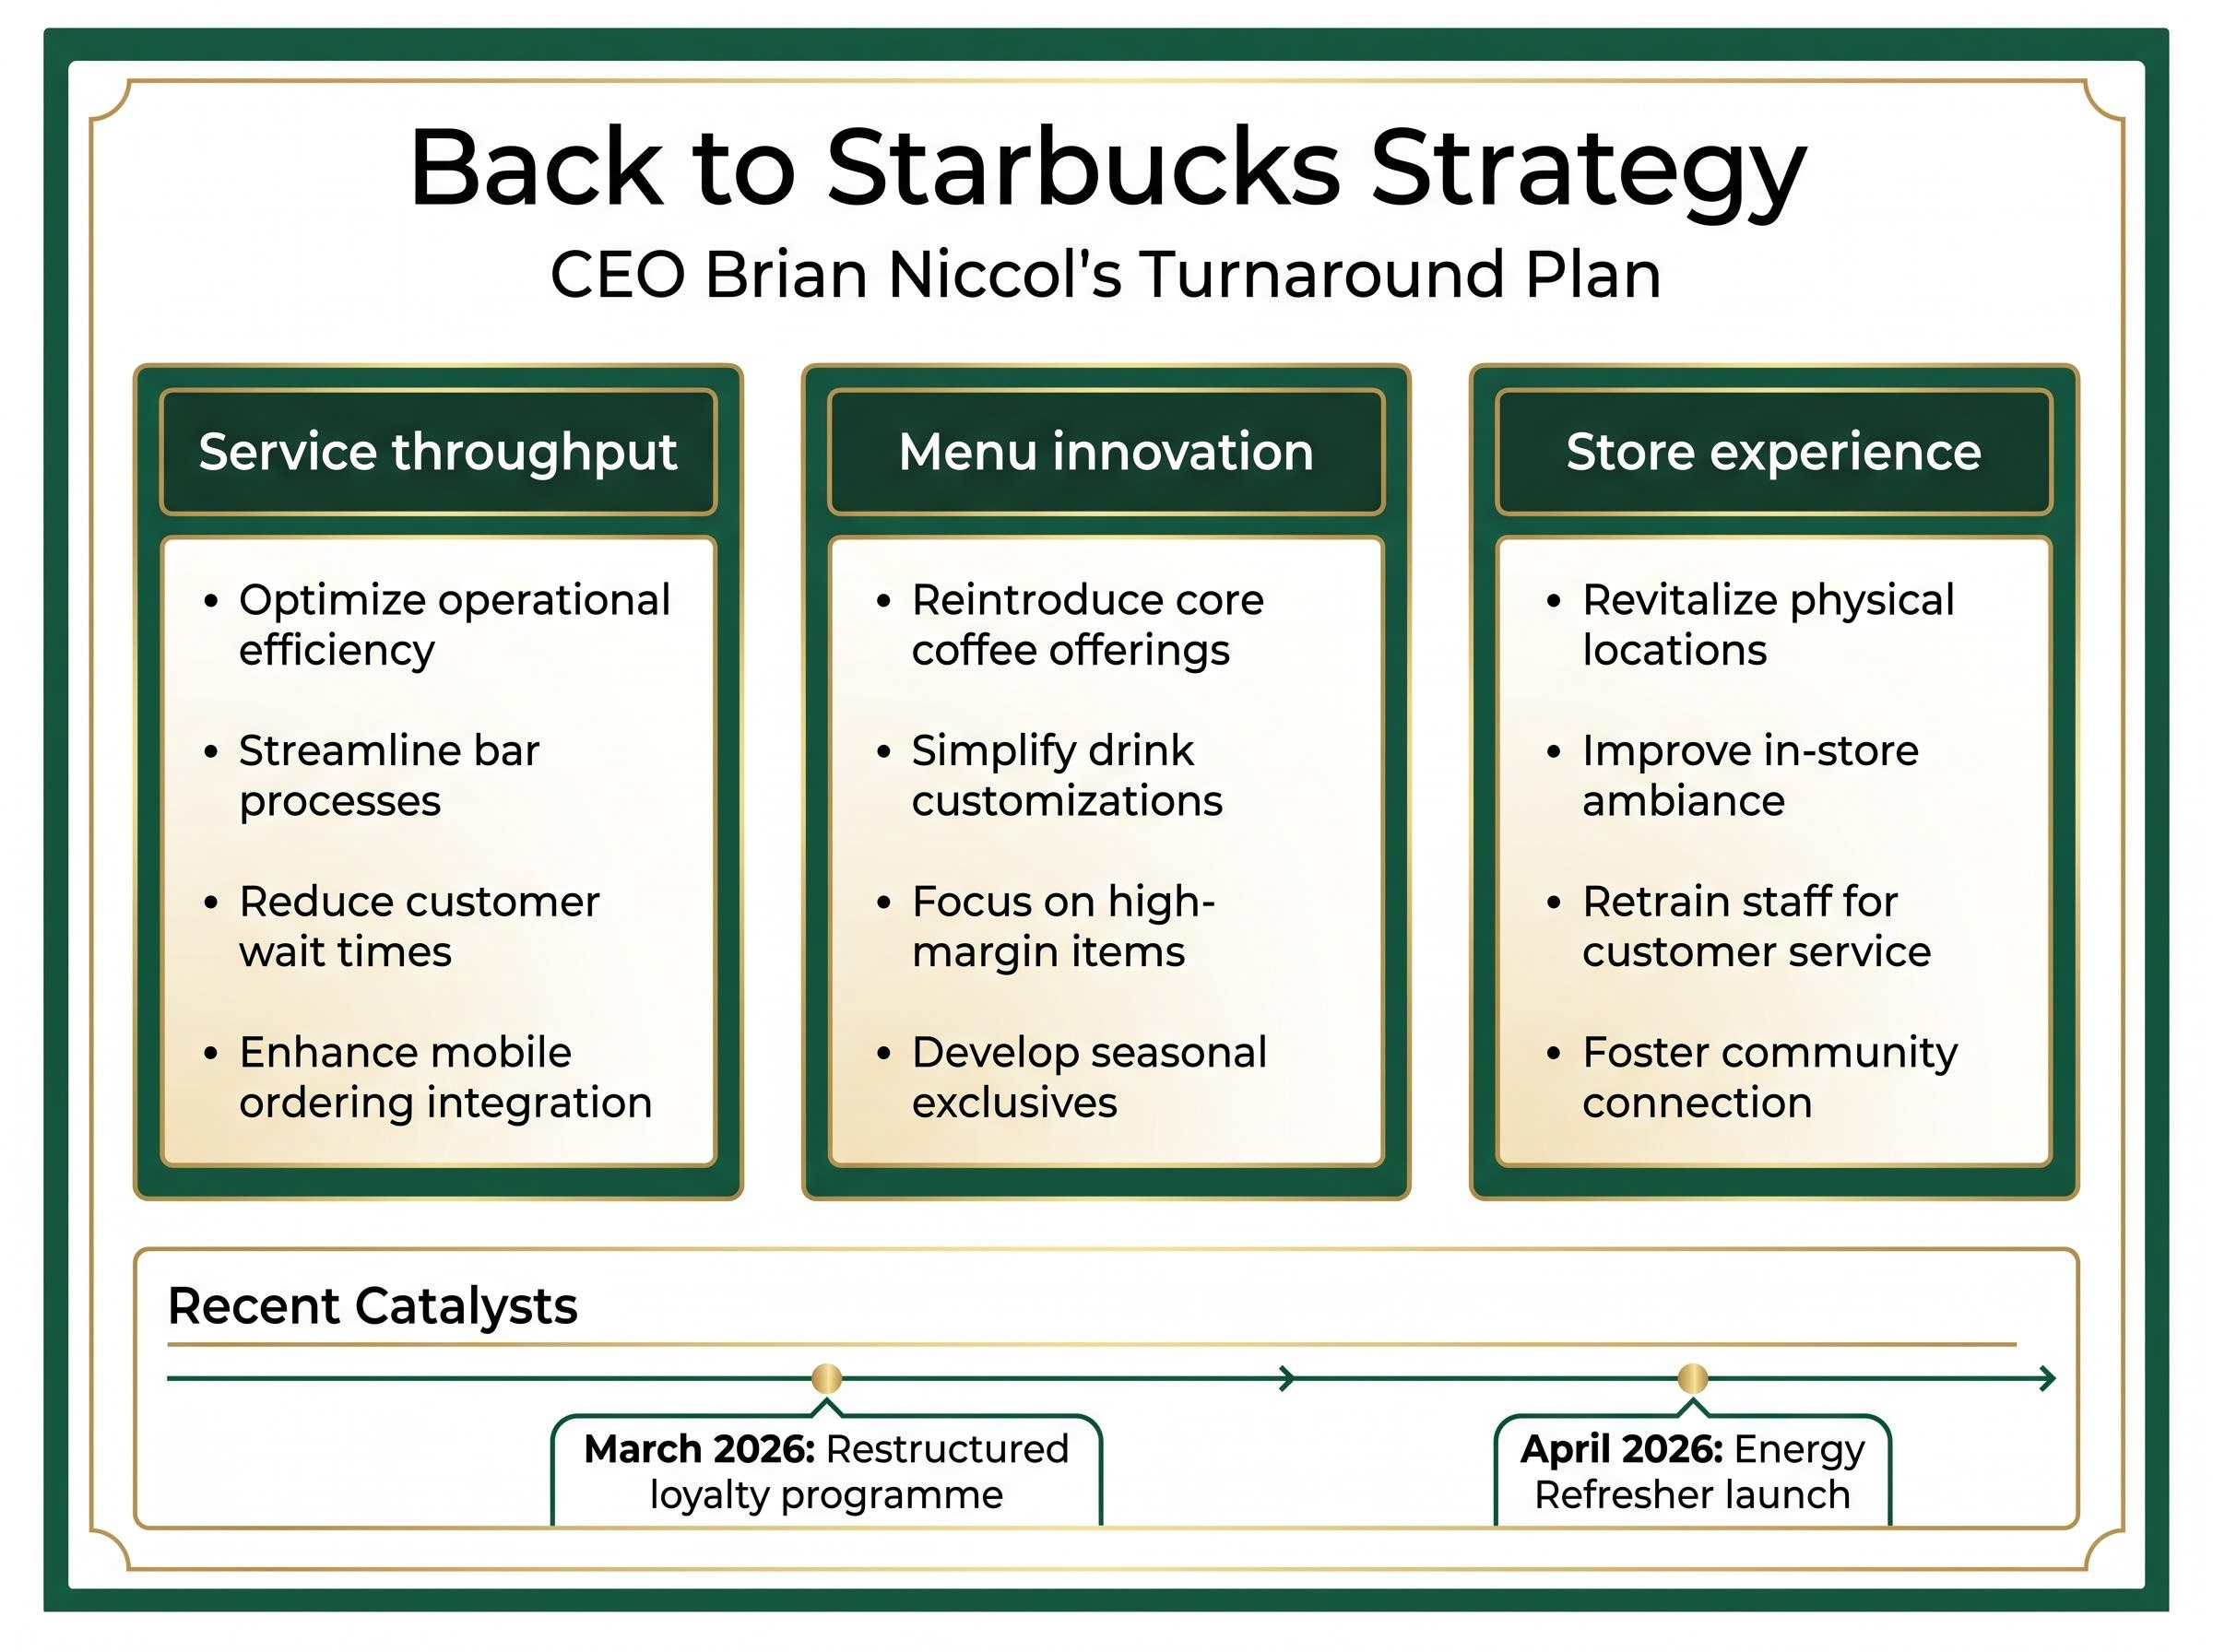
The “Back to Starbucks” strategy operates across three named areas:
Two specific, time-stamped catalysts anchored the Q2 performance. A restructured loyalty programme rolled out in March 2026, and early indications were described as “promising” by Wolfe Research. The Energy Refresher launch in April performed in line with or ahead of internal expectations, according to the same firm.
CEO Commentary Brian Niccol described Q2 as a “milestone quarter,” citing 9% revenue growth and 6% global comparable sales growth as evidence that the strategy is producing results at scale.
Management commentary indicated that North America momentum extended into April 2026, suggesting the transaction recovery has not yet plateaued. The distinction matters: investors tracking SBUX need to determine whether this is a demand bounce or evidence of a structurally improved business. The breadth of the beat, across regions and metrics simultaneously, leans toward the latter.
The Q2 results carried a second headline that may prove equally significant over a longer time horizon. Alongside the earnings beat, Starbucks announced a joint venture with Boyu Capital to accelerate expansion into China’s lower-tier markets, targeting more than 1,500 county-level cities.
China Daily coverage of the Boyu Capital joint venture details the strategic logic for targeting county-level cities, noting that lower-tier markets represent a largely untapped addressable base for Starbucks relative to its existing concentration in Tier 1 and Tier 2 urban centres.
Four consecutive quarters of positive comparable sales growth in China provided the stabilisation backdrop that made this announcement read as strategic rather than defensive. At 0.5% comparable growth, China is not yet a growth engine, but it is no longer a drag, and that distinction changes the calculus for committing to an expansion structure.
Management characterised the joint venture as margin accretive for the consolidated entity. Evercore’s modelling projects North America incremental margins exceeding 50% in FY2027, compared to an estimated negative 7% in FY2026, a swing that the China deconsolidation directly supports.
Deconsolidation is a change in how Starbucks reports its China segment. Beginning in Q3 FY2026, China revenues will no longer appear in the company’s consolidated top-line figures. Instead, the segment will be accounted for through the joint venture structure.
The practical timeline runs in three steps:
For investors reading year-over-year comparisons from Q3 onward, the change means reported revenue growth rates will reflect a smaller, higher-margin revenue base. This is not a reduction in the business; it is a change in how the business is measured on the income statement.
Starbucks raised its full-year FY2026 guidance on both comparable sales and earnings per share. The revision was not marginal.
Prior comparable sales guidance called for growth above 3%; the new target is above 5%. The EPS range moved from $2.15-$2.40 to $2.25-$2.45. Net new store openings guidance held at 600-650 globally.
The upgrade signals management conviction, but the more telling figures sit in the multi-year analyst estimates that followed the report. Evercore raised its price target to $115 from $110, maintaining an Outperform rating, and laid out an EPS ladder of $2.45 for FY2026, $3.25 for FY2027, and $4.00 for FY2028. The firm expects cumulative productivity savings to reach $2 billion by FY2028.
Wolfe Research revised estimates upward but arrived at more conservative numbers: $2.37 for FY2026, $2.99 for FY2027, and $3.65 for FY2028.
| Firm | FY2026 EPS | FY2027 EPS | FY2028 EPS |
|---|---|---|---|
| Evercore | $2.45 | $3.25 | $4.00 |
| Wolfe Research | $2.37 | $2.99 | $3.65 |
Evercore projects North America incremental margins exceeding 50% in FY2027, compared to an estimated negative 7% in FY2026, a swing that underpins the most optimistic multi-year EPS scenarios.
The gap between those two firms illustrates where the debate sits. Both agree the trajectory has inflected. They disagree on how much margin flow-through materialises, and when. The conditions attached to the bull case include labour cost comparisons easing, coffee commodity inflation moderating, and productivity savings ramping on schedule.
The investment thesis, at current prices, is being built on recovery expectations well beyond the current fiscal year. The FY2026 guidance range is the floor; the FY2027-2028 projections are where the real valuation work is happening.
For investors wanting to work through the specific assumptions behind the FY2027-2028 EPS projections, our dedicated guide to Starbucks margin recovery mechanics covers the 340 basis point operating margin expansion required, the loyalty membership data supporting the demand thesis, and why the gap between Evercore’s $4.00 and Wolfe Research’s $3.65 FY2028 EPS estimates implies roughly a $10 difference in price target at current multiples.
A 5.84% single-session gain on a $116 billion market capitalisation company is not a low-conviction move. SBUX closed at $102.28 on 28 April, having traded in a range of approximately $98.61-$102.60 in the days prior.
The stock entered earnings with analyst price targets spanning $76 to $124 and consensus upside of roughly 2.2%. JPMorgan had raised its target to $100 on 24 April, just four days before the report. Evercore’s post-earnings revision to $115 and Wolfe Research’s upward estimate adjustments widened the bull-case ceiling. Pre-market trading on 29 April held stable around $102.28.
Three specific data points appear to have driven the market’s response: North America transaction growth confirming the turnaround thesis, China stability removing a downside overhang, and a guidance raise large enough to signal management conviction rather than conservatism.
The unresolved variables that analysts have flagged going forward include:
These are the conditions the market is watching. The Q2 beat answered the top-line question. The margin question is next.
Q2 FY2026 delivered the strongest evidence to date that the “Back to Starbucks” strategy has operational traction, not merely narrative momentum. Revenue, EPS, and comparable store sales all cleared expectations by meaningful margins, and the China JV announcement added a structural dimension to the recovery story.
The recovery, however, remains a two-stage thesis. Stage one, the top-line inflection, is now visible in the data. Stage two, the margin flow-through that supports FY2027-2028 EPS projections of $3.00-$4.00, depends on labour costs, commodity prices, and productivity savings arriving on schedule.
Near-term watchpoints for investors include Q3 FY2026 results (the first quarter reflecting China deconsolidation in reported figures), the labour cost comparison lap in H2, and progress toward cumulative productivity savings targets.
This article is for informational purposes only and should not be considered financial advice. Investors should conduct their own research and consult with financial professionals before making investment decisions. Past performance does not guarantee future results. Financial projections are subject to market conditions and various risk factors.
Starbucks reported Q2 FY2026 revenue of $9.5 billion (up 9% year over year), adjusted EPS of $0.50, and U.S. comparable store sales growth of 7.1%, all beating analyst consensus estimates by meaningful margins.
The Back to Starbucks strategy is CEO Brian Niccol's turnaround framework focused on faster service throughput, menu innovation, and improved store experience. Q2 FY2026 results, including the strongest North American transaction growth in roughly three years, suggest the strategy is producing measurable financial improvement.
Starbucks announced a joint venture with Boyu Capital to expand into more than 1,500 county-level cities in China, with China operations set to be deconsolidated from reported financials beginning Q3 FY2026, which management characterised as margin accretive for the consolidated entity.
Starbucks raised its FY2026 comparable sales growth target from above 3% to above 5%, and lifted its adjusted EPS guidance range from $2.15-$2.40 to $2.25-$2.45, while maintaining net new store opening guidance of 600-650 globally.
Evercore projects Starbucks EPS of $3.25 for FY2027 and $4.00 for FY2028, while Wolfe Research offers more conservative estimates of $2.99 for FY2027 and $3.65 for FY2028, with the gap reflecting disagreement over the pace and scale of margin recovery.