#
Here is a number that looks like a strong argument for active management: more than half of surviving active funds in the Australian emerging-markets category beat their passive peers over the 10 years to 30 June 2026. On its own, that figure tells you skilled managers can win. Now hold that thought for a second, because the same category tells a very different story once you count the funds that quietly closed. The full-universe success rate was just 37%.
That gap is not a rounding error or an isolated quirk. It is a structural feature of how fund performance data gets assembled and reported, and it appears across the whole active-versus-passive comparison you are likely to encounter. Morningstar’s 2026 Australian Active/Passive Barometer, covering more than 800 strategies across nine categories, provides the category-level data that makes the distortion visible rather than theoretical.
This matters because investors weighing active against passive are routinely shown survivor-only figures without being told that is what they are looking at. After reading this, you will know exactly which questions to ask about any fund performance figure you are handed, and why the methodology behind a number often matters as much as the number itself.
What survivorship bias actually does to the numbers
Survivorship bias is not a maths trick you need a statistics degree to follow. It is a sequence of events, and it happens the same way every time.
A fund underperforms its benchmark, often for years. Its manager, facing withdrawals and thin fees, decides to shut it down or fold it into another product. Once that happens, the fund’s poor track record typically vanishes from databases and marketing materials, leaving behind only the records of funds that survived.
Here is the mechanism in three steps:
- A fund delivers weak returns and loses assets.
- The manager closes or merges it rather than carry a visible poor record.
- Its performance history disappears from the visible sample.
The consequence is the important part. Closed funds are disproportionately the weak performers, so removing them lifts the apparent average quality of everything that remains. A performance table built only from surviving funds is not a representative sample of what active management delivered. It is a curated list of the funds that did not fail.
The scale of that removal is easy to underestimate. According to Lorica Partners, 57% of Australian-managed funds, both domestic and international, were shut down or merged over the past 15 years. SPIVA Australia data points to a similar figure, with more than half of all funds across categories merging or closing over the same 15-year horizon.
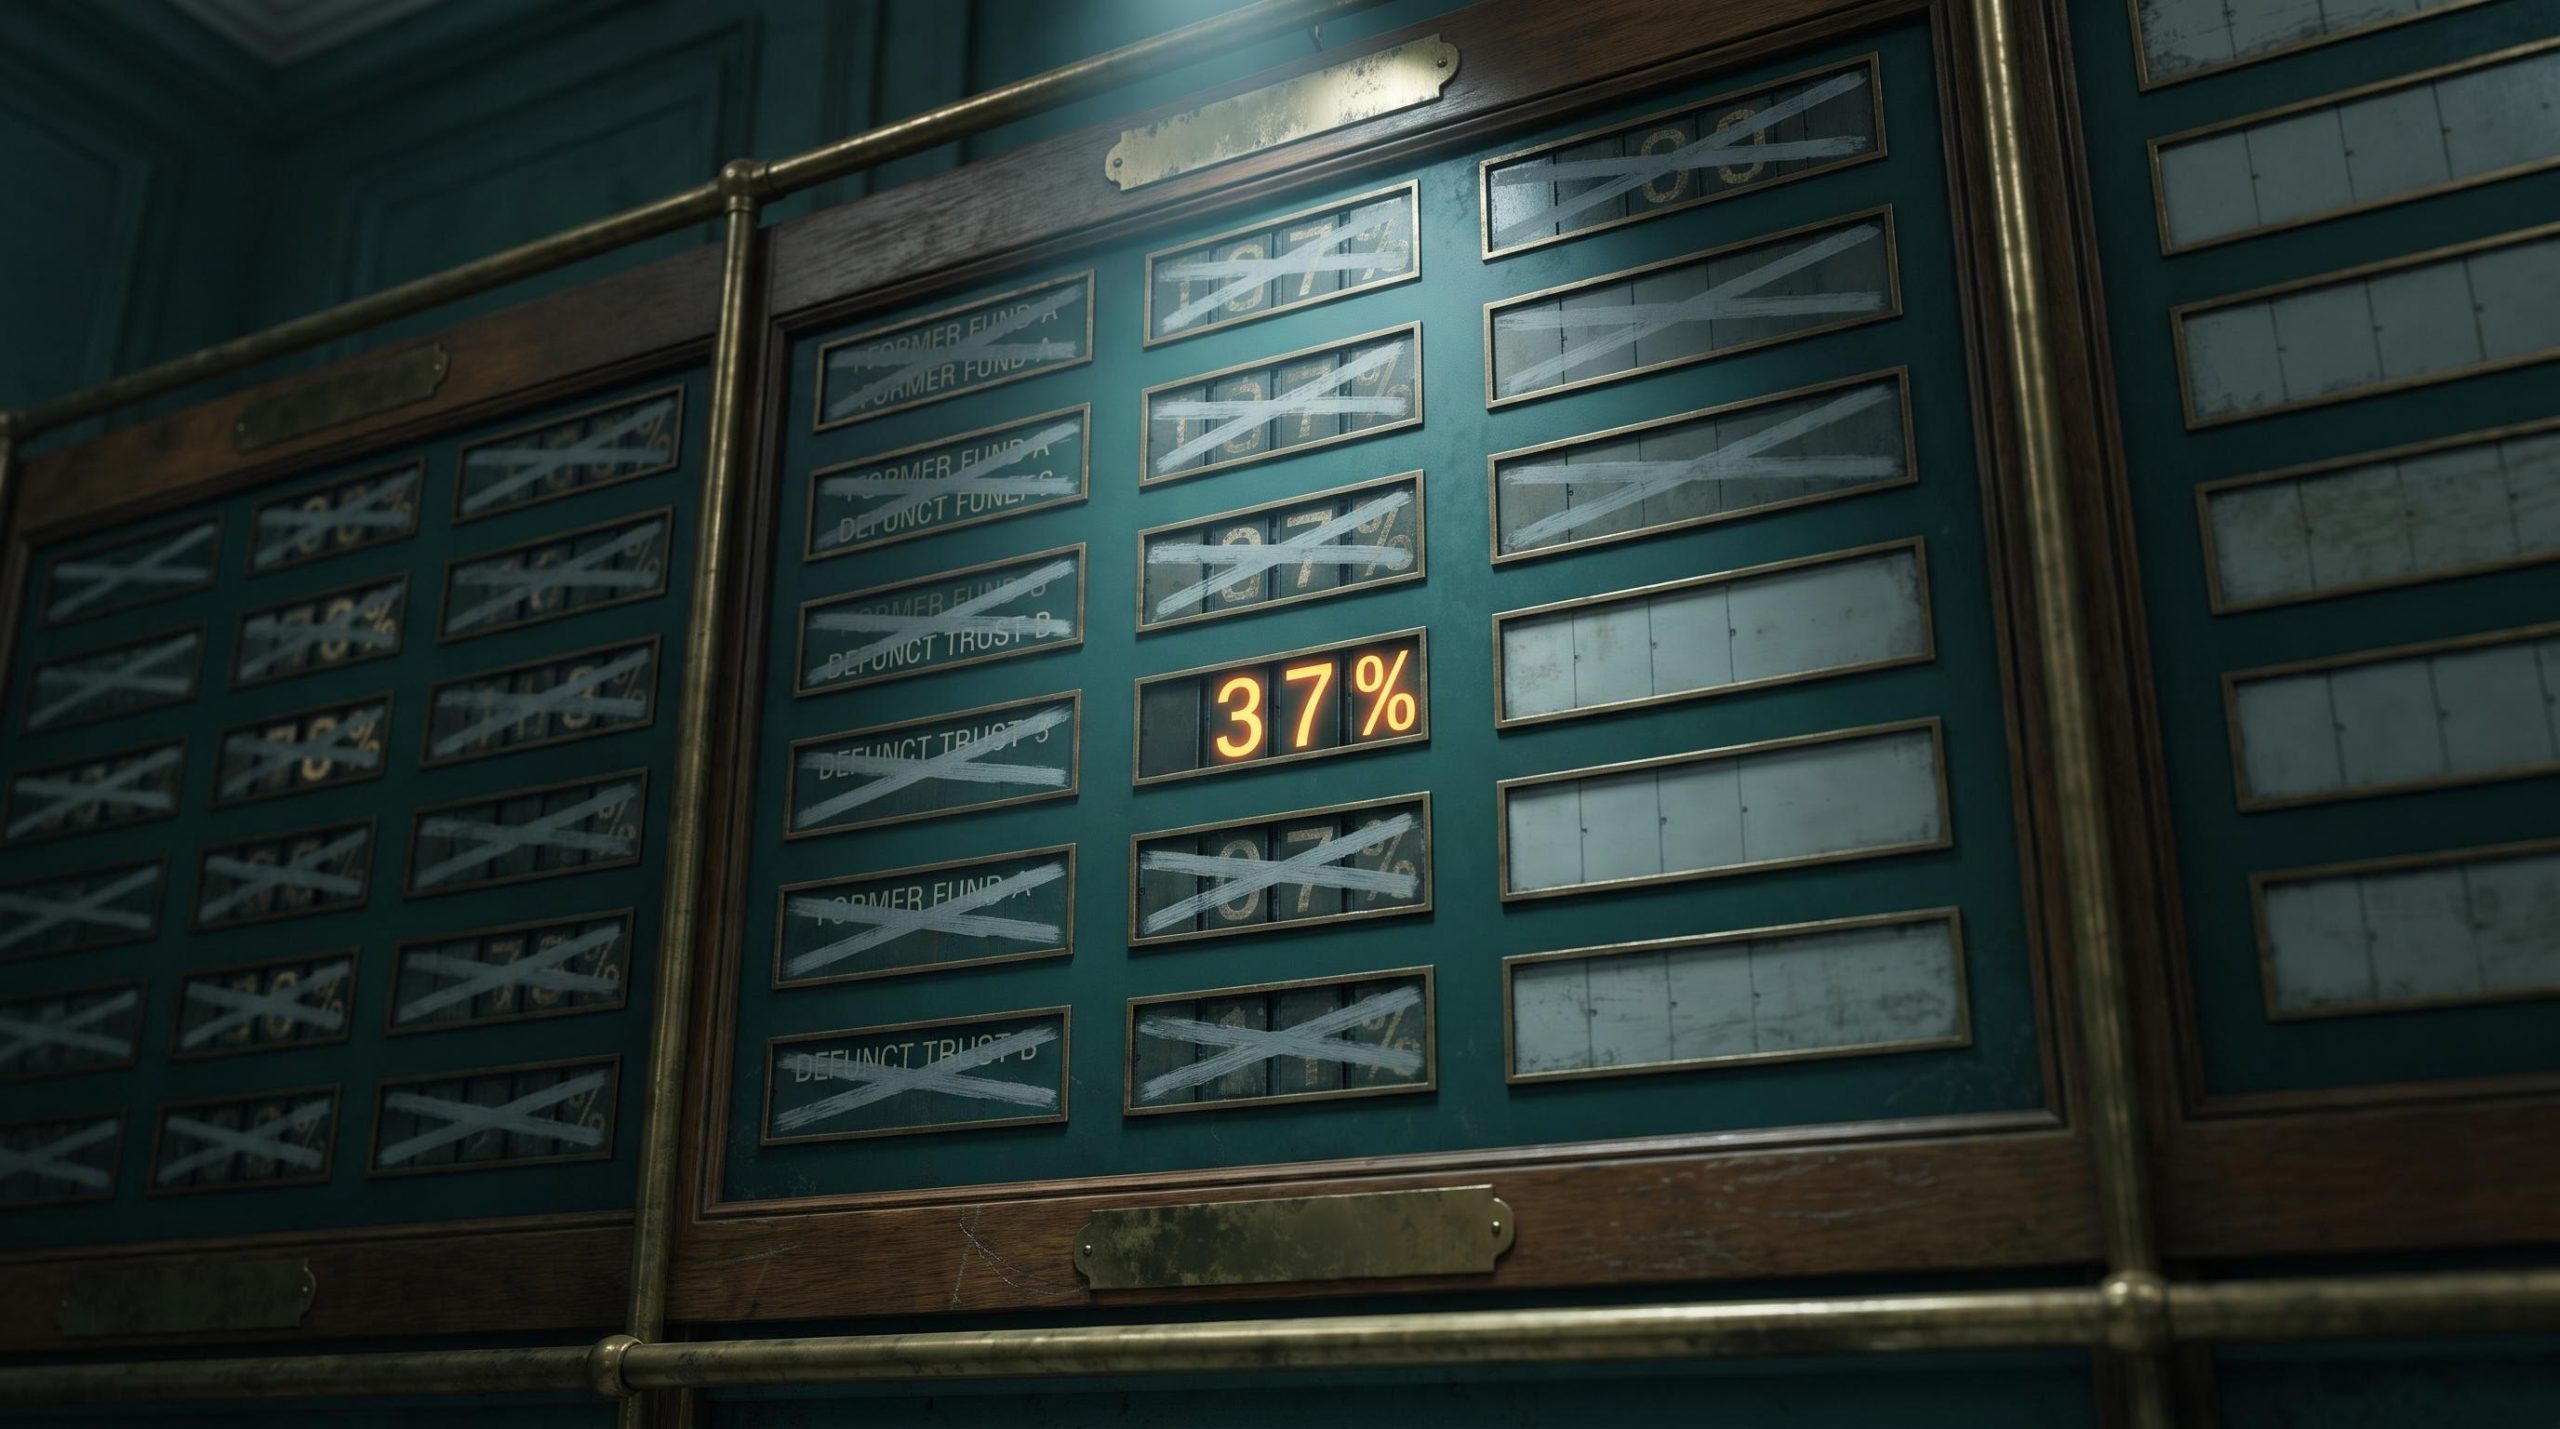
The disappearing majority Lorica Partners: 57% of Australian-managed funds were closed or merged over 15 years. Most of what failed is simply no longer in the visible record.
This is precisely why the source of a figure matters. SPIVA Australia includes every fund present at the start of each measurement period as its denominator, which is what separates a survivorship-adjusted study from a commercial database that only lists what is still trading. Morningstar’s Barometer explicitly acknowledges that passive strategies hold a structural advantage in survivorship, independent of raw return generation.
The category-level picture becomes clearer when you zoom out to the full Australian market: active vs passive investing data across all major categories shows that long-horizon underperformance is not confined to any single asset class, with 87% of Australian Equity General funds trailing the benchmark over 15 years.
When more than half of the original fund universe vanishes over 15 years and only the survivors reach the performance tables, any active-versus-passive comparison you run on those tables is a comparison of a pre-filtered sample. The filter is not random. It removes the worst outcomes first, which is exactly what you would need to see to judge the category fairly.
When big ASX news breaks, our subscribers know first
The emerging-markets case study: one category, two completely different stories
Take the survivor-only number first. In Morningstar’s 2026 Barometer, more than half of surviving active emerging-markets strategies beat their passive alternatives over the 10 years to 30 June 2026. Read in isolation, that is a genuine endorsement of active management in the category.
Now add the funds that closed during the period. The full-universe success rate drops to 37%.
That 13-percentage-point gap is survivorship bias doing its work in a single observable category. Nothing about the surviving managers changed between the two figures. The only difference is whether the funds that failed and closed are counted in the denominator, and when they are, the majority-wins story becomes a minority-wins story.
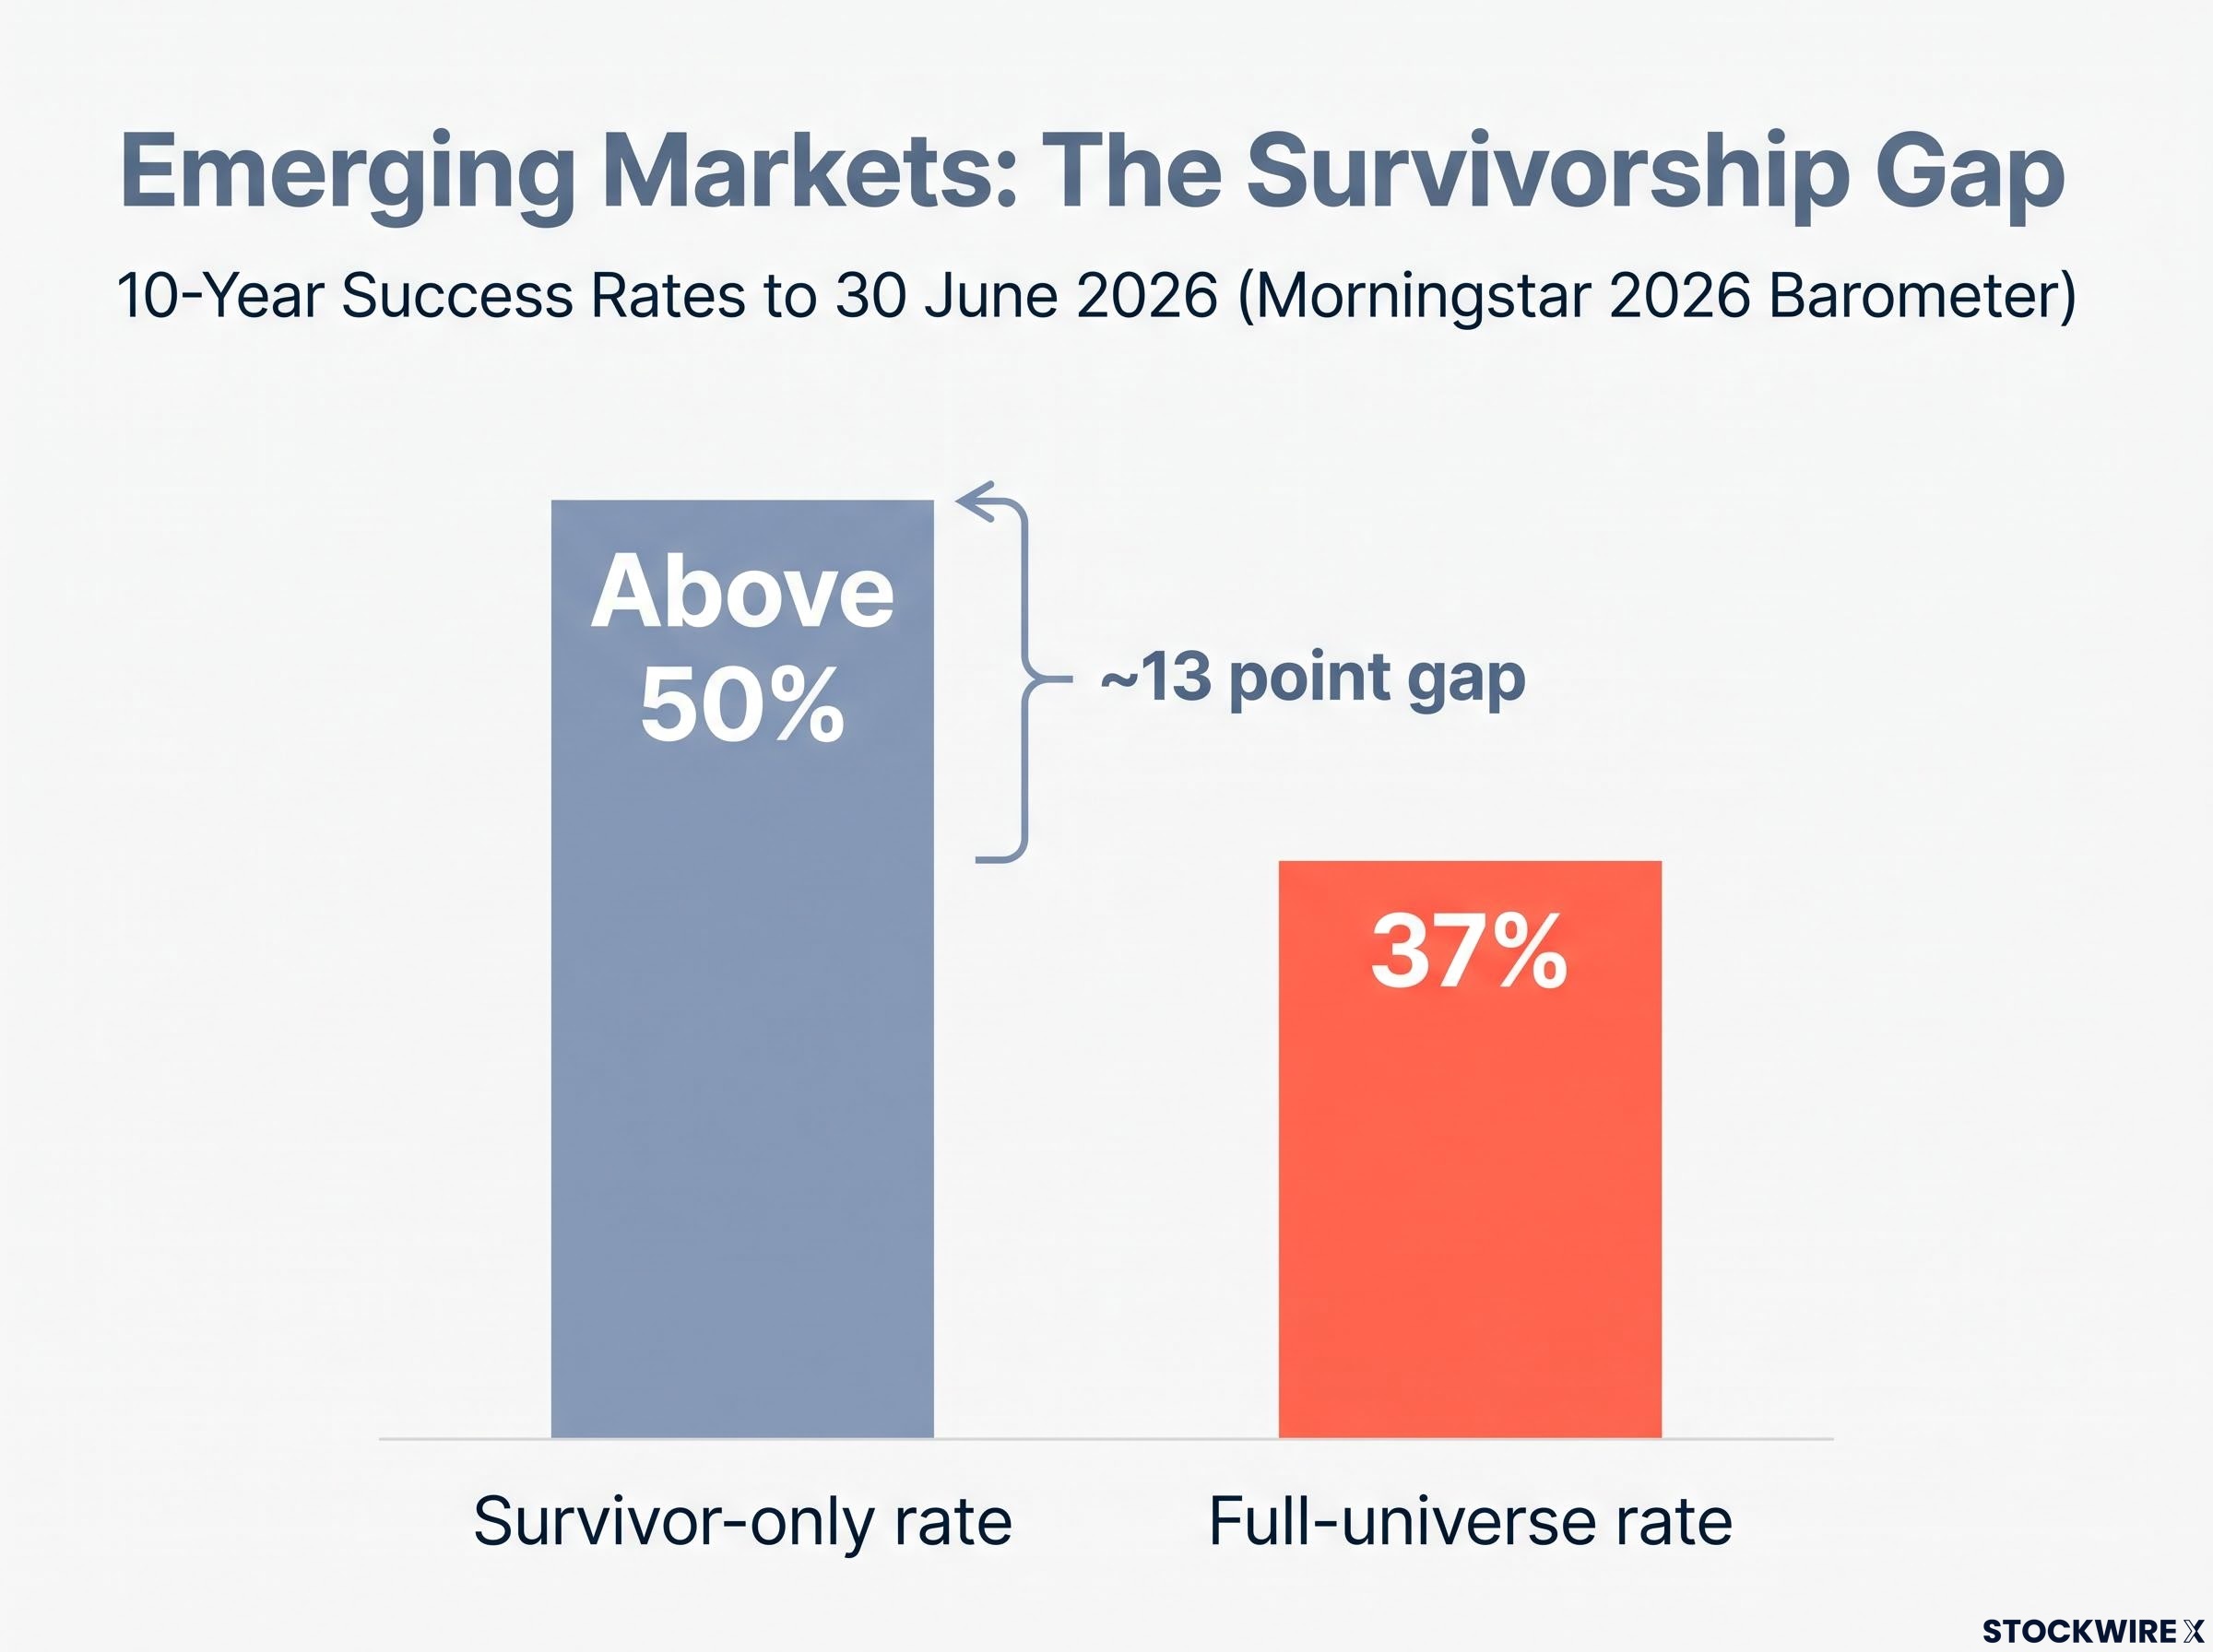
Two figures, one category Survivor-only success rate: above 50% Full-universe (survivorship-adjusted) rate: 37% The gap is closed funds, removed from view.
| Category | Survivor-only rate | Full-universe rate | Gap |
|---|---|---|---|
| Emerging markets (10-year) | Above 50% | 37% | ~13 points |
| Australia Equity Income (10-year) | Not separately reported | Fell from 52% to 9% in one year | See note below |
There is nuance worth holding onto here. Even the adjusted 37% places emerging markets among the stronger active categories in the study. Morningstar’s July 2022 Guide to Emerging Markets notes that active managers tend to have the most success in inefficient markets, where wide dispersion between winners and losers rewards genuine skill more than it does in Australian large-cap equities. So the survivorship-adjusted number is still respectable, just far less flattering than the survivor-only version implied.
The survivorship-adjusted case for active management is not uniformly weak across every asset class: active bond managers in Australia have outperformed passive alternatives in the majority of years since 2023, driven by structural inefficiencies in over-the-counter debt markets that do not exist in large-cap equities.
The Australia Equity Income category shows how volatile these long-horizon figures can be. Its 10-year active success rate collapsed from 52% in June 2025 to 9% in June 2026, a single year in which dividend-focused passive indexes ran hot and a handful of severely weak active funds dragged the average down. One bad 12-month window rewrote a decade’s worth of published data.
If you had screened only the surviving emerging-markets funds in 2026, you would have walked away convinced active management works in the category. The full picture shows that conclusion rested entirely on ignoring 13 percentage points worth of failed funds. That is the practical cost of not asking whether the dead funds are in the number.
Why the distortion is built into how fund data is assembled and marketed
The reason survivorship bias never quite goes away is that the incentive creating it never goes away either.
A fund manager sitting on a persistently poor product has a rational commercial reason to close or merge it rather than keep advertising a bad track record. Every time that happens, a weak record leaves the visible universe and the remaining average ticks up. This is not deception. It is ordinary business behaviour that continuously refreshes the distortion rather than letting it correct over time.
Three mechanisms embed the bias into the data you actually see:
- Fund closures remove weak records. When a poor performer shuts, its history typically drops out, so the surviving group looks stronger than the original group ever was.
- Commercial databases list current funds only. Rank tables and “best performer” lists are usually built from funds still trading, which structurally tilts them toward survivors.
- Ranking tables calculate percentiles from the surviving universe. Percentile standings shift depending on whether closed funds are added back into the count.
The methodology-serious studies handle this deliberately. SPIVA uses every fund present at the start of a period as its denominator. Morningstar’s Active/Passive Barometer retains the historical returns of closed funds rather than dropping them. Both choices exist specifically to stop the surviving-fund tilt from flattering active managers.
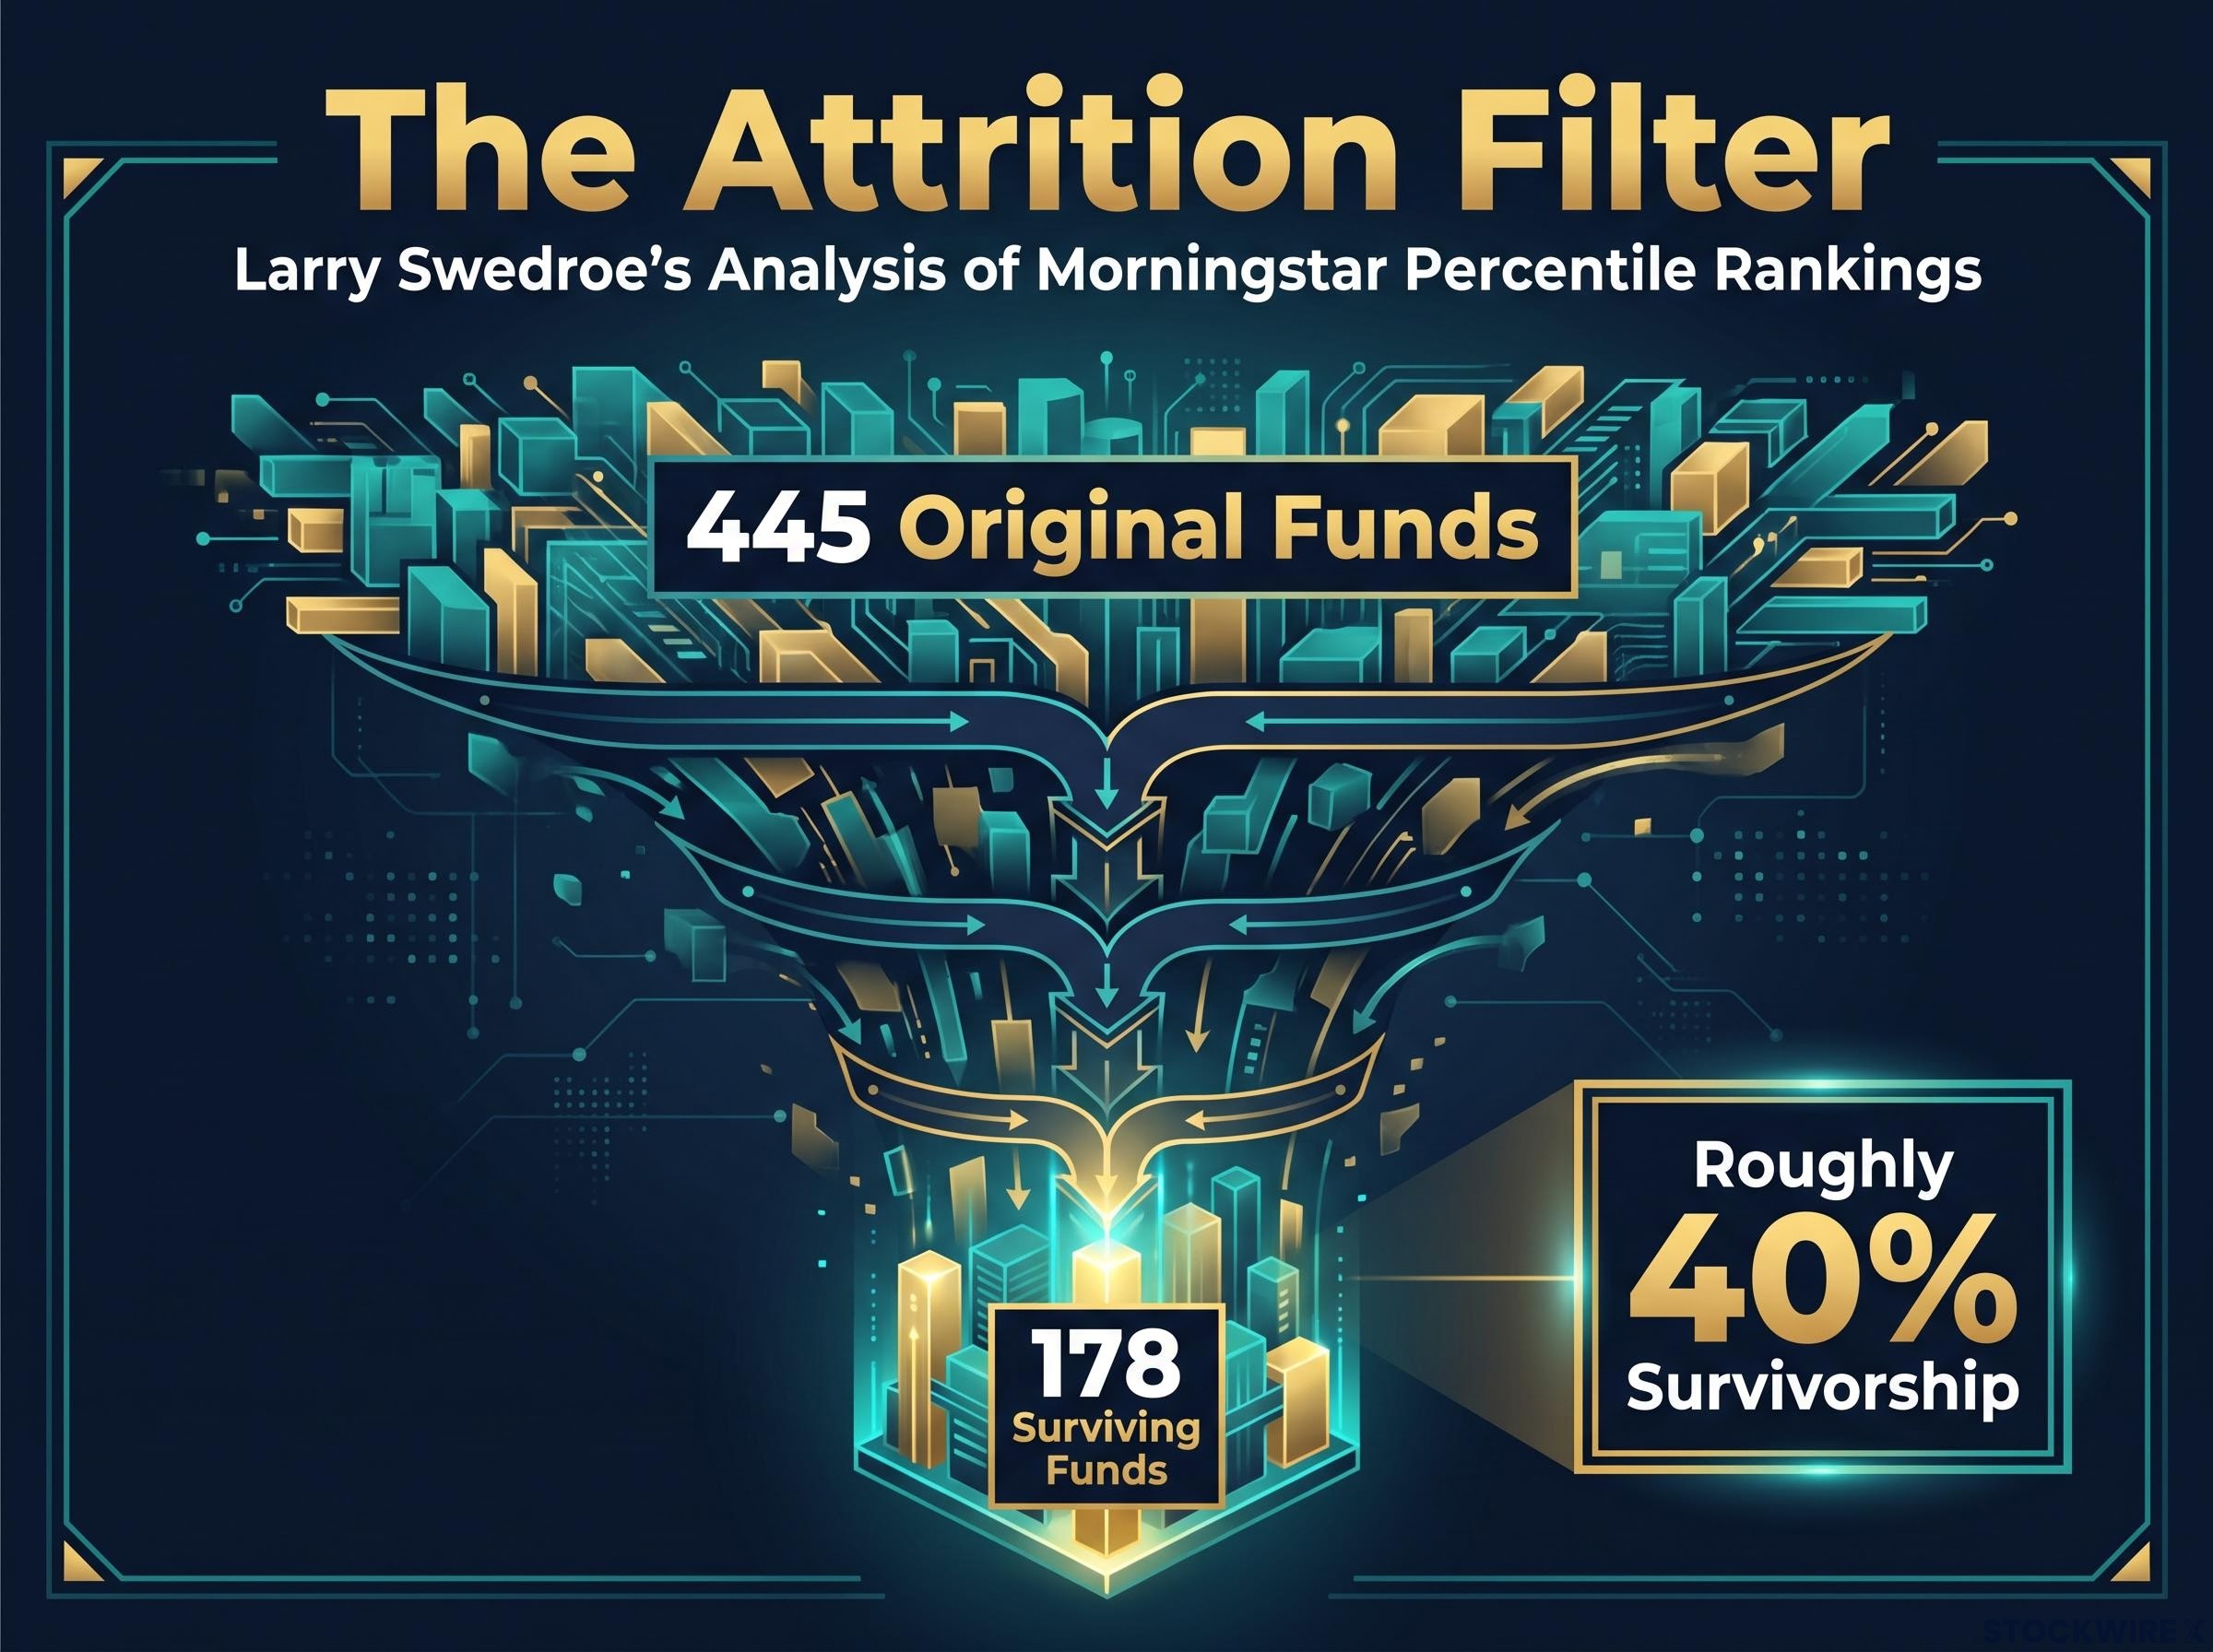
The scale of the effect is easy to see in a worked example. Larry Swedroe’s analysis of Morningstar percentile rankings describes a category that began with 445 funds but had only 178 still surviving, roughly 40% survivorship. Once the absent funds were added back, the comparison between passive and active peers shifted materially, because the missing funds were mostly weak ones propping up the survivors’ apparent standing.
The superannuation dimension
This is consequential enough to reach policy. Vanguard Investments Australia, in submission DR229 to the Productivity Commission inquiry into superannuation efficiency, warned that compounding average annual returns from surviving funds to build 10-year projections is “problematic” precisely because of survivorship and selection bias baked into the early years of the data.
The Productivity Commission superannuation inquiry found systemic issues with how long-term fund performance is measured and reported, conclusions that sit directly beneath the Vanguard submission’s warning about compounding returns from surviving funds into superannuation projections.
Attrition is a steady drip, not a rare event. SPIVA data show Australian Equity General one-year survivorship of 97.55% at Mid-Year 2025 and 96.13% at Year-End 2024, implying continuous annual closures even in calm markets. Closure rates also swing sharply by category: A-REIT funds saw a 7% liquidation rate in 2025.
Because the incentive to close weak funds is permanent, survivorship bias is not an artefact sitting in old data. It is being freshly introduced into current databases every year, which means the problem does not shrink just because you switch to more recent figures. The right question is never whether the bias is present. It is how much of it the specific source you are reading has corrected for.
How to read active versus passive data without being misled by it
Knowing the bias exists is one thing. Having a repeatable checklist for the next performance figure you are shown is what actually protects you.
Start with the source. Survivorship-adjusted studies, meaning SPIVA Scorecards and Morningstar’s Active/Passive Barometer, are the right starting point because they define the denominator as every fund that existed at the period’s start, not just those still alive at the end.
Then accept an uncomfortable truth: even after that adjustment, most Australian active funds still lag over long horizons. SPIVA data show 71% of Australian Equity General funds underperformed the S&P/ASX 200 in the first half of 2025, and 85% underperformed over 15 years. Survivorship bias inflates the gap, but it does not create it. Fees and market efficiency do the rest.
The horizon that matters SPIVA: 85% of Australian Equity General funds underperformed over 15 years. Lorica: 44% of Australian equity managers outperformed the ASX 200 in 2024. The same category, read over one year versus fifteen, gives you two contradictory impressions.
Weighting and category definition matter just as much. A figure can be equal-weighted or asset-weighted, and the two answer different questions. Emerging-markets managers operate in a structurally different environment than Australian large-cap managers, so aggregating the two conceals more than it reveals.
Here is the checklist to apply to any active-versus-passive figure you meet:
- Does this figure include the funds that no longer exist, or only the survivors?
- What time horizon does it cover, and is that horizon long enough to be meaningful?
- Is it equal-weighted or asset-weighted?
- Does the category definition match the specific fund you are evaluating?
- Is this a short-term outperformance rate being presented as if it were structural?
That last question is where short-term figures mislead. Lorica’s 44% outperformance rate for 2024 looks encouraging until you place it beside the 15-year figure, where only around 15% of funds beat the index. Vanguard’s guidance reinforces the point: long-term projections built on surviving-fund returns overstate the reliability of active outperformance, and superannuation compounding amplifies that error across decades.
| Source | Horizon | Universe | Active underperformance |
|---|---|---|---|
| SPIVA | H1 2025 | Survivorship-adjusted | 71% |
| SPIVA | 15 years | Survivorship-adjusted | 85% |
| Lorica | 2024 (1 year) | Survivorship-adjusted | 56% (44% outperformed) |
| Morningstar 2025 Barometer | Multiple periods | Survivorship-adjusted | 52% (48% success rate) |
None of this means outperformance is impossible. The 2026 Barometer found top-quartile active managers in seven of nine categories still generated positive excess returns over 10 years. The challenge is not that skill does not exist. It is identifying those managers in advance, which is impossible if the data you are using has already hidden the failures. Treat any active fund figure as incomplete until you know whether dead funds are included, what horizon it covers, and whether the category is specific enough to mean anything.
For investors ready to apply these principles to a specific fund selection decision, our dedicated guide to managed fund due diligence walks through a structured three-layer framework covering fee compounding, manager credentials, and strategy verification, including how to check ASIC licence status before committing capital.
What this means before your next fund decision
Pull the threads together and the picture is coherent. Survivorship bias is a real, quantifiable distortion. The emerging-markets case makes it concrete, the closure incentive keeps it alive year after year, and survivorship-adjusted sources give you a reliable way to control for it.
What the bias does not do is invent the active-versus-passive gap. Even after adjustment, most Australian active categories underperform over long horizons, which means survivorship bias inflates the problem without being its root cause. Fees and market efficiency carry much of the weight.
The fee impact on fund success rates is large enough to be decisive on its own terms: Morningstar Australia found cheapest-quintile multisector growth funds achieved an 87% success rate compared to just 14% for the most expensive quintile, a compounding drag that operates entirely separately from survivorship bias.
Carry three sources of distortion forward as your mental model:
- Survivorship bias, which hides the funds that failed.
- Fees and market efficiency, which erode returns even among survivors.
- Short-term versus long-term horizon mismatch, where a good year masks a poor decade.
The goal is not to write off active funds. It is to judge them using data that does not quietly delete the failures first, and to weight long-horizon survivorship-adjusted evidence over short-horizon survivor-only figures. SPIVA and Morningstar’s Barometer are the two sources worth consulting for that. The emerging-markets 37% versus above-50% gap is the reason methodology is not a footnote: identifying the genuinely skilled managers requires unbiased data. Your next fund table will read differently the moment you ask whether it counts the funds that no longer exist.
This article is for informational purposes only and should not be considered financial advice. Investors should conduct their own research and consult with financial professionals before making investment decisions. Past performance does not guarantee future results.