Silver has staged one of the sharpest commodity rallies of the past decade, climbing from the low $40s per ounce roughly a year ago to the mid-$60s by September 2026. Yet ask most retail investors what actually moved it, and you will hear one or two forces at most.
That gap matters, because silver is not a simple commodity. It is a safe-haven monetary metal, an industrial input critical to solar panels and electronics, and one of the most volatile assets a retail investor can hold, all at the same time.
Understanding what drives silver prices is more complicated, and more consequential, than most people assume. The metal responds to interest rates, the US dollar, manufacturing cycles, geopolitical sentiment, and speculative flows, often simultaneously and often in conflicting directions. Track only one lever and silver will keep surprising you.
By the end of this piece, you will have a clear map of every major force that moves the metal, including which forces dominate in different market conditions. That lets you read any silver price move with confidence rather than confusion.
The macro levers: interest rates, the US dollar, and silver’s non-yielding status
Here is the mechanism that catches most newcomers off guard: silver pays you nothing to hold it. No dividend, no interest, no yield. That single fact makes its price extraordinarily sensitive to what you could earn elsewhere.
When interest rates and real bond yields rise, the opportunity cost of holding a non-yielding metal rises with them. Cash and bonds start paying you to wait, and silver has to compete on price alone. When rates fall, that competition eases and silver becomes relatively more attractive.
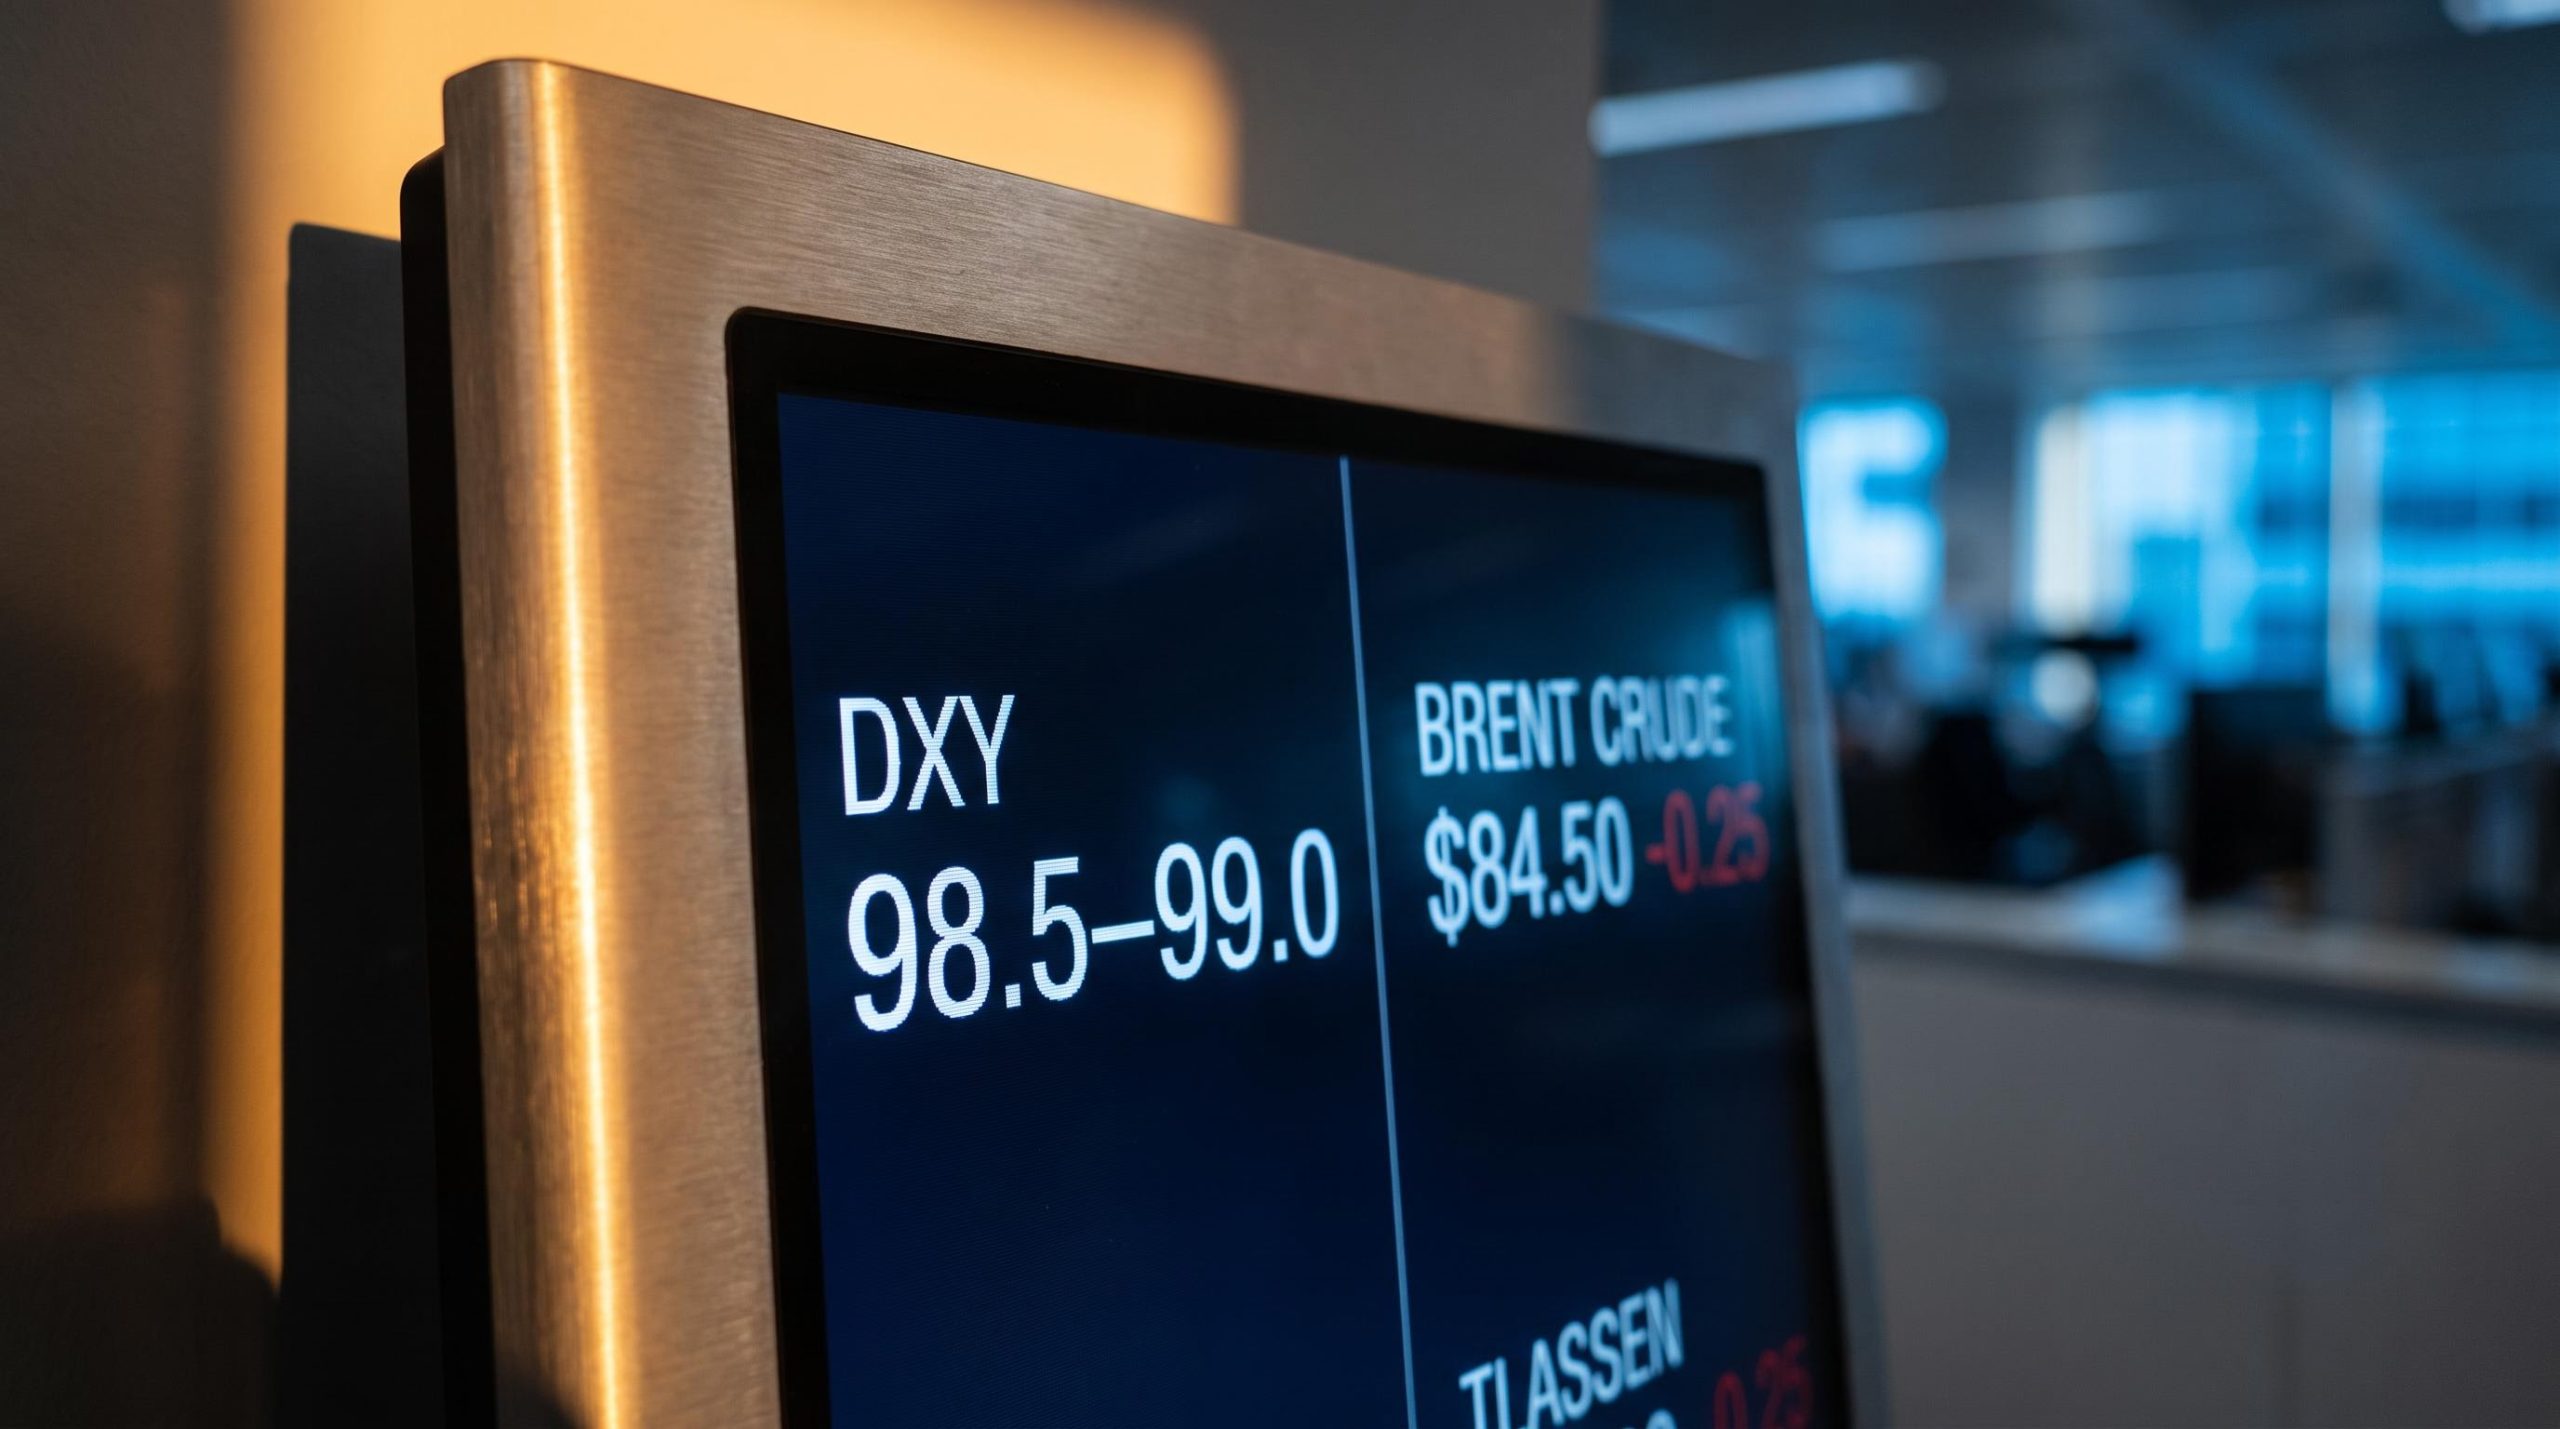
The transmission from a policy committee decision to silver’s spot price runs through several layers: central bank rate mechanics govern overnight interbank lending first, then bank funding costs, then real bond yields, and finally the opportunity cost calculation that silver holders face every day rates stay elevated.
The three core macro levers work like this:
- Non-yielding status: silver earns no income, so its appeal rises when rates fall and drops when rates climb.
- Dollar denomination: silver is priced in US dollars, so a stronger dollar makes it more expensive for non-US buyers and tends to suppress demand and price.
- Inflation sensitivity: silver is often treated as an inflation hedge, though this pull frequently competes with the rate and dollar effects rather than reinforcing them.
The clearest recent evidence came during the Federal Reserve’s tightening cycle. According to GoldInvestmentAuthority, a 4.25 percentage-point rate increase in 2022 coincided with roughly a 15% decline in silver prices, even as industrial demand stayed firm.
The 2022 lesson A 4.25 percentage-point Fed rate increase in 2022 paired with an approximately 15% fall in silver prices, showing how decisively monetary policy can override a bullish demand story.
That episode tells you something important: a structurally strong industrial demand story can be flattened by monetary policy in the short run. The Payne Institute notes that silver spent much of the previous decade trading in a relatively narrow band, roughly $13.70-$29.42 over ten years, with a lot of that time near $22/oz, despite growing industrial use.
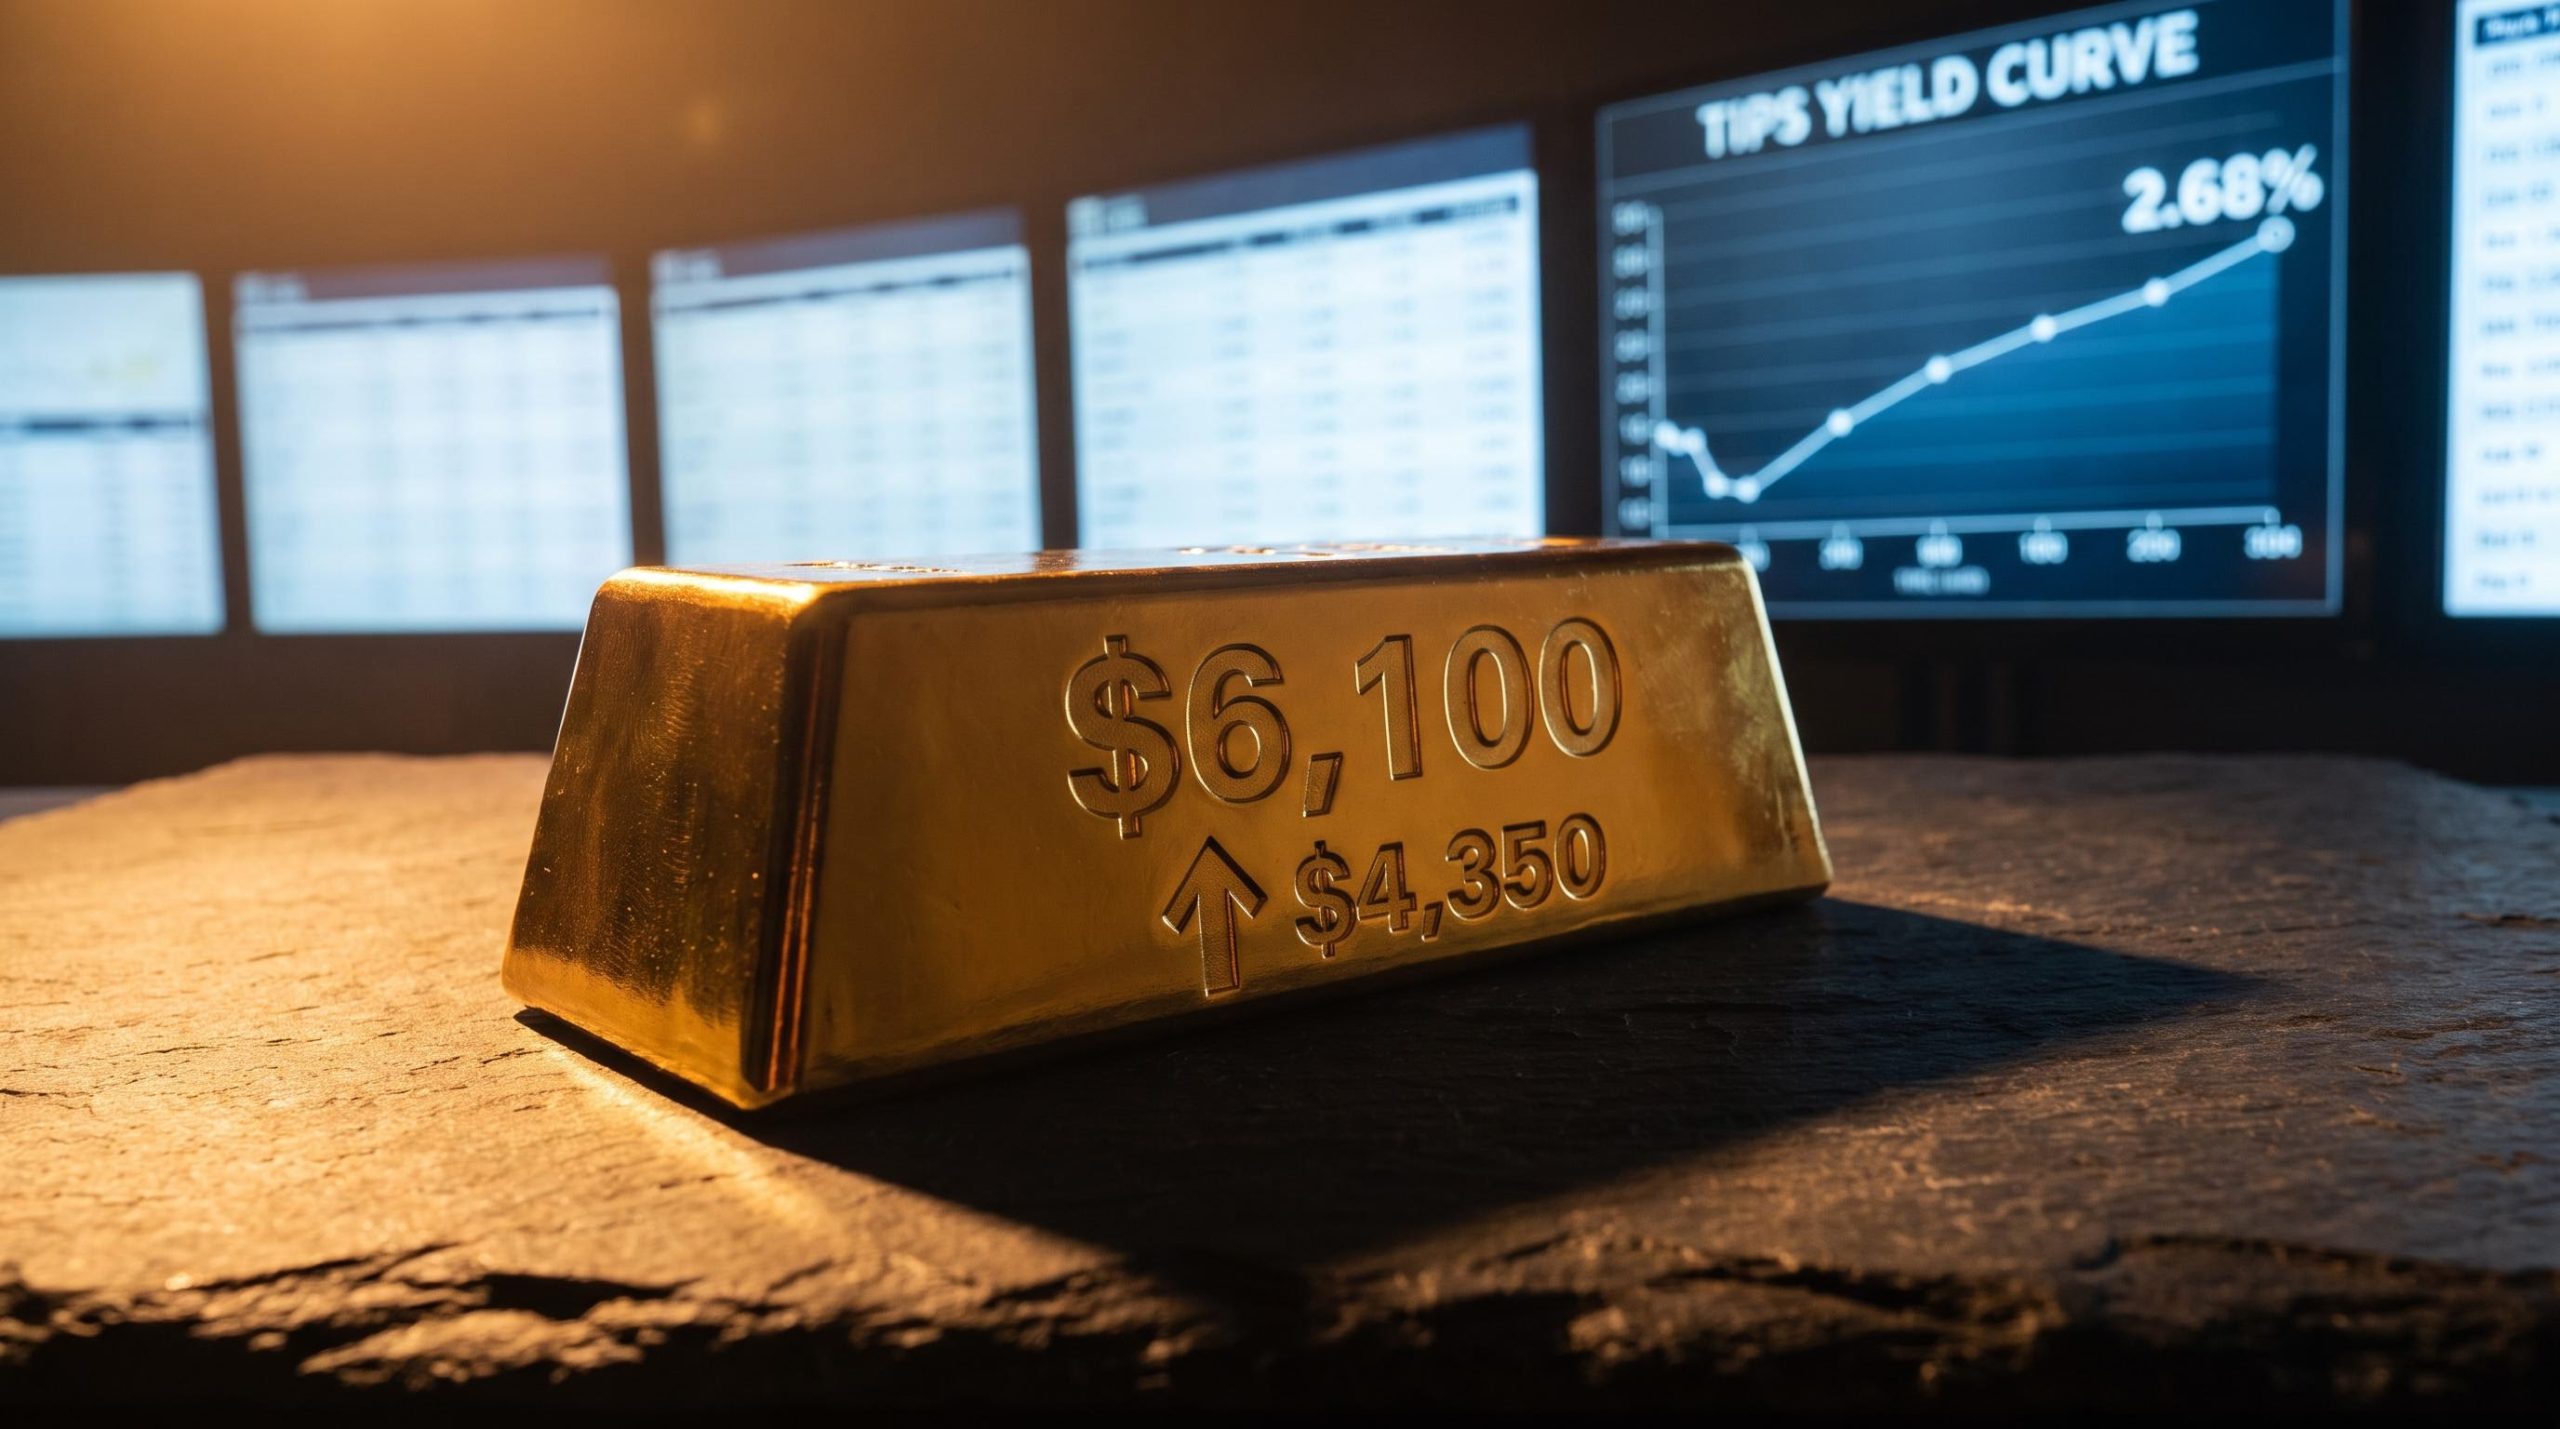
The picture flipped as the Fed signalled slower hikes and potential easing through 2024 and 2025. Silver climbed out of the $30s and into the $60s by mid-2026. Watching the interest rate cycle, in other words, is not optional if you own this metal.
When big ASX news breaks, our subscribers know first
What silver actually does in the real world: industrial demand and the solar revolution
Silver’s price is not just an investor sentiment story. Roughly half of it is decided in factories.
The reason starts with physics. Silver has the highest electrical conductivity of any metal, ahead of both copper and gold, which makes it difficult to replace in electronics, solar cells, and a widening range of green-economy applications. When you need to move electricity efficiently, silver is often the best material available.
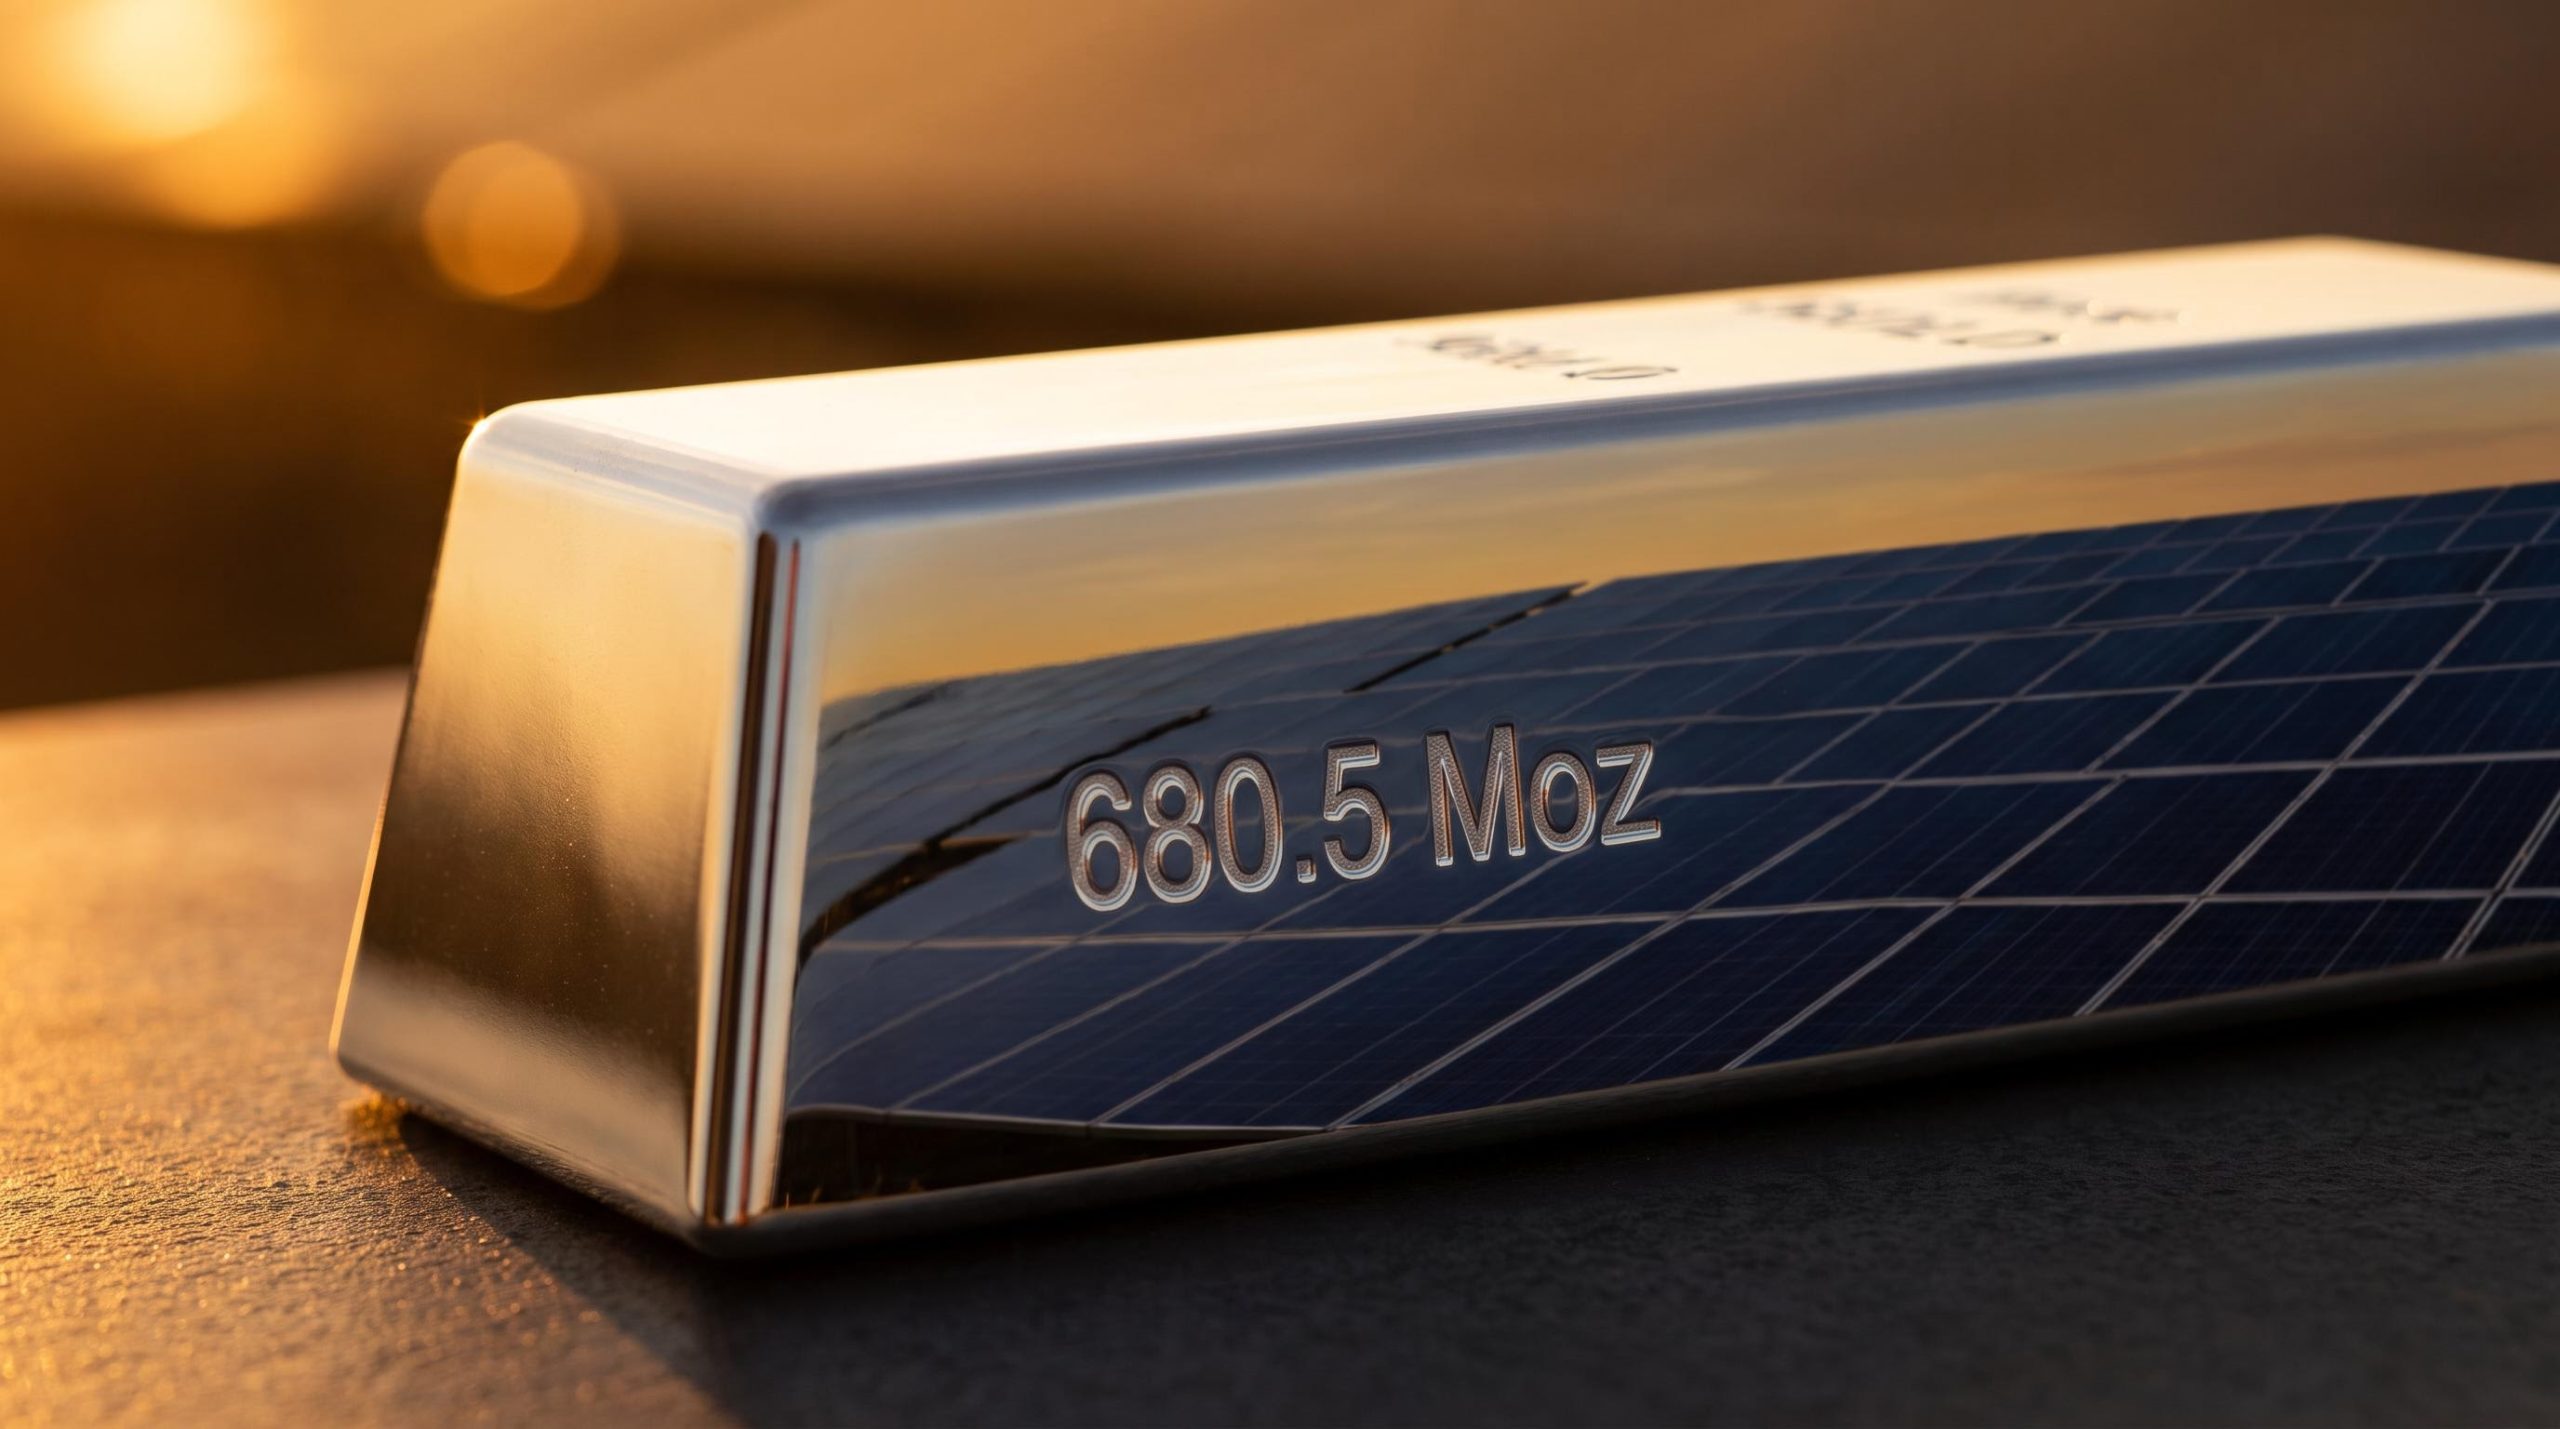
That property translates into serious volume. According to the World Silver Survey 2025, produced by Metals Focus for the Silver Institute, silver industrial demand reached a record 680.5 Moz in 2024, up 4% year-on-year. GoldSilver’s summary of the survey puts that at roughly 56% of total global demand of around 1,219 Moz.
Electronics and photovoltaics dominate that industrial figure. India remains a major source of jewellery demand alongside the industrial story, while the US and China anchor industrial consumption through their large manufacturing bases. This is what separates silver from gold as an investment: its price partly depends on whether factories are building solar panels and semiconductors, not just on how investors feel.
Why solar panels have become silver’s biggest industrial customer
Solar has become the single largest and fastest-growing industrial buyer of silver. The reason is silver paste, which conducts electricity from the photovoltaic cell to the external circuit. There is currently no commercially deployed substitute at scale.
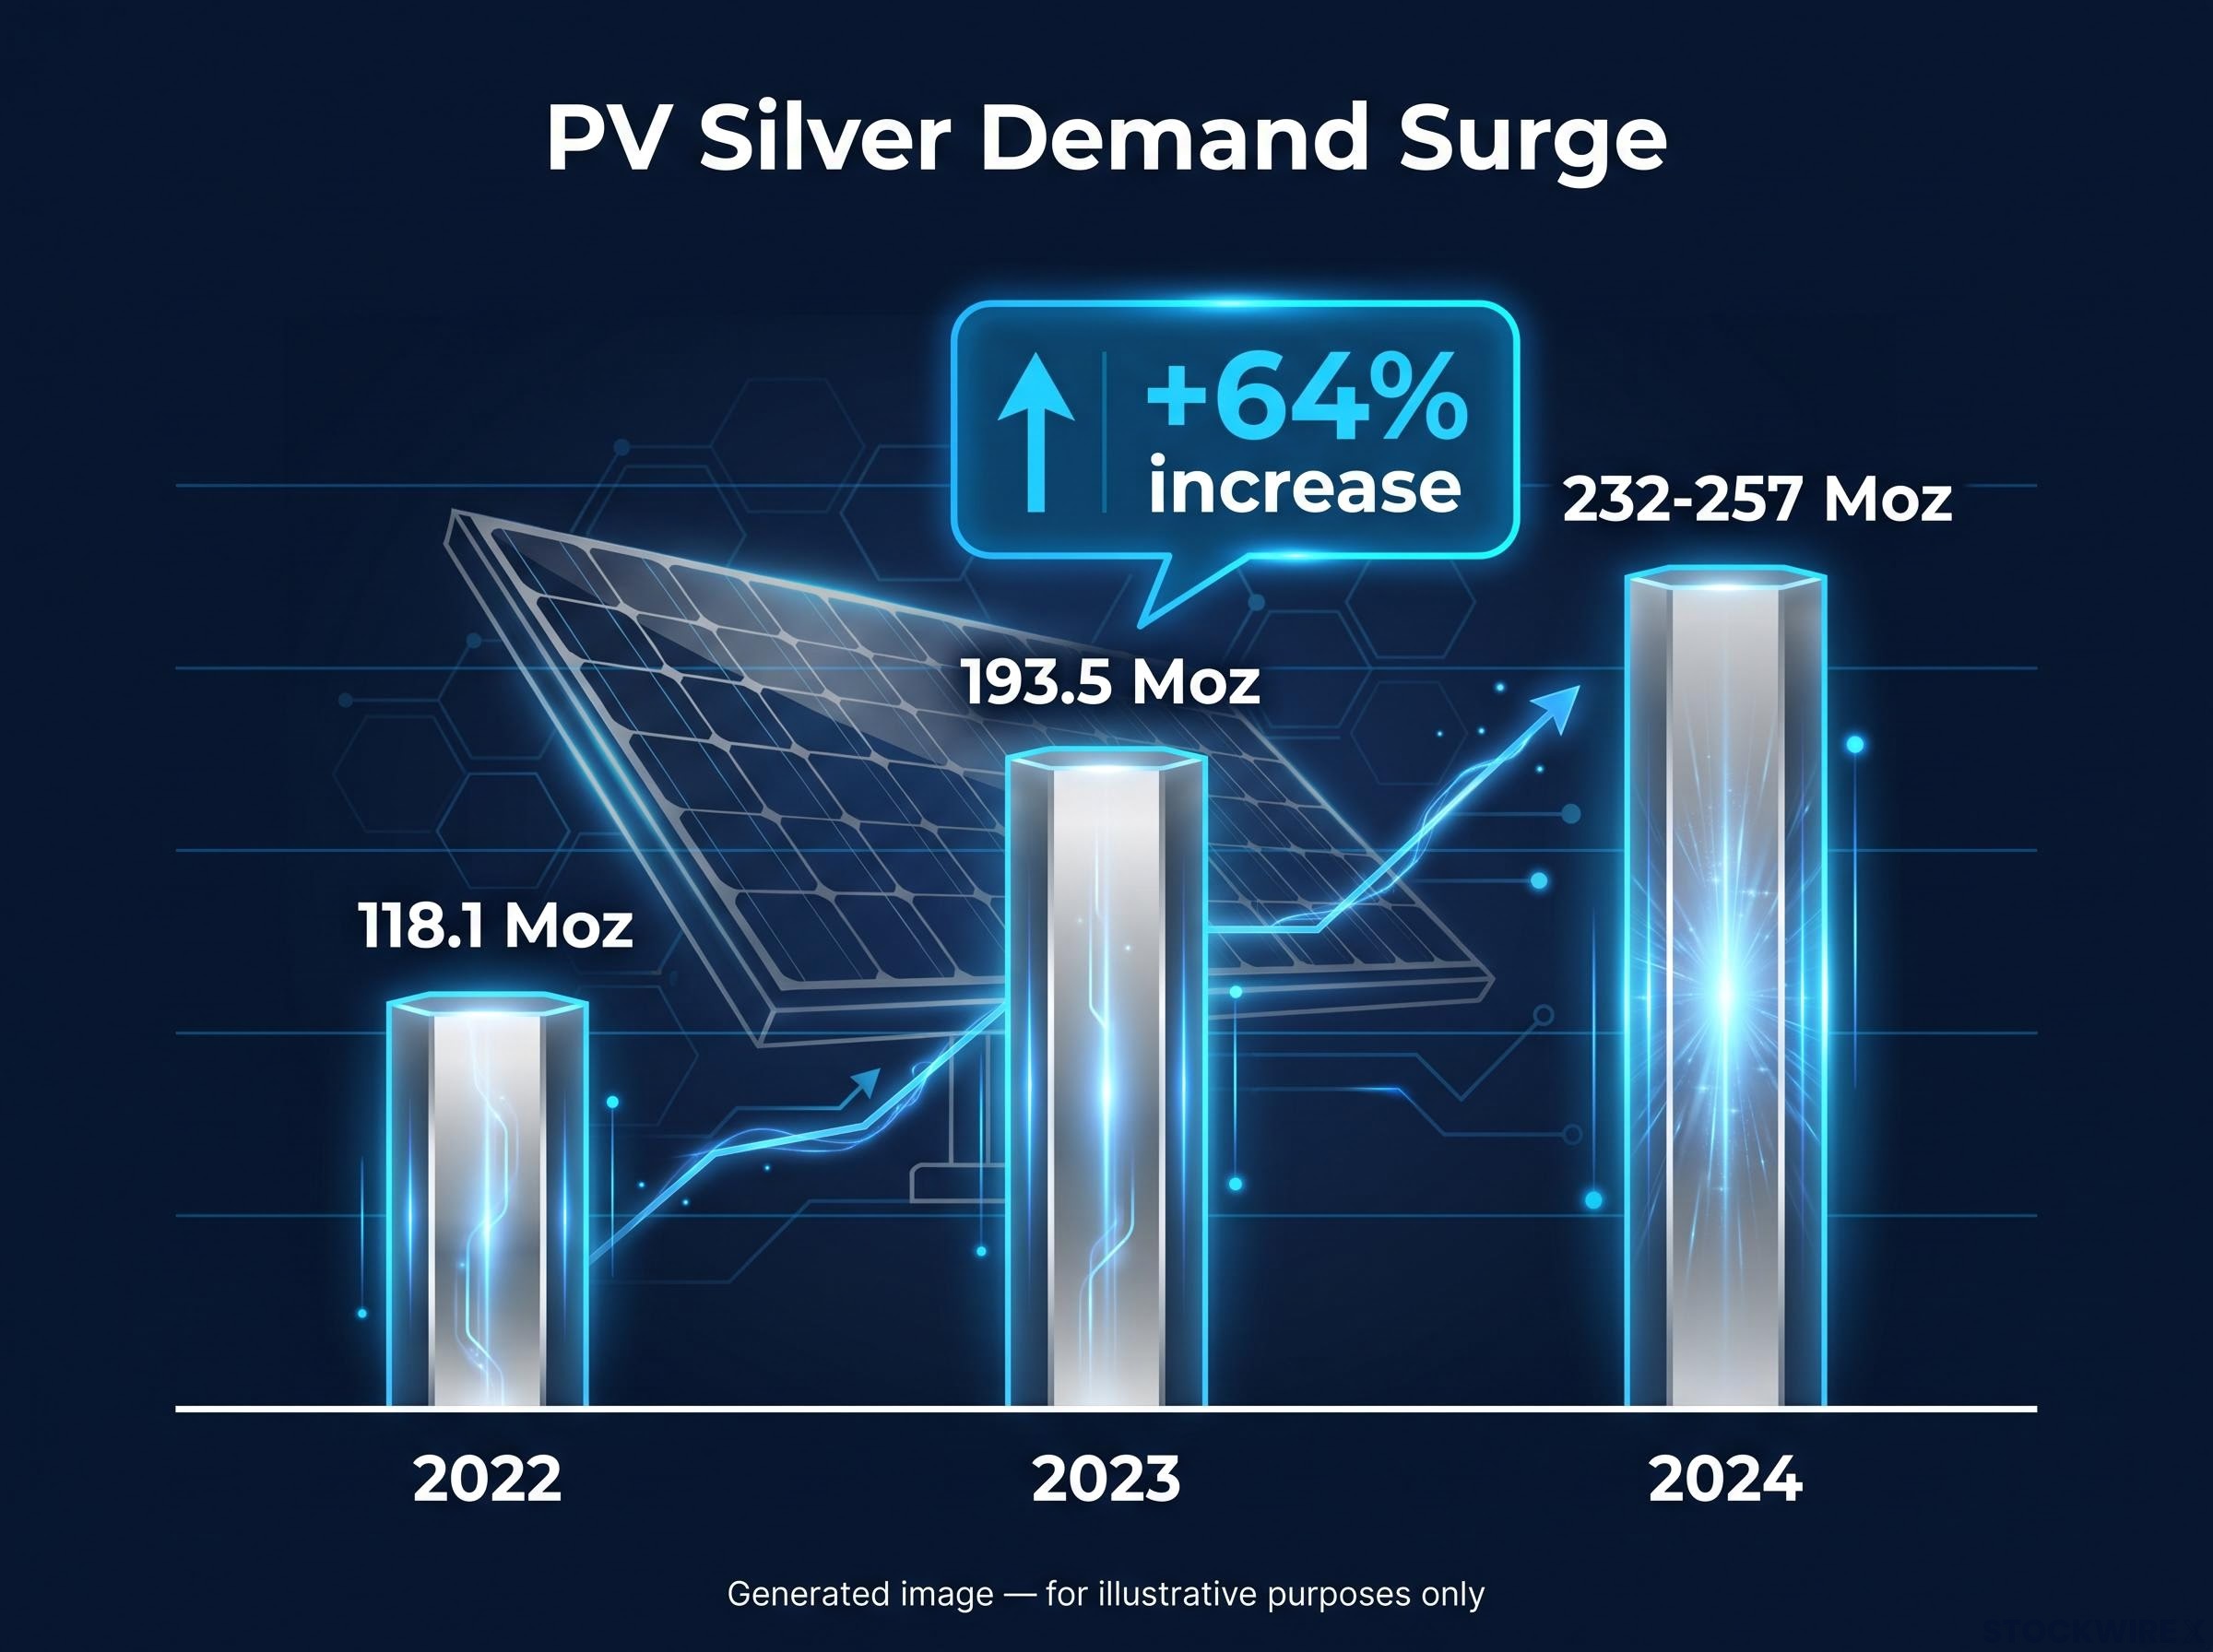
The growth has been steep. According to the Silver Institute and TaiyangNews, PV silver demand jumped from 118.1 Moz in 2022 to 193.5 Moz in 2023, a 64% increase in a single year.
| Year | PV Demand (Moz) | Year-on-Year Change |
|---|---|---|
| 2022 | 118.1 | Baseline |
| 2023 | 193.5 | +64% |
| 2024 | 232-257 (range from two sources) | Continued growth |
The 2024 figure spans a range because two credible institutional sources differ: the GoldSilver summary of the World Silver Survey 2025 reports around 232 Moz, while the LBMA’s Alchemist estimates roughly 257 Moz. The difference likely reflects methodology, but the direction is not in dispute.
That 64% jump in one year tells you green-economy policy is now one of the most powerful marginal demand forces in the market. Any major shift in solar installation rates or subsidy regimes will ripple directly into silver prices. With total demand near 1.21-1.22 billion ounces against much slower mine-supply growth, solar is the primary driver of a persistent demand overhang.
Solar policy and supply chains interact in ways that are not always obvious from the silver demand headline: a proposed US ban on Chinese solar inverters illustrates how regulatory decisions can shift installation rates within a market, potentially accelerating or delaying the panel deployments that generate silver paste demand in the first place.
Where silver comes from, and why supply cannot simply keep up
Most people assume that when silver prices rise, miners simply dig up more. Silver does not work that way, and understanding why is the key to understanding its sharpest price moves.
Silver reaches the market through three channels:
- Primary silver mines: operations where silver is the main product and output responds, at least partly, to silver’s own price.
- By-product production: silver extracted alongside lead, zinc, and copper, where mining decisions are driven by the economics of those other metals, not silver.
- Recycling: reclaimed silver that adds to available supply but is rarely enough to balance the market during deficits.
Here is the structural catch. Most silver comes out of the ground as a by-product. That means when silver demand spikes, as it has with solar, supply cannot respond proportionately or quickly, because the miners producing it are making decisions based on copper and zinc prices, not silver.
This inelasticity is an amplifier. It deepens deficits and pushes prices higher, faster, than a more responsive supply market would allow. The same feature works in reverse during gluts, which is part of why silver moves so sharply in both directions.
The structural deficit Silver Institute presentations note that total demand of around 1.21-1.22 billion ounces, against much slower mine-supply growth, has produced multi-year structural market deficits.
Recycling provides some offset, but it has not been sufficient to close the gap in deficit years. So when you see a silver supply deficit reported, understand that it is unlikely to be resolved quickly by miners ramping up output. That makes those deficits more durable, and more price-relevant, than a single headline number might suggest.
The Gold/Silver ratio: a relative valuation lens, not a crystal ball
If you follow silver commentary, you will run into the Gold/Silver ratio constantly. It is genuinely useful context, and it is also widely misused.
The definition is simple: the ratio tells you how many ounces of silver it takes to buy one ounce of gold. You calculate it by dividing the gold price by the silver price. A high ratio suggests silver is cheap relative to gold; a low ratio suggests the opposite.
As of mid-to-late September 2026, the ratio sits in the mid-60s. MetalCharts reported 66.1 on 19 September 2026, The Vault Report showed 65.9:1 on 18 September, and MintedMetal calculated 68.1 on 17 September. Gold traded around $4,380-$4,436/oz and silver around $64-$67/oz across those dates.
That mid-60s reading sits above the roughly 60 long-run average that both GoldSilver and GoldRepublic reference across 30-year and 50-year windows, which some analysts read as silver being modestly cheap relative to gold.
| Metric | Value | What It Suggests |
|---|---|---|
| Current ratio (Sept 2026) | Mid-60s (65.9-68.1) | Silver modestly cheap vs gold |
| 50/30-year average | Approximately 60 | Long-run baseline |
| 12-month high | 89.2 (17 Sept 2025) | Silver historically very cheap |
| 12-month low | 45.4 (27 Jan 2026) | Silver historically expensive |
Now look at the range. According to MintedMetal, over the 12 months to September 2026 the ratio swung from a high of 89.2 on 17 September 2025 to a low of 45.4 on 27 January 2026. That is a move of more than 40 points in a single year.
How to read the ratio The Gold/Silver ratio is a descriptive valuation metric, not a guaranteed timing signal. It has spent much of the last five years in a wide 45-105 band.
So what does the current reading actually tell you? Silver is priced somewhat cheaply relative to gold by historical standards. But the 40-point swing shows that “historically cheap” can get significantly cheaper before it reverts. Treat the ratio as one piece of context, not a call to action.
Technical resistance levels added an additional layer of complexity to the September 2026 price action: silver’s recovery from $62 to above $67 ran directly into a stacked zone between the 100-day and 200-day simple moving averages, with a live Head and Shoulders pattern on the daily chart creating a binary setup that charts alone could not resolve without a macro catalyst.
Volatility, risks, and what silver’s dual identity means for your portfolio
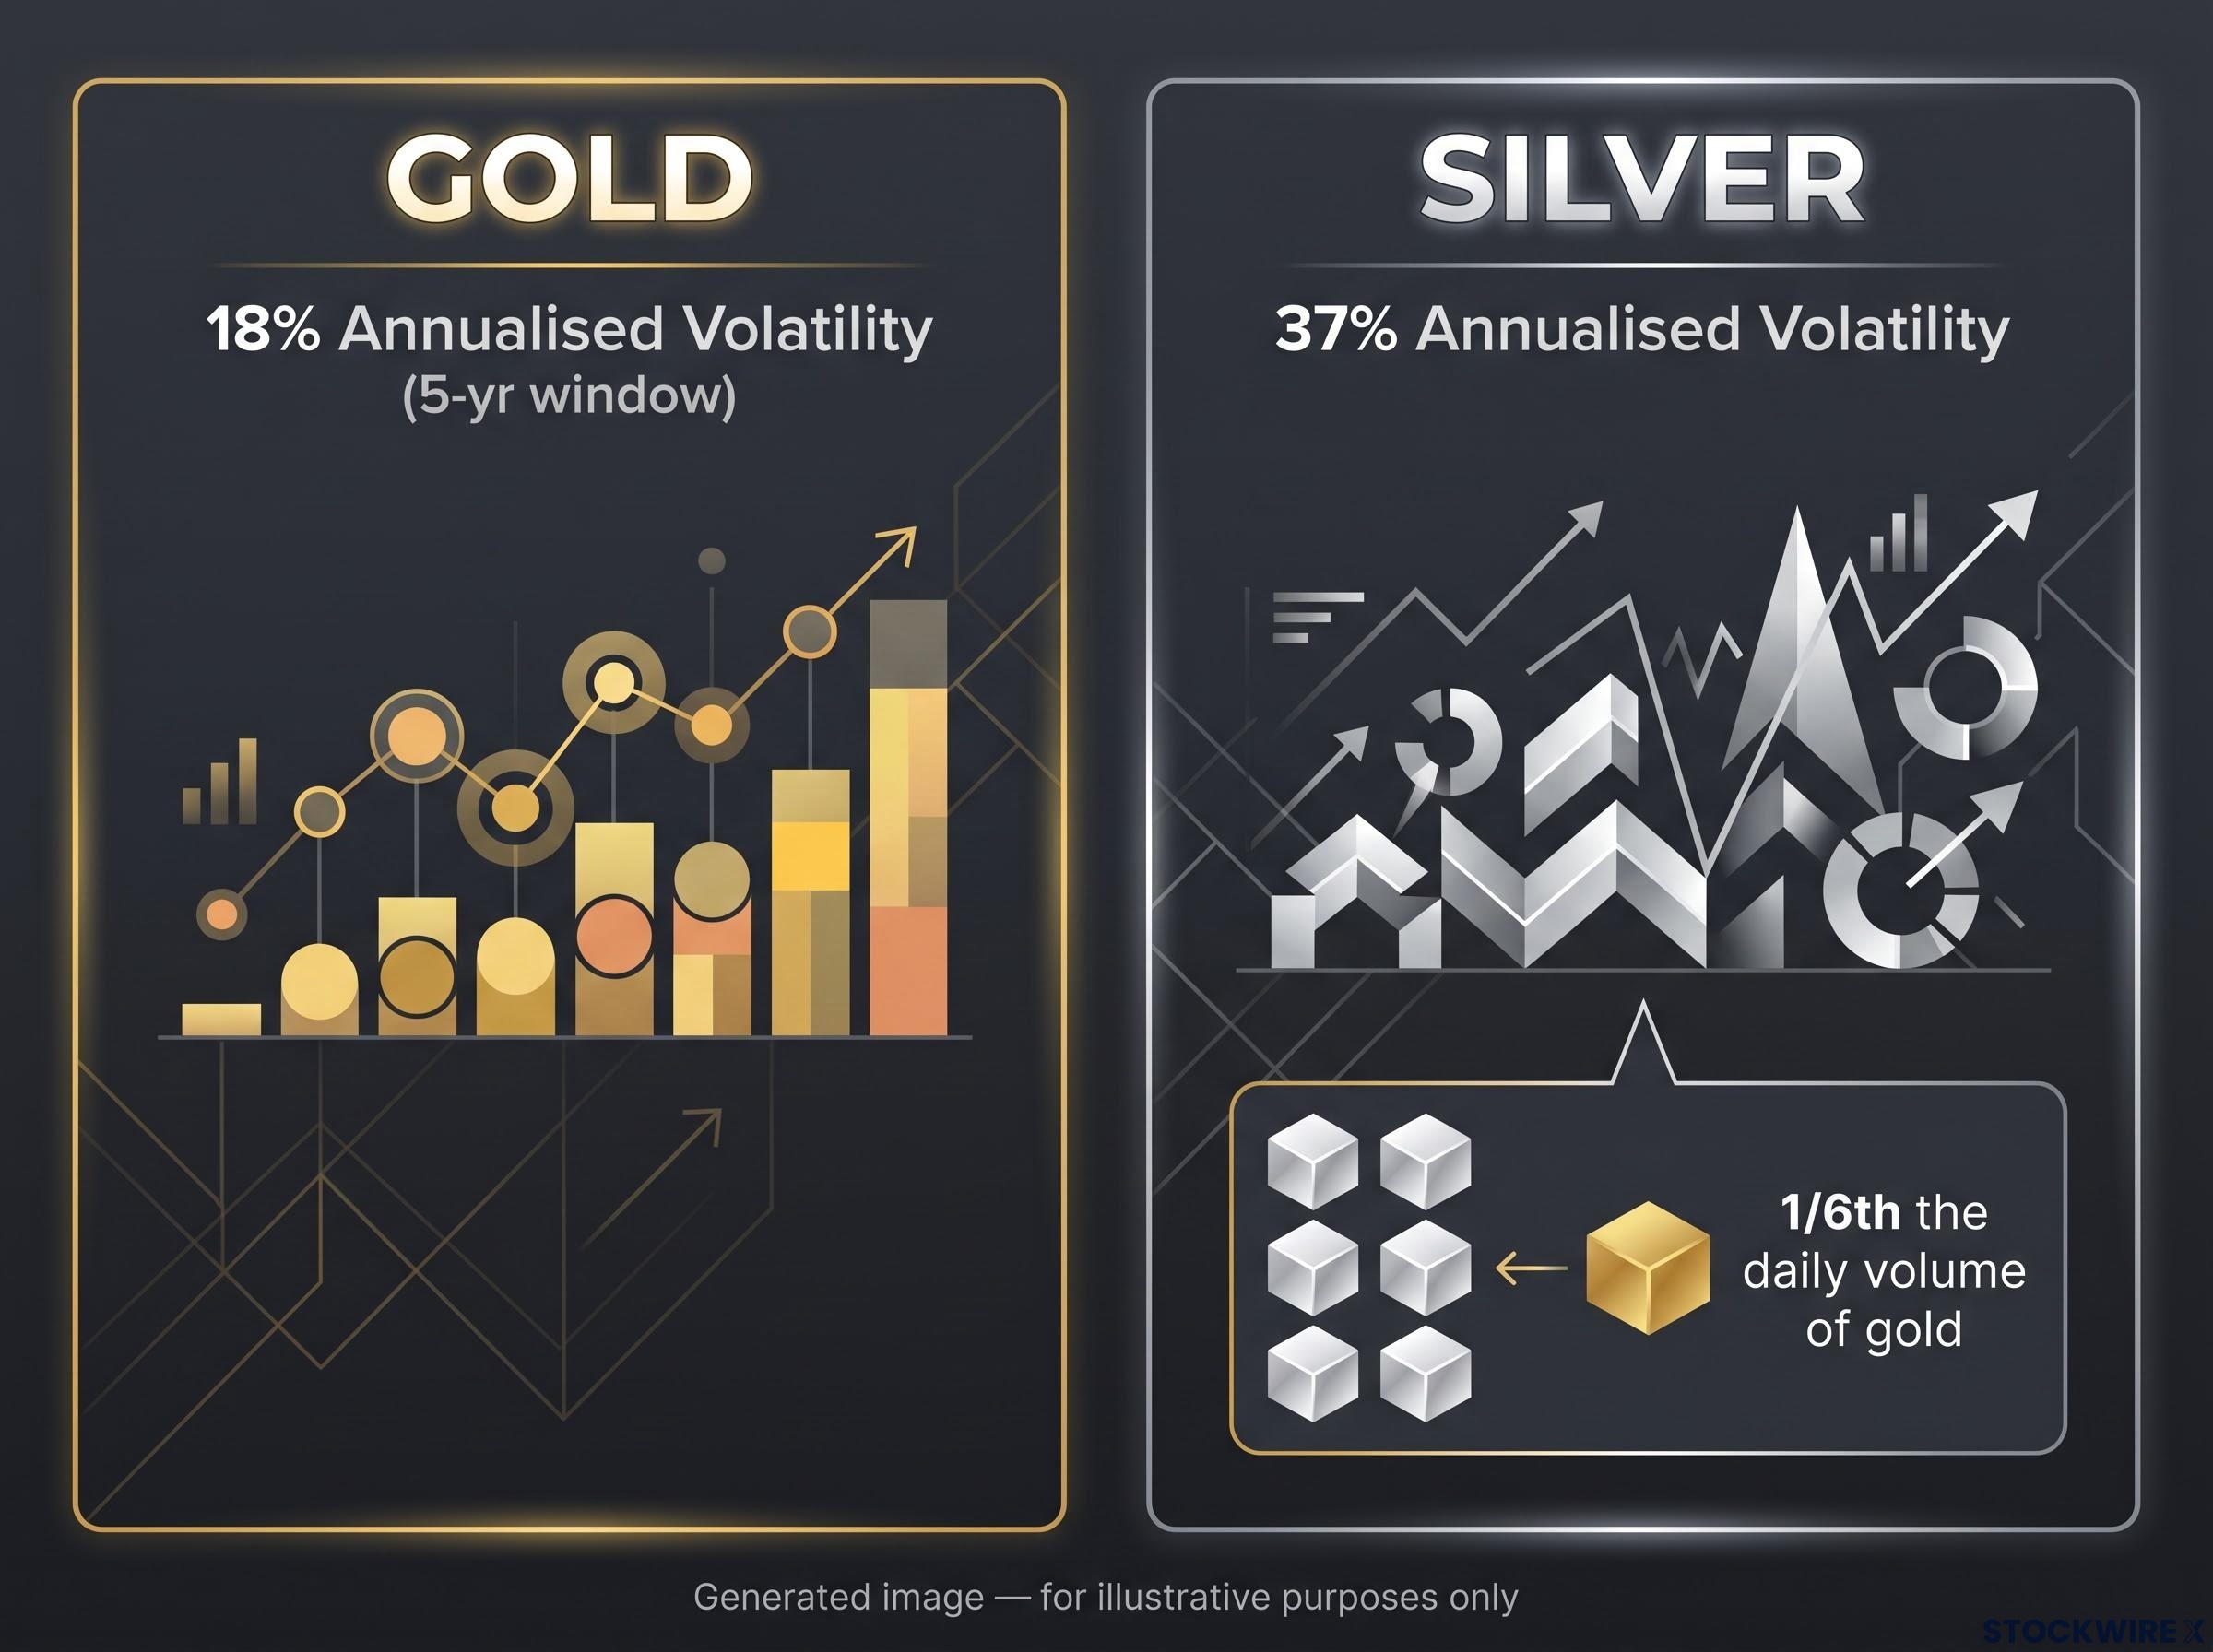
Silver moves harder than gold, and it is not close. According to DailyForex data cited alongside World Gold Council research, silver’s annualised realised volatility ran near 37% over a recent five-year window, against roughly 18% for gold. That is about double.
Three structural mechanisms create that gap:
- Market size and liquidity: GoldSilver estimates silver’s investable market trades at roughly one-sixth the daily volume of gold, so comparable flows move its price far more.
- Dual demand identity: silver is pulled by both monetary sentiment and the manufacturing cycle, often in opposite directions at once.
- Supply inelasticity: by-product production cannot adjust quickly to demand shocks, sharpening both spikes and slumps.
The 2021 retail “silver squeeze” showed the liquidity point in action. Buying pressure pushed COMEX futures up 8.7% on 1 February 2021 to about $29.25/oz, brushing an eight-year high near $30, but prices fell back below $26/oz within weeks. Academic analysis of the episode found the market quickly returned to equilibrium, a reminder that narrative-driven moves in silver tend to be sharp but short.
The risks worth monitoring are clear. Rising rates and a strong dollar can knock silver down even when industrial demand is strong, as the 2022 cycle proved. And there is technological substitution: BloombergNEF-sourced reporting suggests solar manufacturers are working to cut silver use per panel, with analyst projections of roughly 7-17% declines in PV silver demand for 2025. These figures are analyst projections rather than confirmed outcomes, but the direction of the thrifting effort is well documented.
The volatility gap Silver’s annualised realised volatility ran near 37% over a recent five-year window, versus roughly 18% for gold.
Silver’s roughly 37% volatility, combined with a market one-sixth the size of gold’s, tells you that position sizing matters more here than for almost any other widely traded commodity. The upside from structural deficits and green-economy demand is real. So is the downside from rate cycles and thrifting, and both can arrive faster than you expect.
How to think about silver’s place in a diversified portfolio
Treat silver as a higher-beta complement to gold, not a substitute for it. It suits investors comfortable with larger drawdowns and shorter-term trading dynamics, which is why most analysts frame it as a smaller, satellite allocation rather than a core defensive holding.
Precious metals allocation decisions involve more than a silver-versus-gold comparison: a University of Zurich study found that an 85% equity and 15% precious metals portfolio delivered higher risk-adjusted returns than a pure equity portfolio after taxes and inflation, a finding that reframes how silver fits within a broader asset mix rather than as a standalone commodity trade.
You have two main access routes, and the trade-offs differ:
- Physical coins and bars: direct ownership, but you carry storage costs and dealer premiums.
- Exchange-traded funds: easy liquidity and no storage burden, but you pay ongoing management fees and hold a fund rather than the metal itself.
Your choice should align with your time horizon and storage preferences. A short-term trader values the liquidity of an ETF; a long-term holder may prefer the direct ownership of physical metal despite the storage friction.
Reading silver’s price signals with the full picture in view
Pull the five drivers together and you have something more useful than a prediction. You have a diagnostic framework for working out which force is dominant in any given environment.
| Driver | What Pushes Silver Up | What Pushes Silver Down |
|---|---|---|
| Interest rates and dollar | Rate cuts, dollar weakness | Rate hikes, dollar strength |
| Industrial demand | Solar and electronics growth | Manufacturing slowdown, thrifting |
| Supply structure | Persistent by-product deficits | Higher recycling, mine expansion |
| Gold/Silver ratio | High ratio, mean reversion | Low ratio, gold outperformance |
| Liquidity and volatility | Strong ETF and retail inflows | Outflows, liquidity stress |
Silver is genuinely a hybrid asset, where both the monetary and industrial narratives are valid at once. The dominant force shifts with the macro environment. In rate-hike cycles, monetary headwinds tend to override industrial fundamentals. In easing cycles or periods of dollar weakness, structural deficits and investor flows take the wheel.
Look at where things stand today. Silver is trading around $66-$67/oz in mid-to-late September 2026, roughly $22-$25 higher than a year earlier. The Gold/Silver ratio sits modestly above long-run averages, and industrial demand remains structurally elevated against constrained supply, with total demand near 1.21-1.22 billion ounces, yet it faces real thrifting pressure.
The three-way tension between the Fed rate cycle, dollar dynamics, and structural industrial demand is what will decide whether the bullish case extends or consolidates from here. The investor who can identify which of these is currently dominant will make better calls about when to add or trim exposure than one reacting to price alone. That framework, not a single bullish or bearish verdict, is the durable tool worth taking away.
This article is for informational purposes only and should not be considered financial advice. Investors should conduct their own research and consult with financial professionals before making investment decisions.
Past performance does not guarantee future results. Financial projections are subject to market conditions and various risk factors, and forward-looking statements are speculative and subject to change based on market developments.