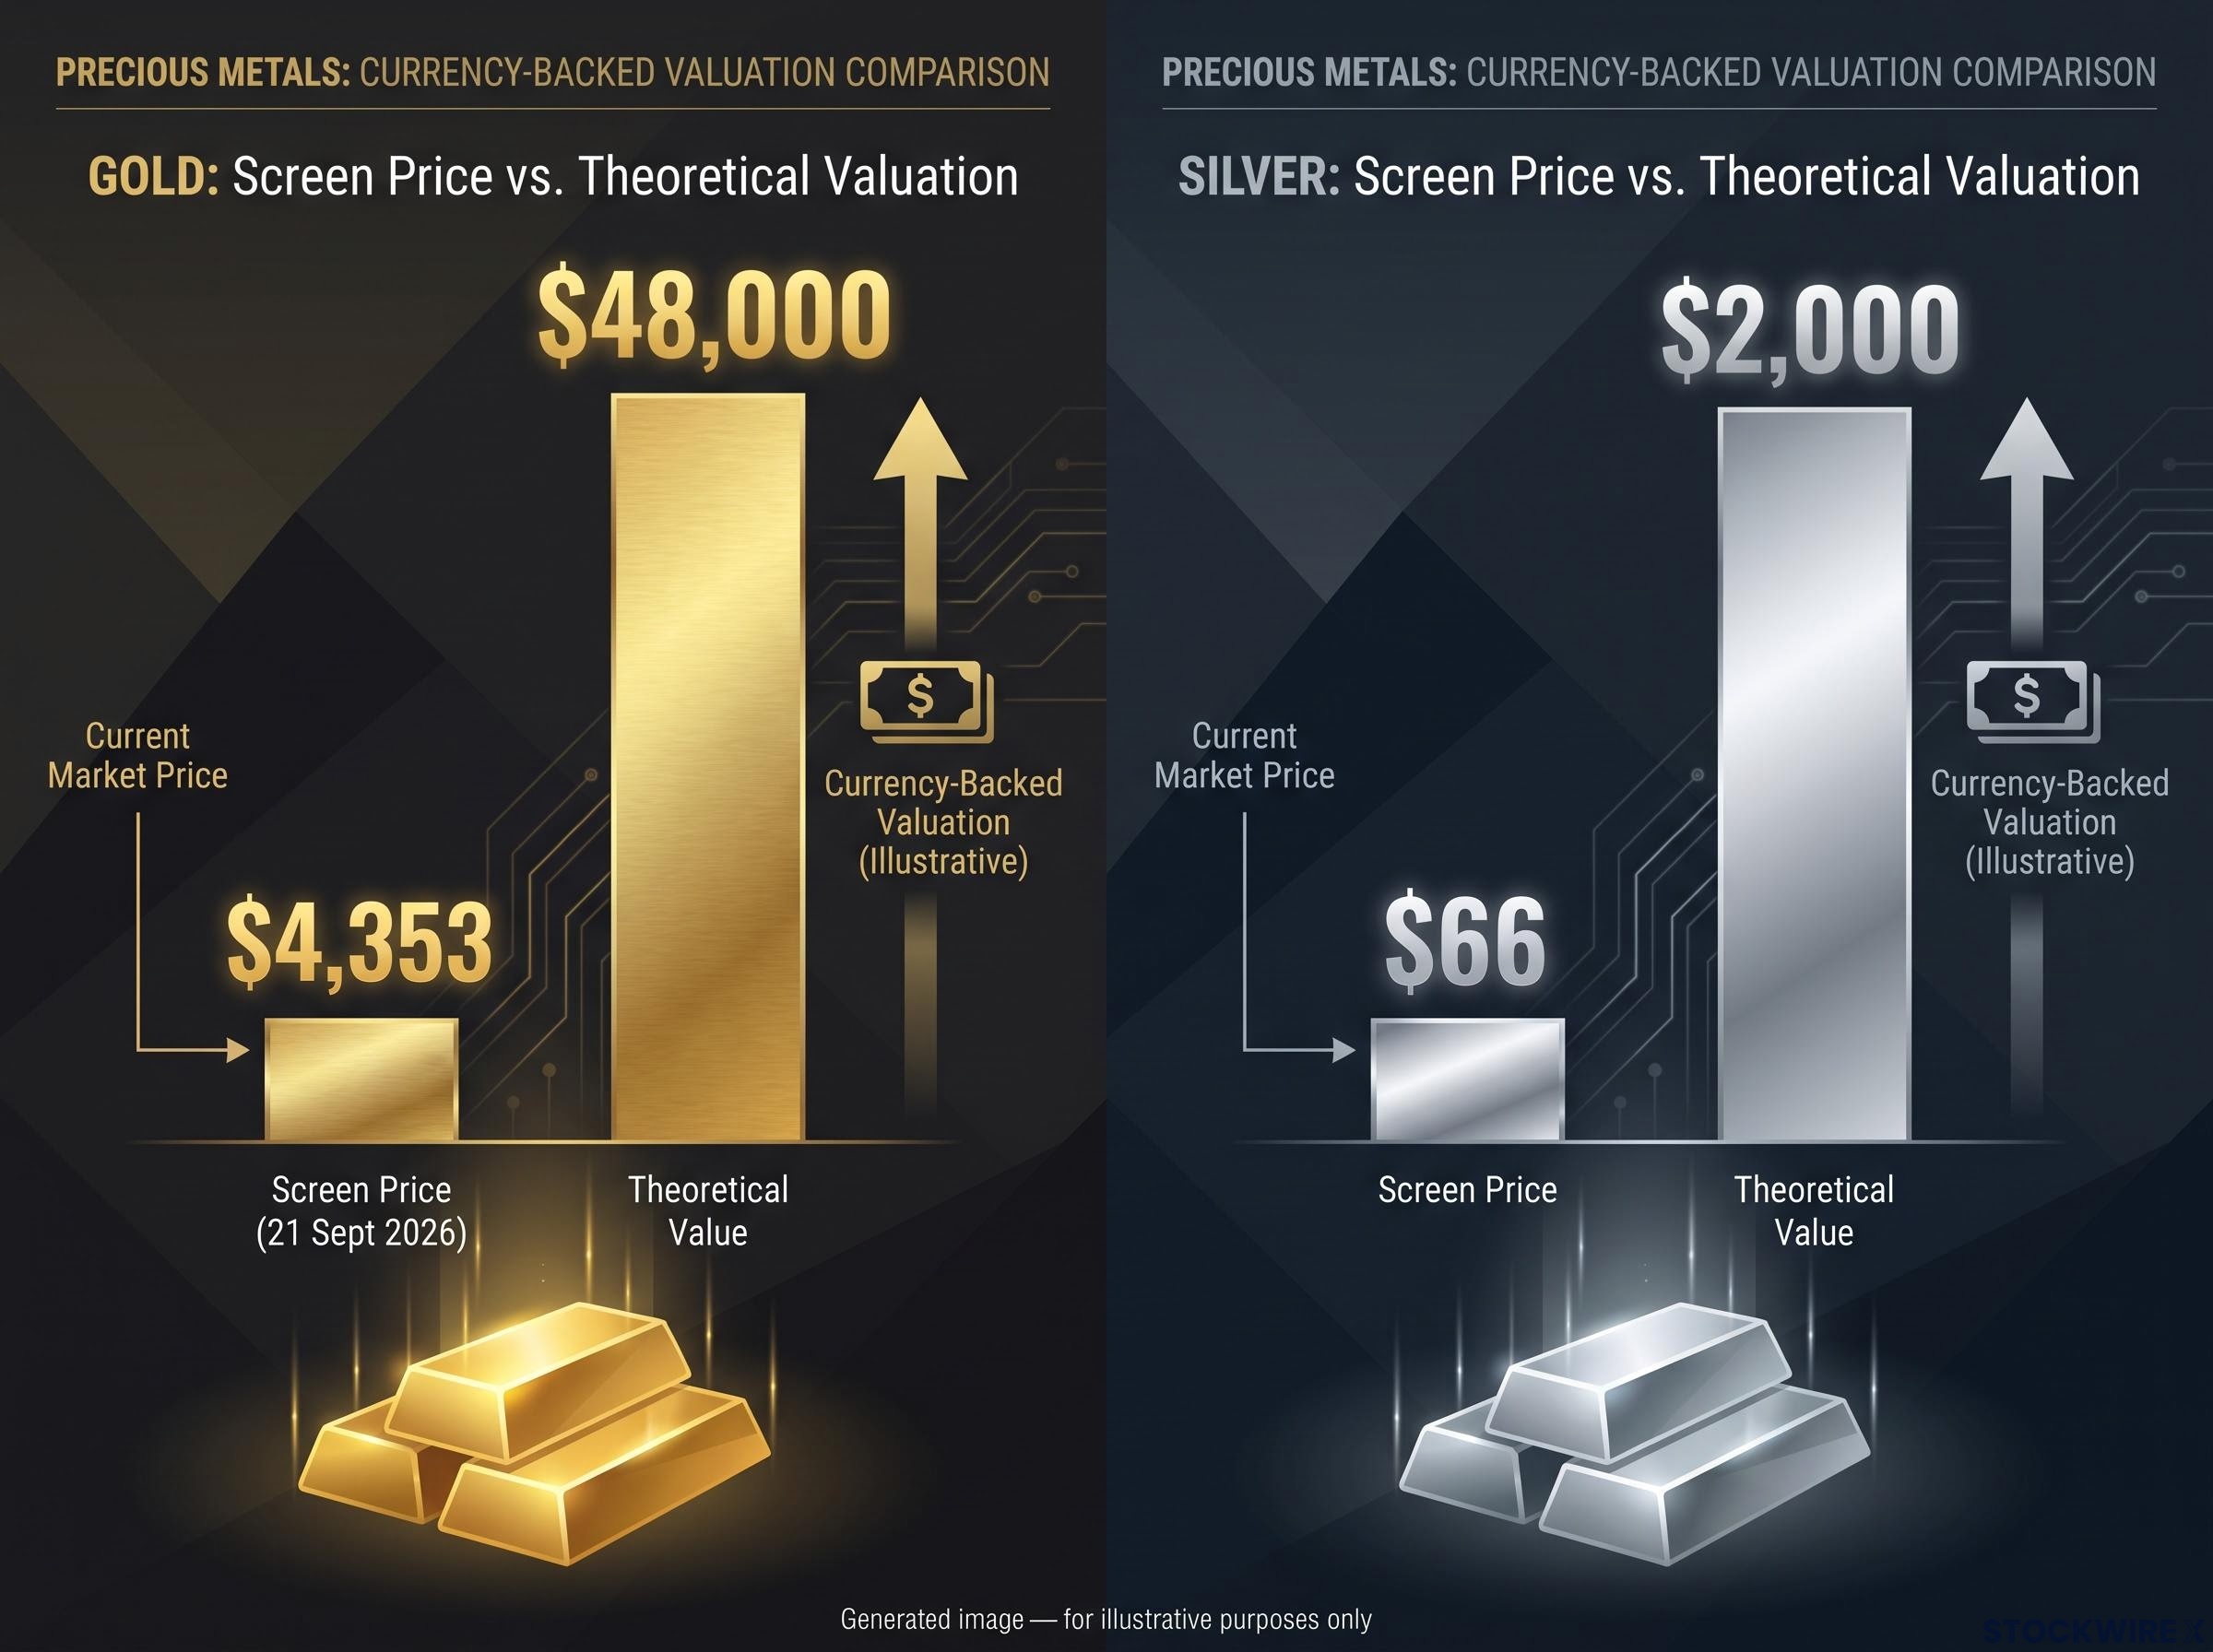
Gold traded near $4,353 an ounce on 21 September 2026, with some quotes running as high as $4,600 earlier in the month. Silver sat around $66 an ounce.
Yet a small group of analysts argue those prices are a fraction of what the metal is actually worth. One valuation, based on the amount of currency in circulation, puts gold’s true monetary value closer to $48,000 an ounce.
That gap is enormous. It sits at the centre of a long-running debate about how precious metals are actually priced, and whether the number on your screen reflects real supply and demand at all.
On one side is the physical market: tangible bars, coins, and the metal that ends up inside solar panels, medical devices, and electronics. On the other is a vast financial layer of futures contracts and paper claims that trade in volumes far larger than the metal that backs them.
Understanding paper gold versus physical gold is not an abstract exercise. It shapes what you actually own when you buy a precious metals product, and how much you can trust the price you paid.
Here is a clear framework for how futures markets influence spot prices, so you can weigh precious metals as a portfolio holding on structural fundamentals rather than on headline-grabbing price targets.
Defining the divide between tangible assets and paper contracts
Start with what you can hold in your hand. A physical ounce of gold is a finite, tangible asset with no counterparty attached. Nobody has to honour a promise for it to retain value.
That physical reality is grounded in genuine utility. According to the original source, gold has roughly 32 distinct industrial and commercial uses, while silver has around 36. These metals go into electronics, medical equipment, and industrial processes, giving them a functional demand base that a paper contract simply does not have.
Silver’s dual identity as both a monetary and industrial metal means its silver price drivers are more complex than gold’s: more than half of all silver demand comes from industrial applications including electronics and solar PV, making it impossible to decode through a precious-metals lens alone.
Contrast that with a futures contract, which serves a single speculative function: a bet on price, settled mostly in cash, backed by a fraction of the metal it references. When you trade a derivative or hold an unallocated account, you are holding a claim, not the metal itself.
That distinction matters because it changes what you own entirely. Buying physical metal and buying paper exposure are not two ways of storing the same wealth. They are two different asset classes with vastly different counterparty risk.
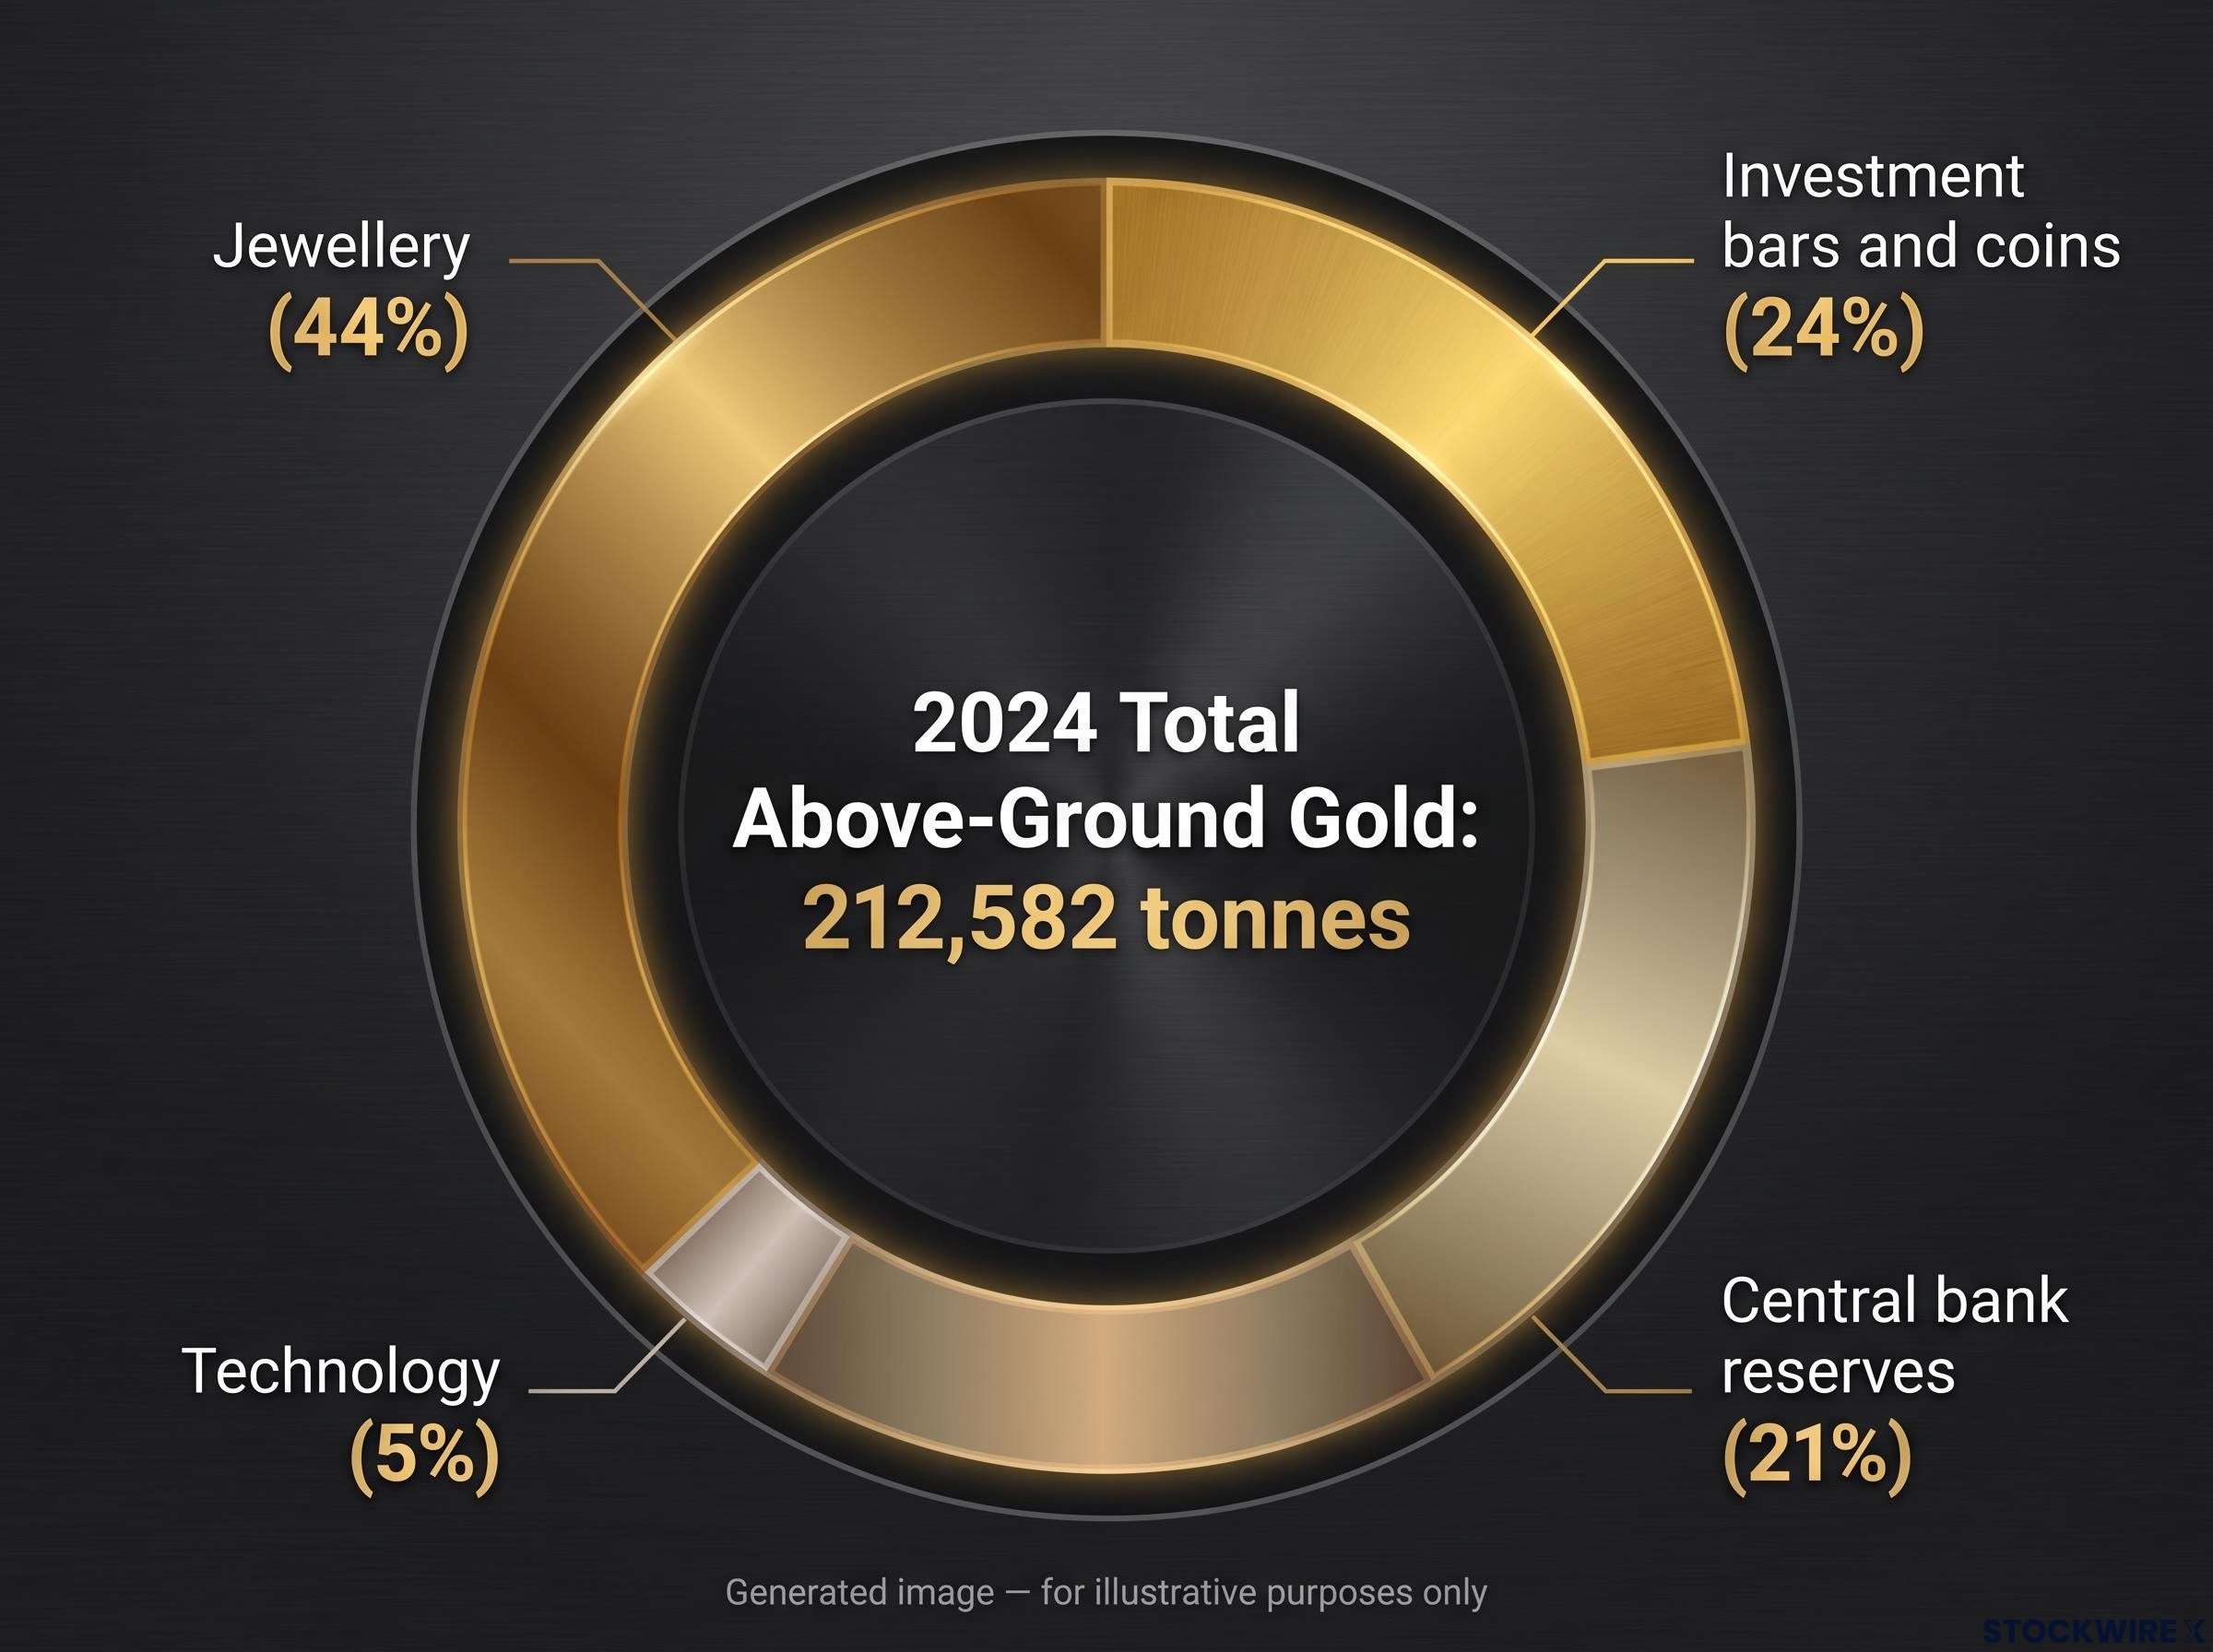
The scale of the physical world is worth grasping. The World Gold Council estimates total above-ground physical gold stock at roughly 212,582 tonnes in 2024, split across jewellery (44%), investment bars and coins (24%), central bank reserves (21%), and technology (5%).
Layered on top of that physical base is a growing financial structure. Global physically backed gold exchange-traded funds (ETFs), which are funds that hold real metal on your behalf, reached a record 4,189 tonnes in August 2026, representing $615 billion in assets under management after 121 tonnes of net inflows that month. That built on 4,047 tonnes in June 2026 and 3,932 tonnes in November 2025.
The key point is that one physical ounce can sit behind multiple paper claims. Here is how the main options compare on the attributes that decide your risk.
| Attribute | Physical metal | Allocated ETFs | Paper futures |
|---|---|---|---|
| Counterparty risk | None | Low (fund and custodian) | High (exchange and broker) |
| Industrial utility | Direct | Indirect (backed by metal) | None (price bet only) |
| Storage | Your responsibility | Held by custodian | No metal to store |
Knowing which column you are buying is the foundation for everything that follows.
When big ASX news breaks, our subscribers know first
The synthetic supply debate and price capping theories
Once you accept that paper claims can outnumber physical metal, the obvious question is by how much. The answer, according to critics of the current system, is by a staggering margin.
The futures market can create a theoretically unlimited supply of paper exposure against a finite quantity of metal. This is the heart of the synthetic supply argument: contracts can be written faster than metal can be mined, and that flood of paper caps the price.
The valuation gap gives the theory its punch. The original source estimates gold’s fair value at roughly $48,000 an ounce and silver’s at roughly $2,000 an ounce, both derived from currency in circulation. Against today’s prices, that implies paper supply is doing an enormous amount of work.
Critics point to concentrated short positions as the mechanism. Market commentary cites swap-dealer short positions in COMEX silver futures exceeding 42,000 contracts, roughly 211 million ounces, described by critics as largely “naked” shorts that suppress the price relative to physical demand.
Here is how a naked short position works in the futures market:
- A trader sells a futures contract promising to deliver metal at a set price, without owning the underlying metal.
- Because most contracts settle in cash rather than physical delivery, the seller rarely needs to actually source the metal.
- Selling pressure from these contracts pushes the quoted price down, regardless of what physical buyers are doing.
- If enough sellers do this at once, the paper price can diverge sharply from real-world scarcity.
During a 2025-2026 “silver run”, notional trading volumes in paper silver reportedly reached ratios as high as 356:1 versus the above-ground stock. In other words, 356 ounces of paper silver changed hands for every physical ounce that actually exists.
There is a second mechanism worth understanding, because it explains behaviour you have probably seen. In a broad market panic, investors facing margin calls, which are demands from a broker to add cash to cover losing positions, are often forced to sell whatever they can, including precious metals contracts.
That forced selling can drive the paper price down even while physical demand is strong. Recognising this helps you separate a paper-driven liquidity event from a genuine shift in physical fundamentals, so you do not mistake a temporary flush for a change in the metal’s underlying worth.
Structural stress tests and the shift toward physical price discovery
The suppression thesis is compelling, but it is not the only view, and a balanced reading matters before you position any capital. Much mainstream and empirical work reaches a very different conclusion.
Market studies across London, New York, India, and China generally find that futures markets actually lead price discovery. The reasoning is that informed traders gravitate toward venues like COMEX because of lower costs and higher leverage, so price signals often form there first.
Two structural arguments push back hard on the idea of permanent suppression:
OTC gold investment flows are the category most widely omitted from headline demand coverage: OTC investment delivered 327 tonnes in Q2 2026 alone, meaning the widely cited year-on-year fall in reported investment demand was measuring the wrong pool while the dominant flow went largely unrecorded.
- Arbitrage constraints: Empirical studies show spot and futures prices maintain long-term equilibrium. Any sustained attempt to hold prices down with paper shorts is eventually countered by arbitrageurs, traders who profit by buying the cheaper market and selling the dearer one, closing the gap.
- Two-way transmission: Paper markets also carry moves upward. Surging ETF holdings and futures participation throughout 2025 and 2026 helped drive gold above $4,300, which is hard to square with a purely suppressive system.
History offers three moments where the paper system was genuinely stress-tested:
- March 2020 COMEX dislocation: The COMEX-London exchange-for-physical spread exploded from $2-$3 an ounce to over $80 an ounce. Mainstream analysts attribute this to Swiss refinery shutdowns that blocked the conversion of London kilo bars into COMEX-deliverable 100-ounce bars, a logistics failure rather than a structural one.
- 2021 silver squeeze: A retail-driven push lifted COMEX futures from roughly $25 to over $30 an ounce, but the Shanghai premium barely moved. Physical industrial demand did not confirm the paper spike, and the market quickly returned to equilibrium.
- 2025-2026 silver backwardation: Starting in late 2025, the silver futures curve flipped, with nearby contracts trading above deferred ones.
The emergence of backwardation
Normally, a futures contract for delivery next year costs more than one for delivery next month, because you pay for storage and financing over time. Backwardation is the reverse: buyers pay a premium to get metal now rather than later.
That inversion is a signal. It suggests institutions are demanding physical delivery today rather than accepting a paper promise for the future, and are willing to pay up for the certainty.
For you, these stress tests are the tell. They suggest the paper-dominated pricing mechanism is beginning to fracture, and that your physical holdings may increasingly reflect a truer market value than the screen price implies.
The macroeconomic forces accelerating the physical transition
None of this is happening in a vacuum. The most powerful pressure on physical demand is coming from the largest buyers in the market: sovereign governments.
According to World Gold Council data, central banks bought a record 1,136 tonnes of gold in 2022, the highest level since 1950, followed by 1,037 tonnes in 2023 and 1,092 tonnes in 2024. That is three consecutive years of buying at a scale rarely seen.
Central banks are buying at record pace Emerging market central banks across Asia and the Middle East are leading the accumulation. Their stated motivations are to diversify away from the US dollar, hedge against sanctions risk, and secure a politically neutral reserve asset. A significant share of these purchases goes unreported, suggesting quiet, strategic accumulation.
The de-dollarization of reserves is now a majority position among sovereign institutions: the OMFIF Global Public Investor survey released 30 June 2026, covering 90 sovereign institutions with over $7 trillion in assets, recorded the first-ever instance of net dollar-reduction intent outnumbering net dollar-increase intent among central banks.
The other force is the slow deterioration of the US Treasury market, the traditional home for sovereign reserves. That market has been shifting since 2008, as stable holders like foreign governments and commercial banks gave way to hedge funds and speculative traders, making pricing far less predictable.
The strain is now visible in yields. The 10-year Treasury yield reached 5.01% on 16 September 2026 and held at 5.00% on 15 and 18 September, before easing to 4.956% by 21 September 2026.
Foreign buyers are stepping back at the same time. Japan’s holdings of US Treasury securities fell to $1,103.9 billion as of 1 July 2026, down $12.8 billion from the prior month.
When central banks swap Treasuries for physical gold at this pace, it tells you the largest and best-informed pools of capital are prioritising a tangible asset over a counterparty promise. That is a long-term geopolitical realignment, not a short-term trade, and it forms a structural floor under physical demand.
These statements are speculative and subject to change based on market developments. Past performance does not guarantee future results.
Structuring your portfolio in a transitioning market
The core tension is simple once you see it. The price on your screen is set largely by paper contracts, while the fundamentals driving long-term value, industrial use, finite supply, and sovereign buying, sit in the physical market.
If you accept that price discovery is gradually shifting toward the physical side, the practical implication is that what you own matters as much as how much. Physical metal and allocated ETFs carry the metal and the utility. Paper futures carry counterparty risk and price exposure without the underlying asset.
That does not mean paper products have no place. It means you should know which layer you are buying and why, and weight your exposure to match your tolerance for counterparty risk.
A University of Zurich study using data since 1972 found that an 85% equity and 15% precious metals allocation delivered higher risk-adjusted returns than a pure equity portfolio after taxes and inflation, with the optimal share rising to 20-30% once dividend and interest tax drag is included.
The forces at work, record central bank accumulation and a fraying Treasury market, are structural and unlikely to reverse quickly. As long as sovereign debt instability persists, institutional demand for tangible assets has a reason to continue.
This article is for informational purposes only and should not be considered financial advice. Investors should conduct their own research and consult with financial professionals before making investment decisions.