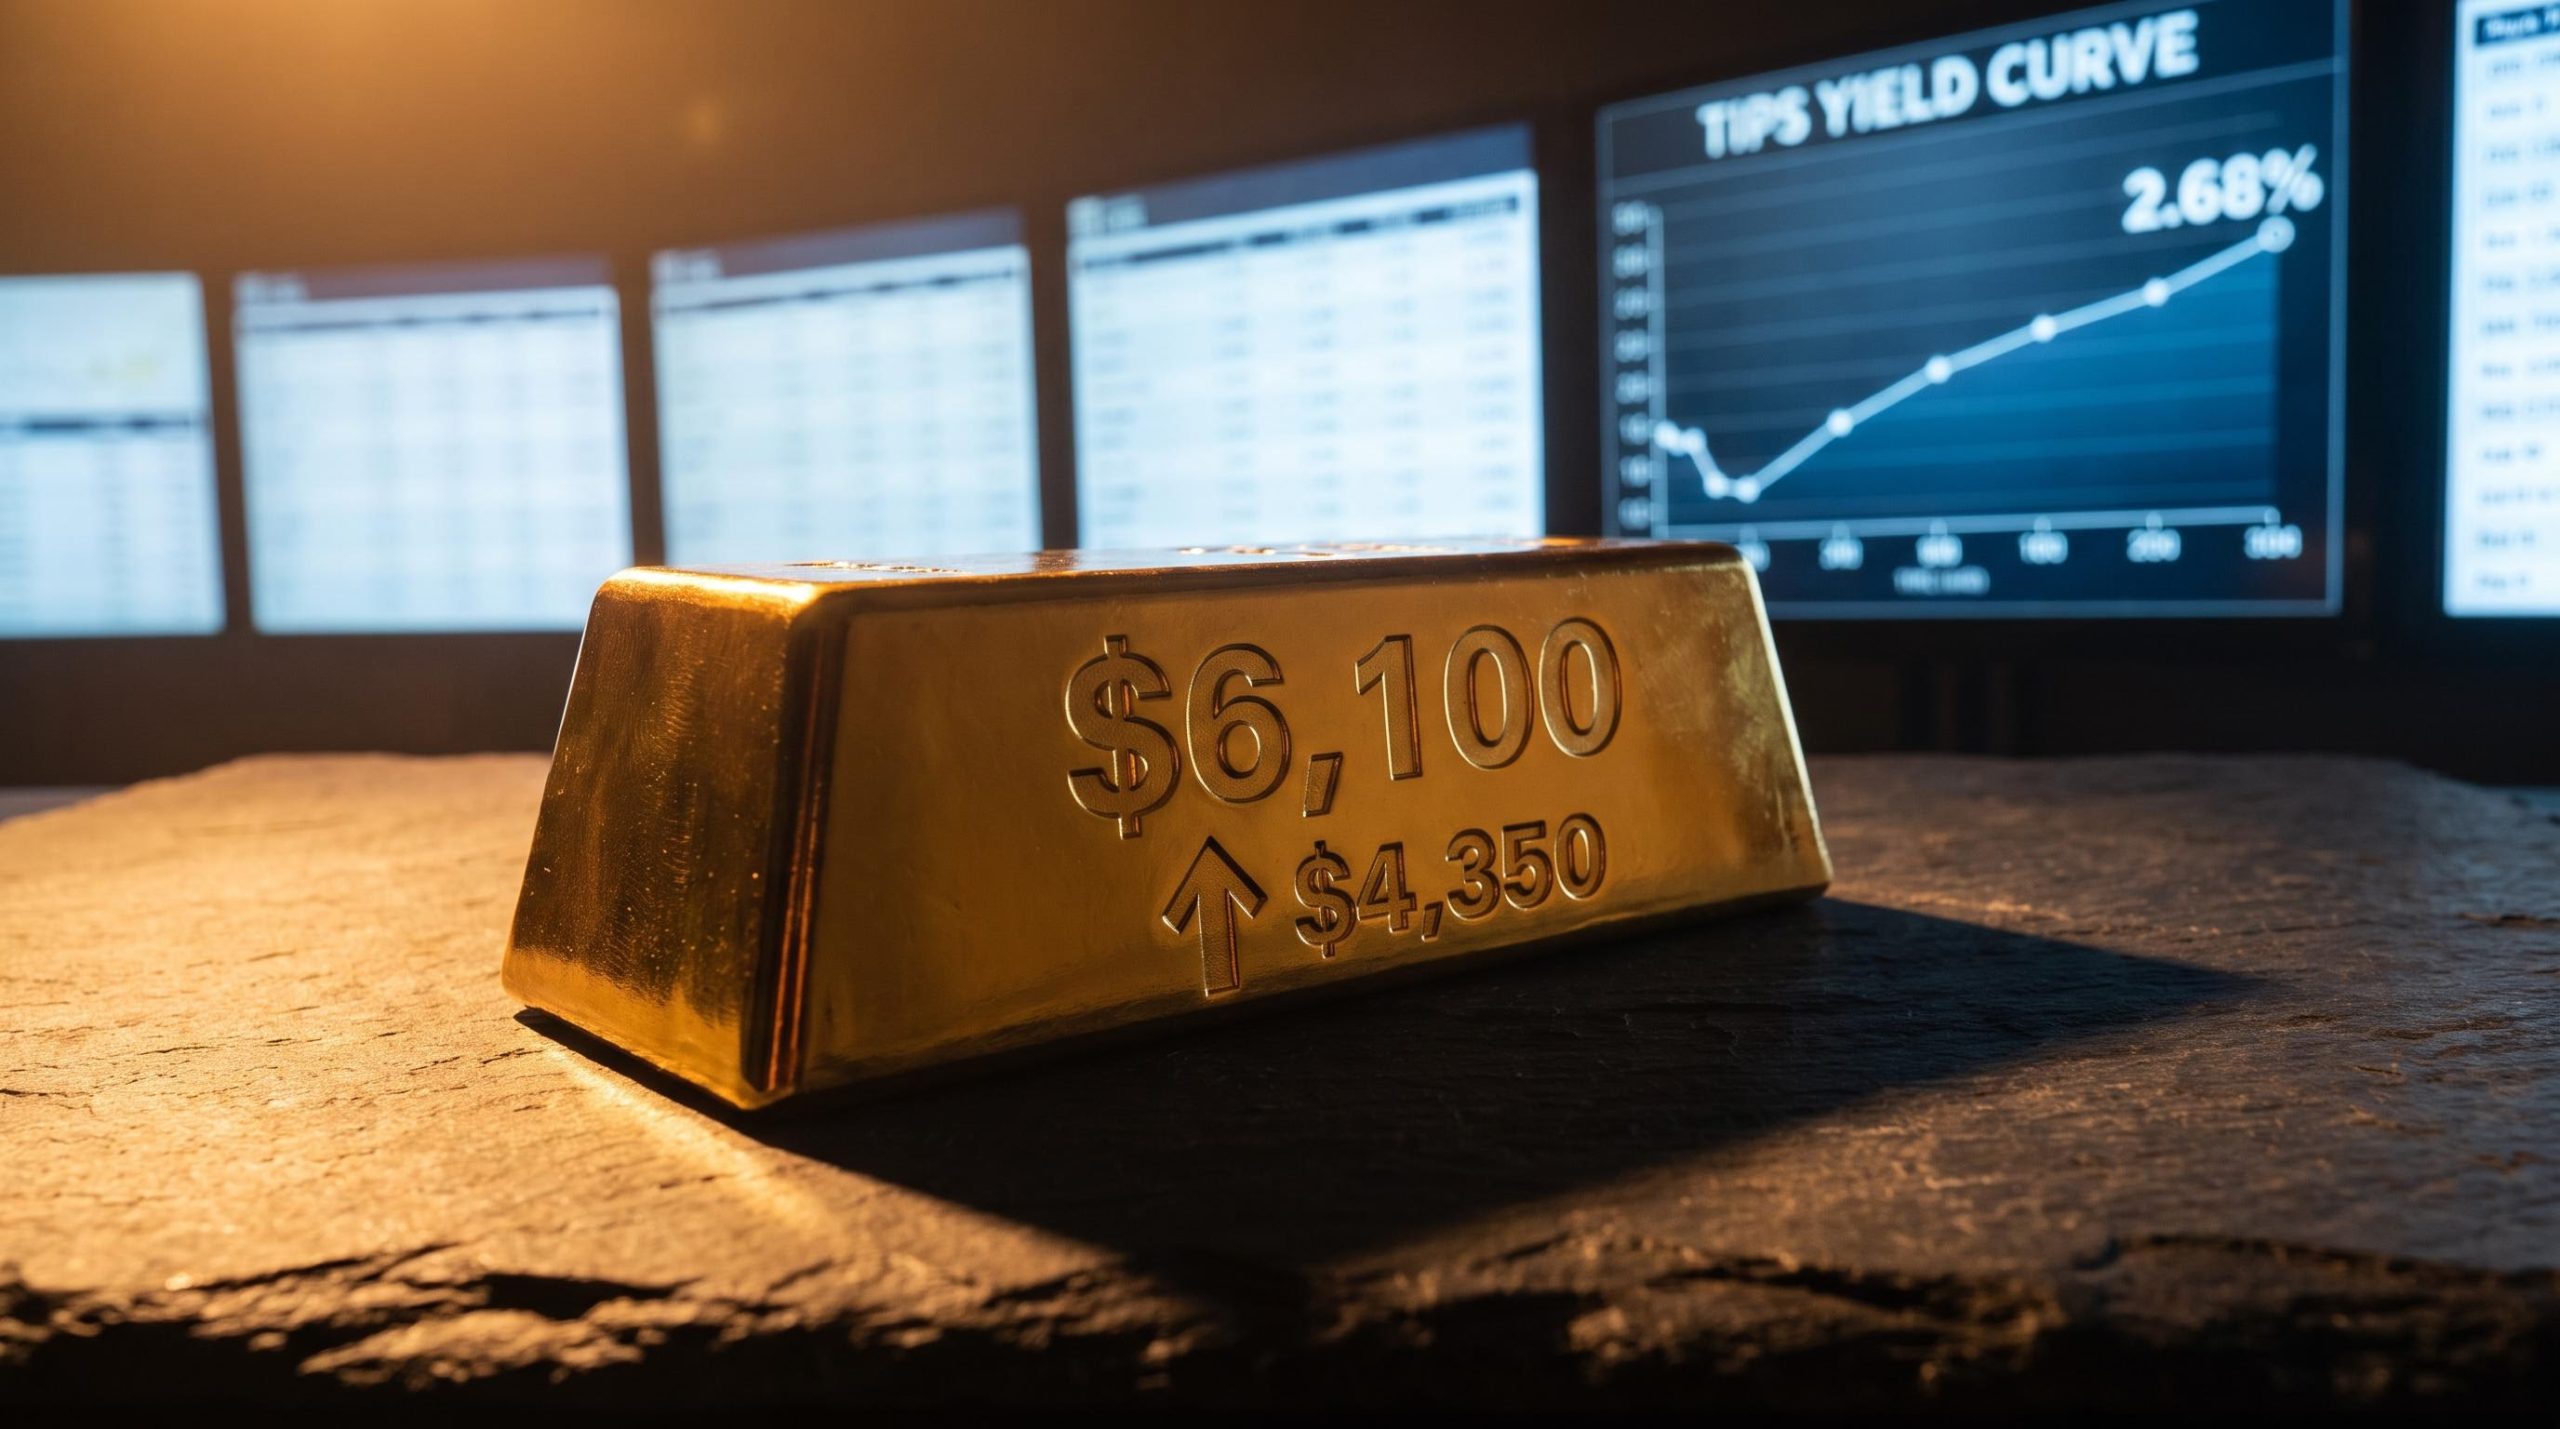
Bernstein’s $6,100 per ounce gold target for 2030 looks aggressive against a backdrop of 2.68% real yields and a Fed that raised rates again just days ago. Gold sits near $4,350 today, which means it needs to gain another 40% to get there.
The case for that move is not what most investors assume it is. The traditional gold playbook says rising real interest rates kill the rally, and real yields have climbed sharply since 2022. Gold has continued higher anyway.
Understanding why that decoupling is happening, and whether it can persist, is the analytical question that separates a credible long-run gold price forecast from an optimistic number on a slide deck. Bernstein’s structural thesis rests on a specific answer to it.
What follows maps the logic of the $6,100 target, the data that supports it, and the four conditions that would force a rethink. You should finish knowing exactly which indicators to monitor and why they matter.
The structural case: why Bernstein thinks this bull market is different
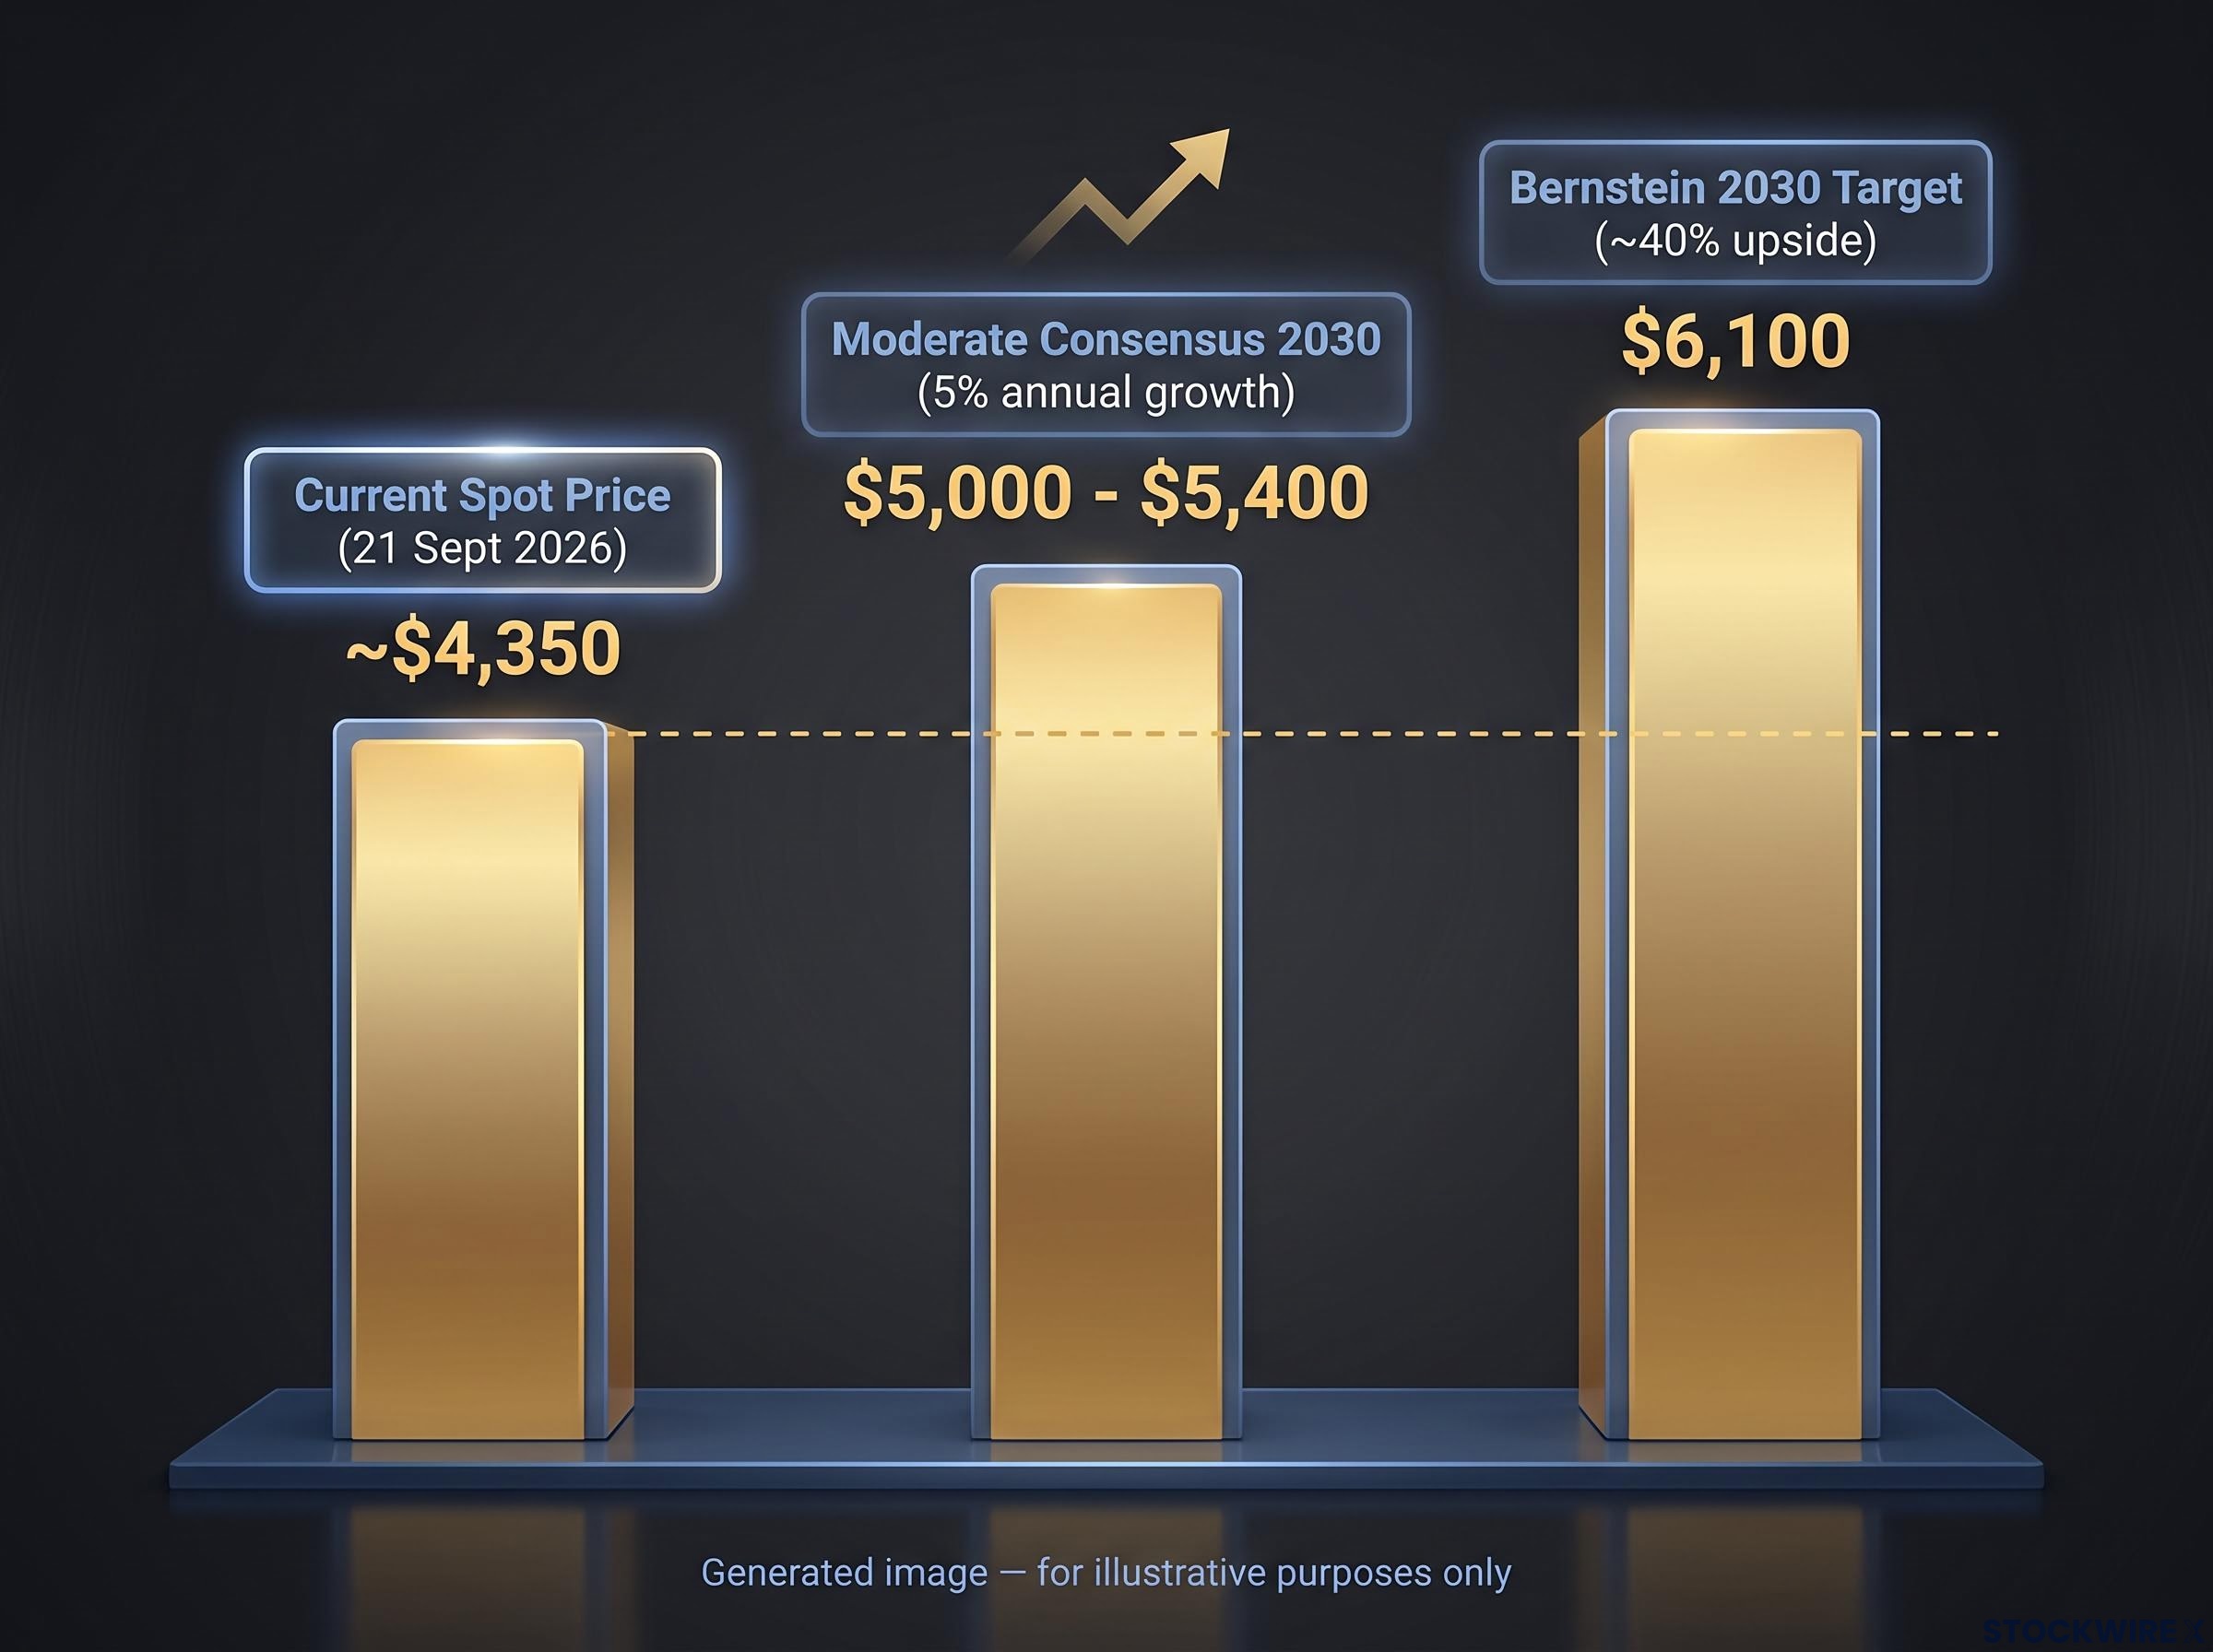
Bernstein analyst Bob Brackett set the firm’s 2030 gold target at $6,100 per ounce, a figure raised in February 2026 and held steady through the firm’s mid-year notes. Against spot gold of roughly $4,350 as of 21 September 2026, that target implies about 40% of further upside over the remaining years of the decade.
The forecast is not a momentum call. It rests on a specific claim about who is buying gold and why, and that claim is what makes the number defensible rather than hopeful.
What the $6,100 number actually represents
Getting from $4,350 to $6,100 by 2030 is not a vertical move. Spread across the remaining years to the end of the decade, it works out to a mid-single-digit annual return, which puts the Bernstein case slightly ahead of the pace but not in a different universe from it.
The thesis rests on central bank reserve diversification as a structural, multi-year demand driver. This is not a bet on inflation expectations or on retail sentiment. It is a bet that official institutions keep accumulating gold for geopolitical and counterparty-risk reasons.
Reserve diversification away from dollars has accelerated beyond the pace most institutional frameworks anticipated: the OMFIF Global Public Investor survey released in June 2026 recorded the first-ever instance of net dollar-reduction intent outnumbering net dollar-increase intent among sovereign institutions, a structural signal that underpins the price-insensitive demand central to the Bernstein thesis.
The changed identity of the marginal buyer
In previous cycles, the marginal buyer of gold was a retail investor reaching for an inflation hedge. In this one, it is a central bank managing sovereign risk. That distinction matters more than any single price level, because institutional balance-sheet decisions unwind far more slowly than retail sentiment does.
The catalyst was the freezing of roughly $300 billion in Russian foreign currency reserves in 2022. That single event reframed gold for reserve managers globally: assets held in foreign jurisdictions suddenly carried counterparty risk, and gold held at home did not.
The purchasing data since then supports the structural read:
- Central banks added 863 tonnes in 2025, down 21% from the record pace of 2022-2024 but still historically elevated.
- Q2 2026 official purchases reached 288.9 tonnes, a 62% year-on-year rise and a record for a second quarter in World Gold Council (WGC) data.
- H1 2026 net official purchases totalled roughly 346 tonnes, led by Poland and China.
- Gold’s share of official reserves has climbed to about 24%, while the US dollar’s share has fallen toward 58%.
89% to 95% of central banks surveyed by the WGC in 2026 expect global official gold reserves to increase over the next 12 months.
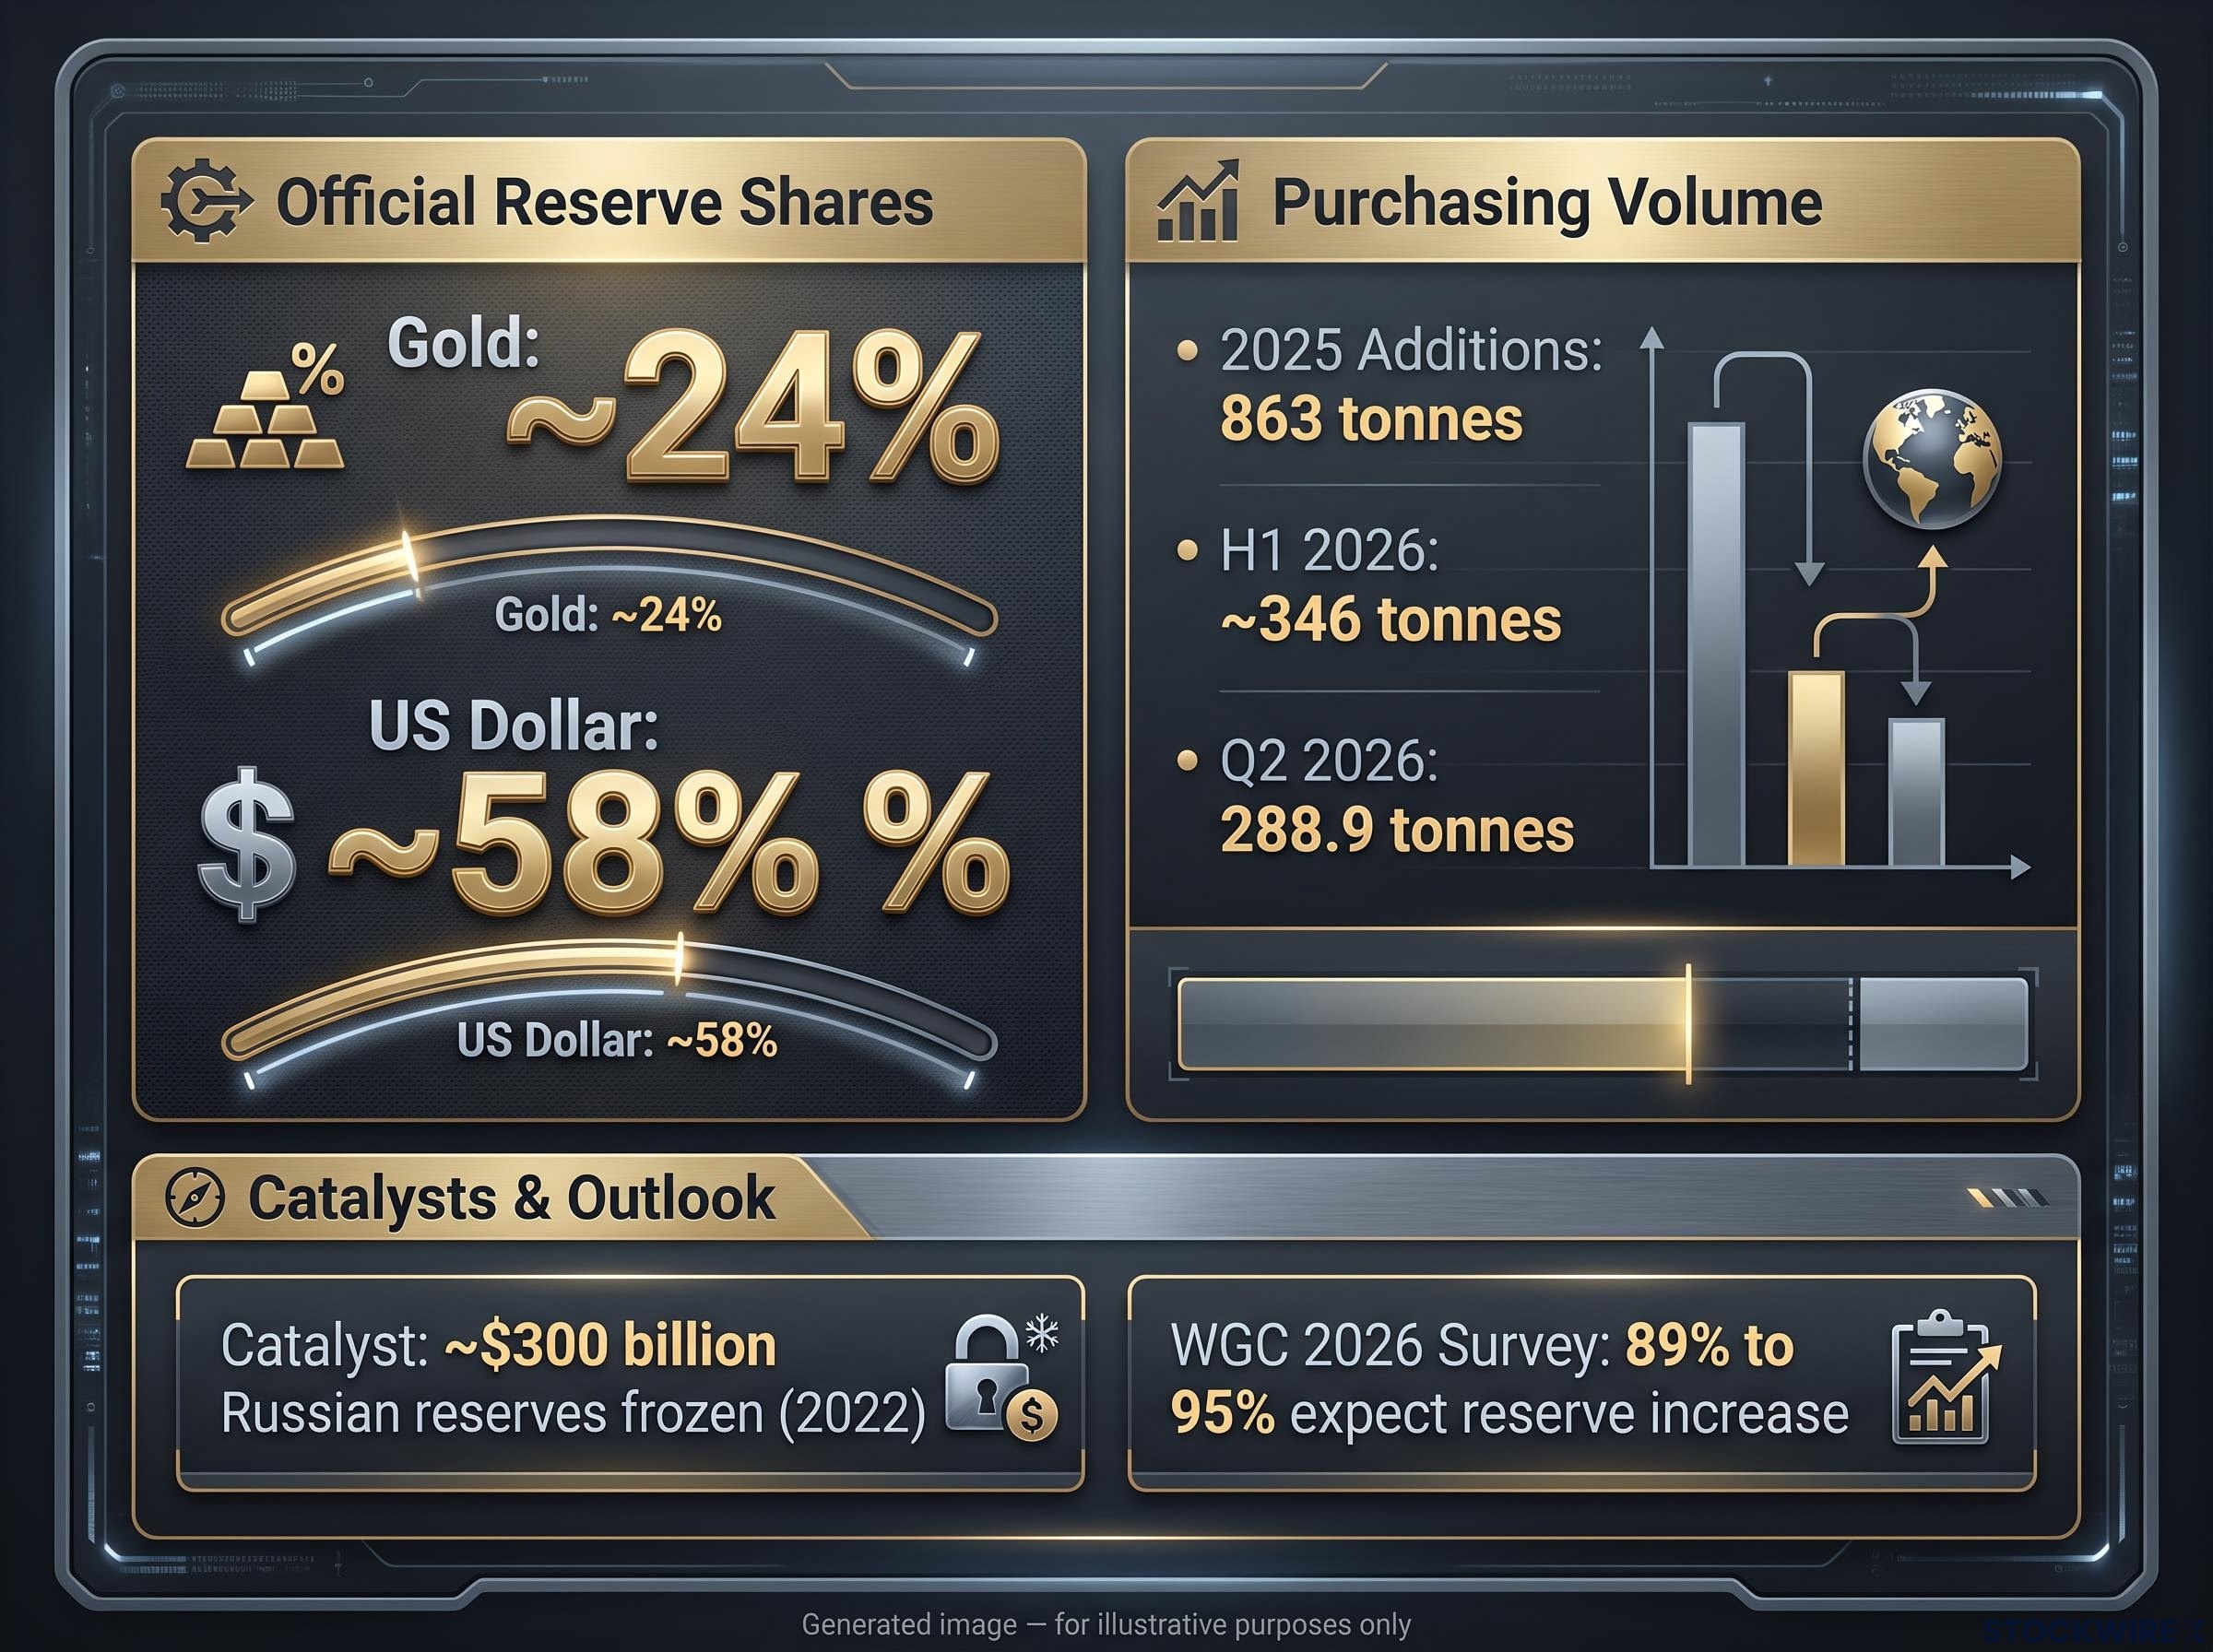
The Q2 record tells you something specific: institutional demand is not decelerating into the price rally. It is accelerating. That is the opposite of what purely momentum-driven bull markets tend to show at this stage, and it is the single most important reason to take the $6,100 number seriously.
When big ASX news breaks, our subscribers know first
Why gold keeps rising even as real yields climb
For decades, gold and real interest rates moved in opposite directions. When real yields rose, the metal fell, because holding an asset that pays no income becomes more expensive when safe bonds pay more. Since 2023, that relationship has broken down, and the break is the central analytical question for the $6,100 forecast.
Gold finished the March 2022 to March 2023 Fed hiking cycle higher than where it started, a result that exposed the limits of the standard real yield framework and forced a reassessment of how opportunity cost interacts with geopolitical and institutional demand when both are simultaneously in play.
Consider where real yields actually sit. Inflation-protected US government bonds now pay historically high real returns across the curve.
| Yield Tenor | Real Yield Rate | Historical Expected Gold Pressure |
|---|---|---|
| 5-year TIPS | 2.55% | Negative |
| 10-year TIPS | 2.68% | Negative |
| 30-year TIPS | 3.09% | Negative |
Under the pre-2022 framework, a 10-year TIPS real yield of 2.68% as of 18 September 2026 would be a serious headwind. The Fed only reinforced the pressure, raising rates at its 16 September 2026 meeting and projecting a policy rate in the 4.00%-4.25% range through 2026 and 2027. Markets are pricing roughly a 90% chance of one more quarter-point hike by year-end.
Gold has risen through all of it. That tells you the metal is now pricing a geopolitical and fiscal risk premium that yield models alone cannot capture.
The mechanism behind the decoupling is specific. When Western investors dumped gold ETF holdings during the 2022-2023 yield surge, aggressive central bank buying absorbed the selling. The price collapse that historical models predicted never arrived because a new, price-insensitive buyer had entered the market.
ETF outflows during the first leg of the rally were nearly 800 tonnes between Q4 2020 and Q2 2024, even as the gold price roughly doubled, a divergence that confirmed central bank and OTC buying as the price-setting force and demonstrated why the historical model linking ETF flows to gold direction broke down precisely when it was most widely relied upon.
Then the second leg arrived. From mid-2024, ETF holdings themselves swung back into strong inflows, reversing the outflows that dominated 2022-2023. Retail demand stopped fighting institutional demand and started reinforcing it.
The seizure of roughly $300 billion in Russian foreign currency reserves in 2022 reframed gold from an inflation hedge into a counterparty-risk hedge. That reframing is why yields matter less to the price than they used to.
For you, the practical read is this: the decoupling is not magic, and it is not permanent. It holds as long as central bank buying and the geopolitical premium persist. Assessing whether those two conditions survive to 2030 is the whole game.
What the historical record says about multi-decade gold cycles
Gold bull markets do not end on valuation. They end when the conditions that started them are credibly reversed. Two prior cycles show the pattern clearly, and both offer a lens on where the current run sits.
| Cycle | Starting Price | Peak Price | Approx. Gain | Primary End Condition |
|---|---|---|---|---|
| 1971-1980 | $35/oz | ~$850/oz | ~2,300% | Volcker rate hikes restored dollar confidence |
| 2001-2011 | ~$270/oz | ~$1,921/oz | ~600-659% | Real rates normalised, QE enthusiasm waned |
| 2015-present | ~$1,057/oz | ~$4,350/oz (ongoing) | Ongoing | Not yet reversed |
The 1971-1980 run followed the collapse of the Bretton Woods system, feeding on oil shocks, runaway inflation and geopolitical crisis. It ended only when Paul Volcker’s aggressive real rate hikes rebuilt confidence in the dollar.
The 2001-2011 cycle rose on dollar weakness, the aftermath of 9/11, the global financial crisis and quantitative easing. It faded as real rates normalised and the enthusiasm for money-printing wore off.
The sequence that ended each run is consistent enough to name:
- Inflation gets contained.
- Real interest rates turn persistently positive.
- Confidence in fiat currencies is restored.
- The premium that drove the rally compresses.
Two things stand out when you hold that sequence against today. First, real rates are already persistently positive at 2.68%, yet the rally has continued, because the current cycle layers a geopolitical premium and institutional accumulation on top of the old macro drivers. The starting conditions have not reversed.
Second, decade-long bulls have historically produced late-cycle surges of 150% to 160% in their final phase, and these cycles have run 10 to 20 years. A move from $4,350 to $6,100, a gain of roughly 40%, is modest against that precedent. The history tells you the target is plausible on magnitude. It also tells you exactly what would kill it: a credible reset of the conditions that started the run, which has not yet appeared.
The commodity supercycle framework offers a longer historical lens on the same structural question: documented supercycles last 10-35 years and end only when the policy-anchored demand transformation that triggered them is credibly reversed, a sequencing that maps directly onto the conditions the Bernstein thesis identifies as necessary for the 2015-present gold cycle to terminate.
The risks that could break the $6,100 thesis before 2030
A forecast is only as useful as the framework for knowing when it is wrong. The risks to the Bernstein case are not a disclaimer to append at the end; they are the signals that tell you whether the thesis is holding. They fall into two categories that matter very differently.
- Central bank deceleration: A sustained slowdown in official buying removes the price-insensitive demand that has absorbed every ETF sell-off.
- Emerging-market selling pressure: War-driven liquidity needs, energy bills and currency volatility can convert net buyers into net sellers to fund shortfalls.
- Geopolitical premium reversal: Fading sanctions risk or shifting legal frameworks would erode the counterparty-risk motive that reframed gold in 2022.
- Fiscal credibility reset: If major sovereigns commit credibly to sustainable debt paths, the policy-risk premium compresses.
Risks that slow the timeline
The first two risks would delay the path to $6,100, not destroy the case for it. Purchasing pace is already showing volatility. Q1 2026 official demand was revised down sharply to just 57 tonnes, from an initial report of 244 tonnes, and total 2026 official demand is expected to finish below the 863 tonnes recorded in 2025.
That revision is not a footnote. It tells you official demand figures carry real uncertainty, and that a genuine, sustained deceleration would remove the primary pillar holding the thesis together. Emerging-market central banks facing fiscal pressure have already shown they will sell gold to fund budget gaps when forced to.
Risks that invalidate the structural thesis
The deeper danger is a reversal of the conditions that started the cycle. The International Monetary Fund (IMF) argues gold is ill-suited to the liquidity portion of reserves given its volatility, and recommends explicit market-risk haircuts. Those institutional critiques matter because they shape how conservative reserve managers weight gold.
IMF guidance on gold in central bank reserves published in June 2026 recommends explicit market-risk haircuts given the metal’s price volatility, and cautions that valuation gains should not be read as durable improvements in reserve adequacy, a position that shapes how conservative reserve managers weigh further accumulation.
If dollar and euro assets regain appeal through sustained positive real yields without major sanctions risk, central banks could rebalance away from the metal. Credible fiscal consolidation or geopolitical de-escalation would do the same by removing the premium at the thesis’s core.
The National Bureau of Economic Research (NBER) finds that much of the rise in gold’s share of global reserves reflects valuation effects, gold simply becoming worth more, rather than a genuine reallocation of volume away from dollar assets. It is the single most important caution against over-reading the diversification data.
For balance, note the consensus itself is more conservative than Bernstein. Moderate institutional forecasts cluster around $5,000 to $5,400/oz by 2030, built on a 5% annual growth assumption. That gap is where the real debate lives.
Past performance does not guarantee future results. Financial projections are subject to market conditions and various risk factors, and these statements are speculative and subject to change based on market developments.
What the $6,100 thesis requires you to believe, and what to watch
The Bernstein forecast is defensible under one strict condition: central bank demand stays structurally elevated and the geopolitical risk premium does not mean-revert. Break either, and the case for $6,100 weakens toward the consensus range.
That $5,000-$5,400 consensus is a reasonable base case, and $6,100 is the bull scenario sitting above it. The gap is not noise. It is a specific bet on whether this cycle’s structural conditions persist or partially normalise, and a handful of data points will tell you which is unfolding.
| Thesis Condition | Observable Indicator | Warning Signal |
|---|---|---|
| Structural official demand | Annual WGC central bank survey | Buying intentions drop below survey norms |
| Geopolitical premium intact | Sanctions and counterparty-risk news | Credible de-escalation or legal reset |
| Rate environment | Quarterly TIPS real yields | Real yields rise with no offsetting risk |
| Retail participation | Gold ETF flow direction | Sustained reversion to outflows |
Track four things in order of importance:
- The annual WGC survey, as the leading read on official demand intentions.
- Quarterly TIPS real yields, as the rate-environment monitor.
- Sanctions and geopolitical developments, as the counterparty-risk gauge.
- ETF flow direction, as the retail demand signal.
This article is for informational purposes only and should not be considered financial advice. Investors should conduct their own research and consult with financial professionals before making investment decisions.