
You found a company you genuinely believed in. The story made sense, the numbers looked strong, and you bought in with a plan to hold for years. Then the stock dropped 15% in a single session, your stomach turned, and you sold by lunchtime.
Here is the uncomfortable part. The problem was not the stock, and it was not the intraday drop. The problem was that you selected the stock using long-term conviction, then behaved like a day trader the moment it moved against you. The reason you bought and the length of time you planned to hold never matched.
Most stock-picking advice ignores this entirely. It treats selection as one universal process, as if the qualities that make a company worth owning for a decade are the same qualities that make it worth trading before the closing bell. They are not. In many cases, they directly contradict each other.
The three main approaches, day trading, swing trading, and long-term investing, each demand a separate qualification checklist that you apply before a position is even considered.
This guide gives you those three checklists, a worked example run through all of them, and a clear view of what breaks when you use the wrong one. By the end, you will know which questions to ask before entering any position, based on how long you actually intend to hold it.
Why holding period is the starting point for every stock decision
The single most important variable in stock selection is not the sector, the theme, or an analyst’s price target. It is how long you plan to hold.
Everything downstream follows from that one decision. Liquidity needs, volatility tolerance, fundamental standards, and how much risk your capital can absorb are all set by your holding period. Get this wrong and the rest of your process is built on sand.
Each style carries its own qualification checklist, and those checklists can flatly contradict each other. The low volatility you want in a long-term holding is the same low volatility that makes a stock useless for a day trade. The wild intraday range that a day trader hunts for is exactly what would force you to babysit a long-term position and eventually panic out of it.
This is not a matter of taste. Applying the wrong criteria systematically amplifies overtrading, slippage, and behavioural mistakes, and it does so before you have placed a single order.
The behavioural cost of overtrading is larger than most traders account for: Barber and Odean found the most active individual investors underperformed the least active by approximately 6.5 percentage points annually, a gap driven almost entirely by transaction costs and emotional overreaction rather than analytical error.
Consider the practical reality. If you pick a stock using long-term quality criteria and then try to day trade it, you have already made a structural error before the market opens. No amount of chart-reading fixes a mismatch that was baked into the selection stage. The chart is downstream of the decision you already got wrong.
It is worth noting that the question retail trading educators hear most often is how to identify which stocks to even look at when a session begins. That tells you selection is not an academic side issue. It is the foundational problem most traders never solve.
The three styles you will work through in this guide, each with its own logic, are:
- Day trading: Intraday holding period. You are anticipating a short-term bounce within a single session, nothing more.
- Swing trading: Multi-day to multi-week holding period. You are combining chart levels, market bias, and company quality.
- Long-term investing: Roughly a 10-year horizon. You want capital that compounds without constant attention.
Fix the holding period first. Only then do the criteria in the following sections make sense as a system rather than a random set of rules.
When big ASX news breaks, our subscribers know first
Day trading criteria: liquidity, intraday volatility, and level identification
A day trade entry anticipates an intraday bounce, and nothing beyond it. You are not making a statement about where the company is headed next quarter. That narrow objective is what your selection criteria have to match.
Three filters do the work here, and all three must clear before you consider a name.
- High liquidity: Tight spreads and enough volume that you can enter and exit without moving the price against yourself.
- Optimal volatility: Enough daily movement to create a profit opportunity, but not so much that the stock becomes unpredictable and your fills fall apart.
- Identifiable intraday levels: Clear support or resistance zones where price has a history of reacting within a session.
On volatility, Investopedia’s guidance offers a practical threshold worth keeping in mind.
Day-tradeable stocks typically move 3% to 5% per day, enough range to justify an intraday trade without tipping into chaos.
Note that regulatory and educational materials describe volatility qualitatively. No major broker education platform was found to publish a standardised beta or average true range cutoff that separates day-trade candidates from everything else. The 3% to 5% guideline is a rule of thumb, not a hard rule.
Not all support levels are equal, and the hierarchy matters enormously for day trades.
| Level type | Relative strength | Example |
|---|---|---|
| Post-earnings pivot low | Strongest | The reaction low set after an earnings report |
| Annual low | Strong | The lowest price over the past year |
| Gap-fill level | Weaker, still tradeable | Duolingo near approximately $130 |
Take that Duolingo gap-fill level near $130. It is not a conviction call on the company’s direction. It is simply a spot where price has reacted before, useful for a short-term bounce.
That distinction is where day traders quietly blow up their own plans. If you treat the level as a reason to believe in the stock rather than a reason to expect a bounce, you hold through the pop, and your planned scalp turns into an unintended overnight position you never sized for.
If you have been picking day trades based on a compelling news story or a fundamental thesis, this is why they so often fail to move the way you expected. You were selecting for the wrong thing entirely.
Swing trading criteria: chart levels, market bias, and fundamental quality
Swing trading looks like it uses more criteria than day trading, and it does. What matters is that you apply them in sequence, because each filter gates the next.
- Assess overall market bias first. A beaten-down stock in an oversold market leans toward a long, not a short. The broad environment sets which direction you should even be looking.
- Identify chart support levels second. You want a first-tier pivot low and a deeper secondary level, so you know where price is likely to react.
- Evaluate fundamental quality third. This either confirms the candidate or throws it out, regardless of how clean the chart looks.
Run Duolingo through this and you can see the sequence at work.
| Criterion | Finding | Verdict |
|---|---|---|
| Market bias | Recovered roughly 68-70% from its April low, potentially overextended to the upside | Caution |
| First-tier support | Post-earnings pivot low near $112, about a 24-25% decline from the then-current price | Level identified |
| Second-tier support | Yearly low, roughly a 40% decline, entry interest near $90 | Level identified |
| Fundamental quality | Uncertain competitive durability from potential technology disruption | Disqualified |
Here is the punchline. Duolingo had declined roughly 73-76% from its peak and had identifiable, valid chart levels. It still failed the swing screen, because doubt about its competitive durability overrode the technical setup.
That is the lesson most swing traders miss. Having a chart level is necessary, but it is not sufficient. Fundamental doubt about a company’s staying power can veto a technically clean trade, and it should.
For context, practitioners split into two camps here. Momentum-centric traders, following frameworks like William O’Neil’s CAN SLIM or Mark Minervini’s work, lead with price strength and treat fundamentals mainly as a filter for weak names. Fundamentally anchored traders insist strong financials come first, arguing momentum without backing reverses too sharply. Both are legitimate. What they share is a refusal to trade on the chart alone.
The overextension problem: why “has support” is not enough
A stock can have a perfectly good support level and still be a bad swing entry. That is the overextension trap.
Duolingo had already bounced roughly 68-70% from its low. Even with a deeper support level sitting below, chasing a long into that kind of recovery means you are buying after most of the easy move is gone.
The same logic runs in reverse. A stock stretched to extended highs is not a clean short just because a resistance level exists overhead. Overextension disqualifies entries in both directions, not just one. The presence of a level tells you where price might react. It says nothing about whether you should be entering there at all.
Long-term investing criteria: durability, dividends, and low volatility
Now flip the timeframe out to a decade, and everything you wanted in a day trade becomes a liability.
The criteria that look conservative, even boring, from a short-term seat are exactly what let capital compound without you touching it. That is not risk aversion. It is a deliberate design choice.
Three criteria define a genuine long-term candidate.
- Business durability: A well-established, decades-old name with a high likelihood of still operating in 10 years. This is the non-negotiable baseline.
- Dividend payments: A preference for businesses that pay you income during the holding period, not just companies you hope will rise in price.
- Low price volatility: Movement gentle enough that you are not forced to react. This is the criterion most investors skip, and it matters more than they realise.
That last point is where Duolingo gets excluded outright.
The stock rose roughly 90% over a few months from April to August, then dropped around 18% within a matter of days. That is textbook exclusion territory for a long-term hold, because a position that swings like that demands constant attention.
Read the criterion carefully. It is not “is this a good company.” It is “can this position manage itself.” Duolingo’s price behaviour answers that with a flat no. Holding it would require you to watch it daily, and continuous monitoring is structurally incompatible with the entire point of long-term investing.
The cost of mistimed exits compounds quietly over decades: Vanguard data shows that missing just five of the best trading days between 1996 and 2024 reduced final wealth by more than $340,000, which is why the low-volatility filter in the long-term checklist is designed to prevent the kind of reactive selling that produces those missed days.
Most retail investors quietly mix high-volatility growth names into accounts meant for the long haul, then wonder why they cannot stop checking prices. The volatility filter is the specific criterion that prevents that outcome. It is also the one they leave out.
Where the two long-term frameworks agree, and where they split
There are two respectable ways to build a long-term portfolio, and they part company on one question.
The tension you need to resolve for yourself: Are you investing for income, or for compounding? Your answer decides which framework governs your selection.
Both agree completely on the baseline. Business durability over a 10-year horizon is non-negotiable under either approach. A structurally declining company is out, full stop.
They diverge on dividends. The dividend-focus framework treats non-dividend-paying growth stocks as unsuitable for retirement portfolios, because income certainty matters. The total-return or quality framework, often associated with a Warren Buffett style, accepts high-volatility growth names if the competitive advantage and reinvestment opportunity are strong enough to justify long-term compounding.
Neither is wrong. But you cannot apply both at once, so answer the question honestly: income, or compounding? Your selection criteria change depending on which one you actually want.
What goes wrong when you apply the wrong criteria to the wrong trade
Mismatching criteria harms you on two levels. There is a structural layer, built into the mechanics of the trade, and a behavioural layer, built into your own psychology. The structural one comes first, and it sets up the behavioural one.
Start with the mechanics.
| Mismatch type | What goes wrong | Who it affects |
|---|---|---|
| Liquidity and volatility mismatch | Stable long-term names do not move enough for a day trade; volatile day-trade names destroy long-term compounding | Traders using the wrong style’s stock for the job |
| Transaction cost drag | Frequent short-term trading in instruments chosen for long-term quality erodes returns through fees | Overtraders ignoring per-trade costs |
| Disposition effect | Day trades silently become multi-week holdings because the trader “believes in” the company | Traders using long-term narratives for short-term bets |
The cost problem is more concrete than most traders admit. FINRA lays it out numerically.
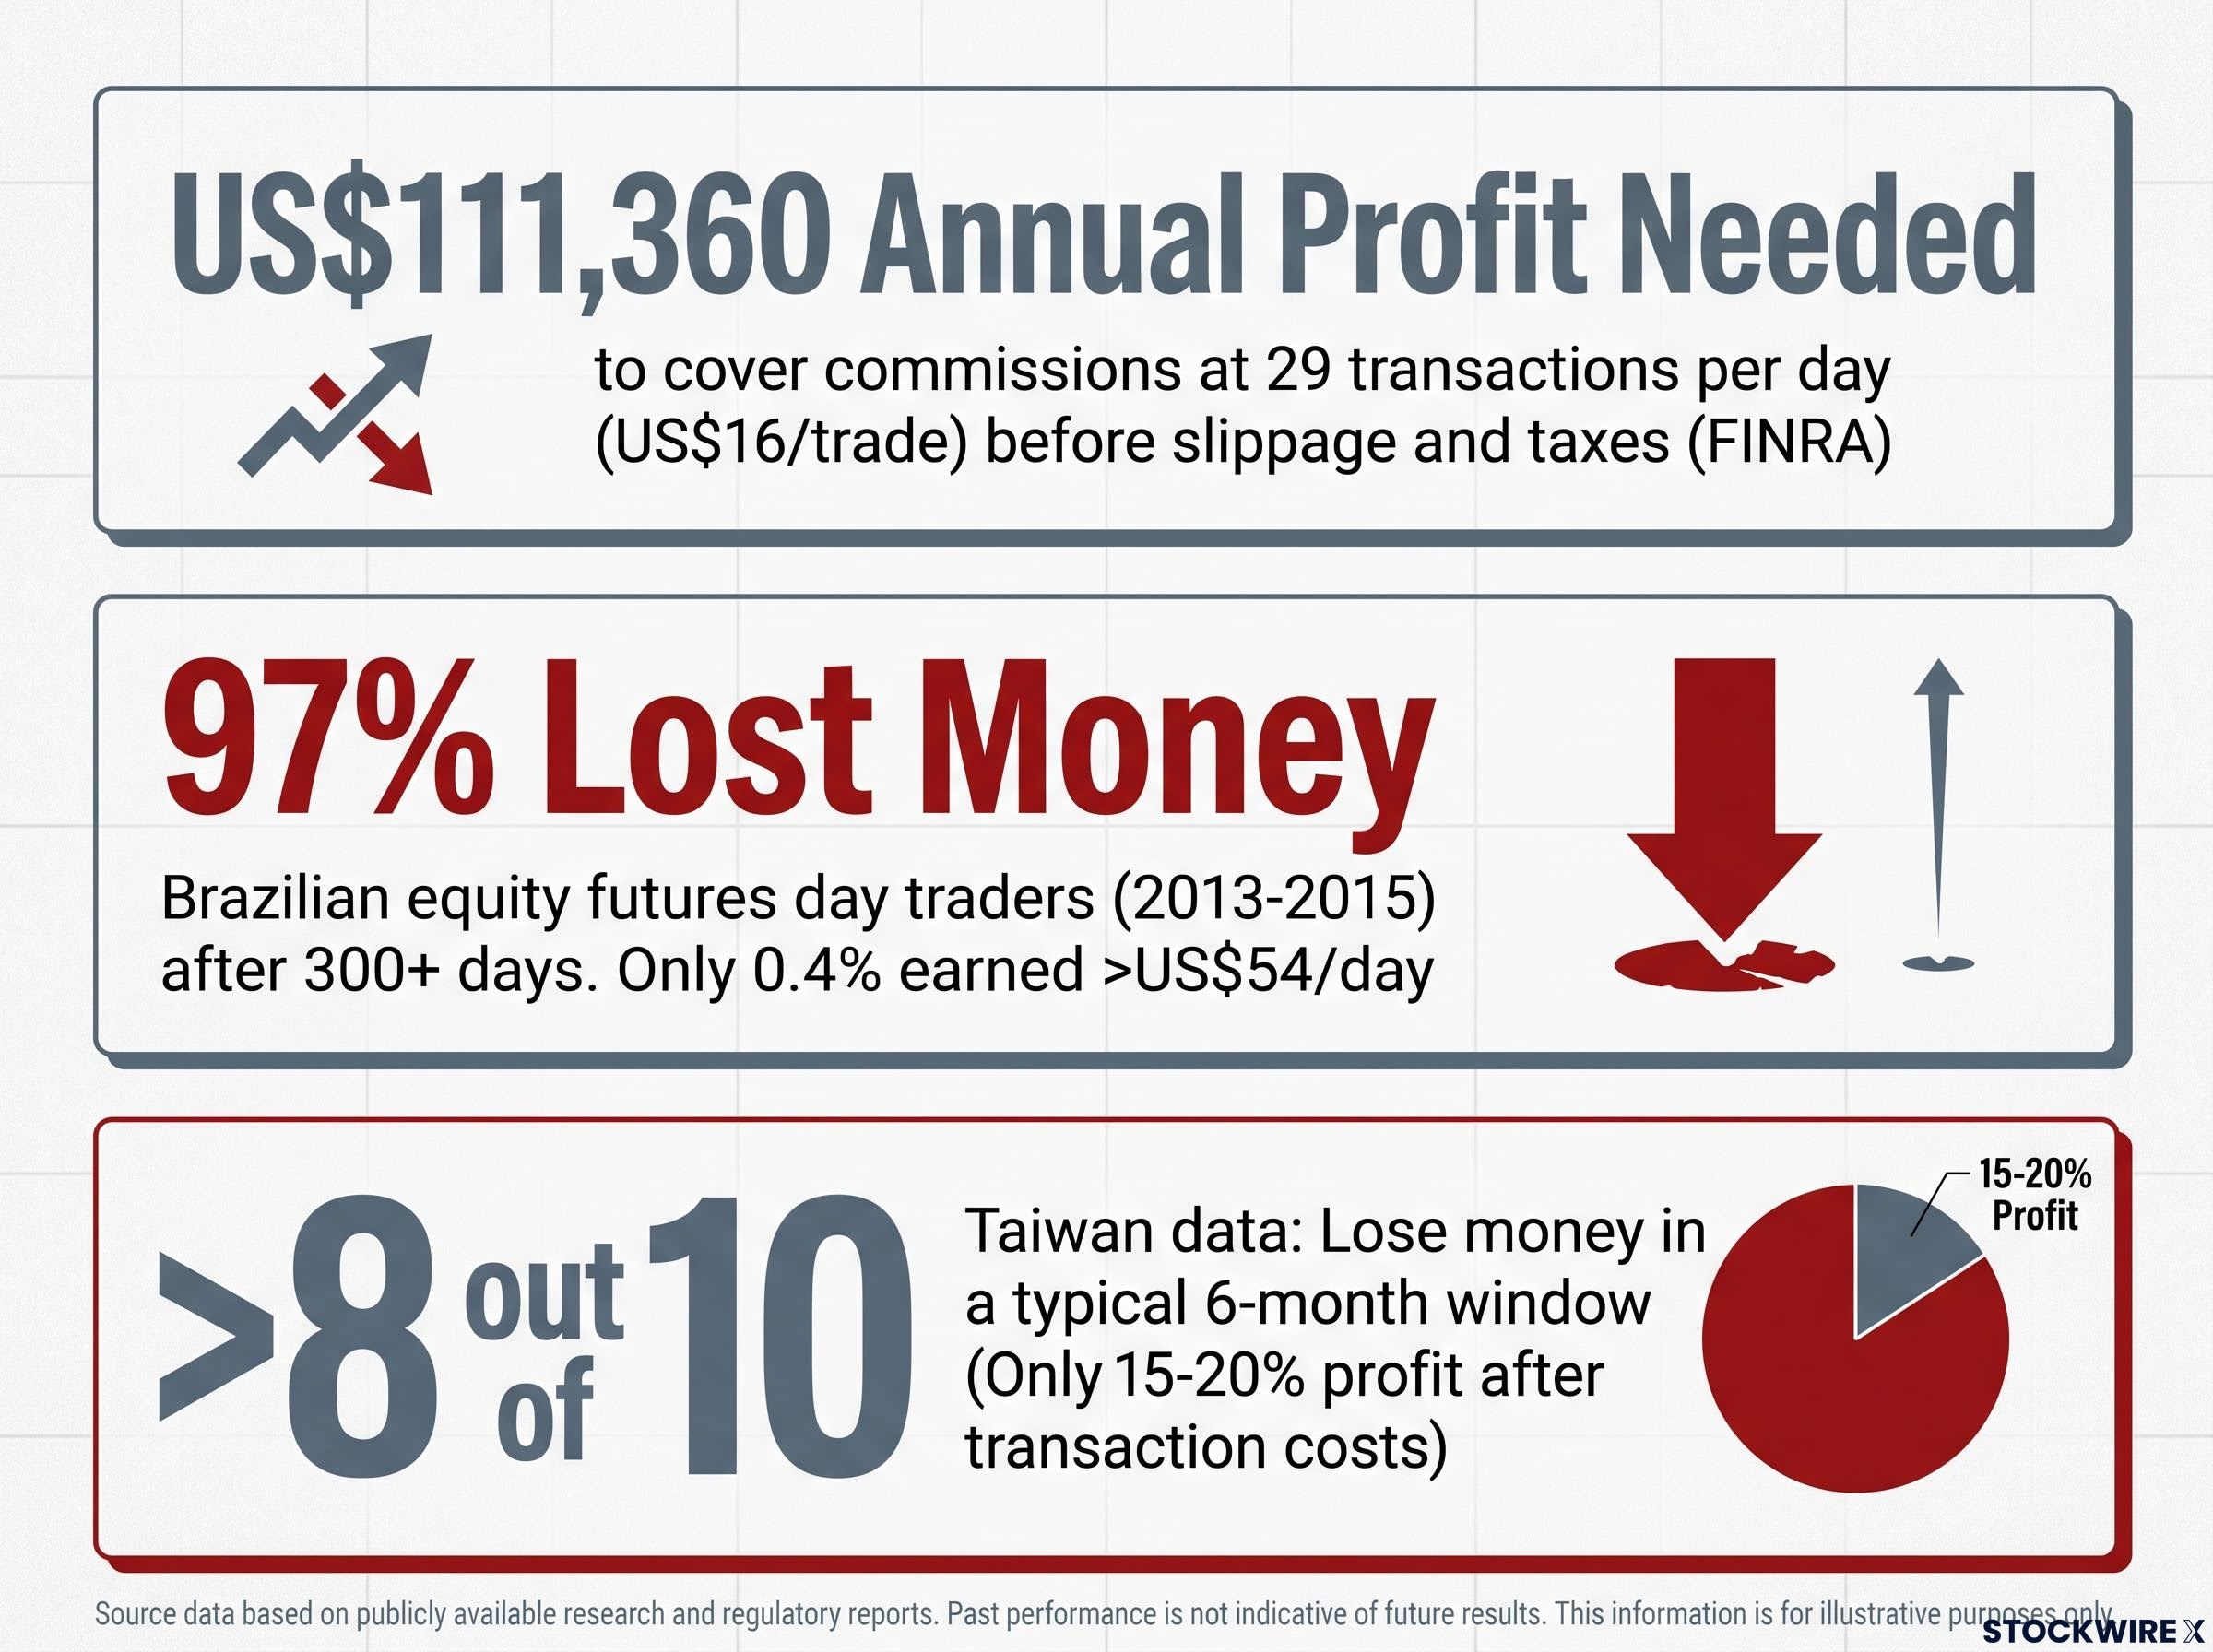
At 29 transactions per day and US$16 per trade, you would need US$111,360 in annual profit just to cover commissions, before slippage and taxes even enter the picture.
That is the structural hurdle you clear before the first winning trade counts for anything. Now layer the performance evidence on top.
A study of Brazilian equity futures day traders across 2013-2015 found that 97% of those who persisted for at least 300 days lost money net of fees. Only 0.4% earned more than a bank teller’s wage of US$54 per day.
The Taiwan data is a touch less brutal but points the same way. In a typical six-month window, more than eight out of ten day traders lose money, and only around 15-20% turn a profit after transaction costs. The North American Securities Administrators Association, in a 2025 assessment, concluded that the majority of day traders lose their money, and that novice, undercapitalised traders fare worse still.
Here is the read you should take from that 97% figure. It is not primarily a warning about day trading as an activity. It is a warning about the gap between the edge you think you have and the edge you actually have, and a meaningful slice of that gap is created before your first trade, at the moment you select a stock with criteria that never fit your intended holding period.
The behavioural biases that finish the job are worth naming directly.
The disposition effect operates across all three trading styles: research shows that randomly selected sell decisions outperformed professional portfolio managers by up to 150 basis points annually, because the tendency to sell winners too early and hold losers too long is not corrected by skill or experience without explicit rules to counter it.
- Disposition effect: Selling winners too fast and clinging to losers, which is precisely how a planned day trade mutates into an unplanned long-term position.
- Fundamental narrative trap: Using a company’s long-term story, its brand or moat, to justify a short-term speculative bet, then refusing to stop out because you “believe in it.”
- Transaction cost blindness: Carrying buy-and-hold cost assumptions into a high-frequency strategy where fees compound against you every session.
You likely read those loss statistics and assumed they describe other people. The mismatch problem is why they might describe you. The damage starts at the screening stage, long before the market opens.
Building your pre-trade checklist: matching each stock to the right style
Enough diagnosis. Here is the routine you actually run before the next stock you look at.
Put the three checklists side by side and the shared criteria, along with the mutually exclusive ones, become obvious.
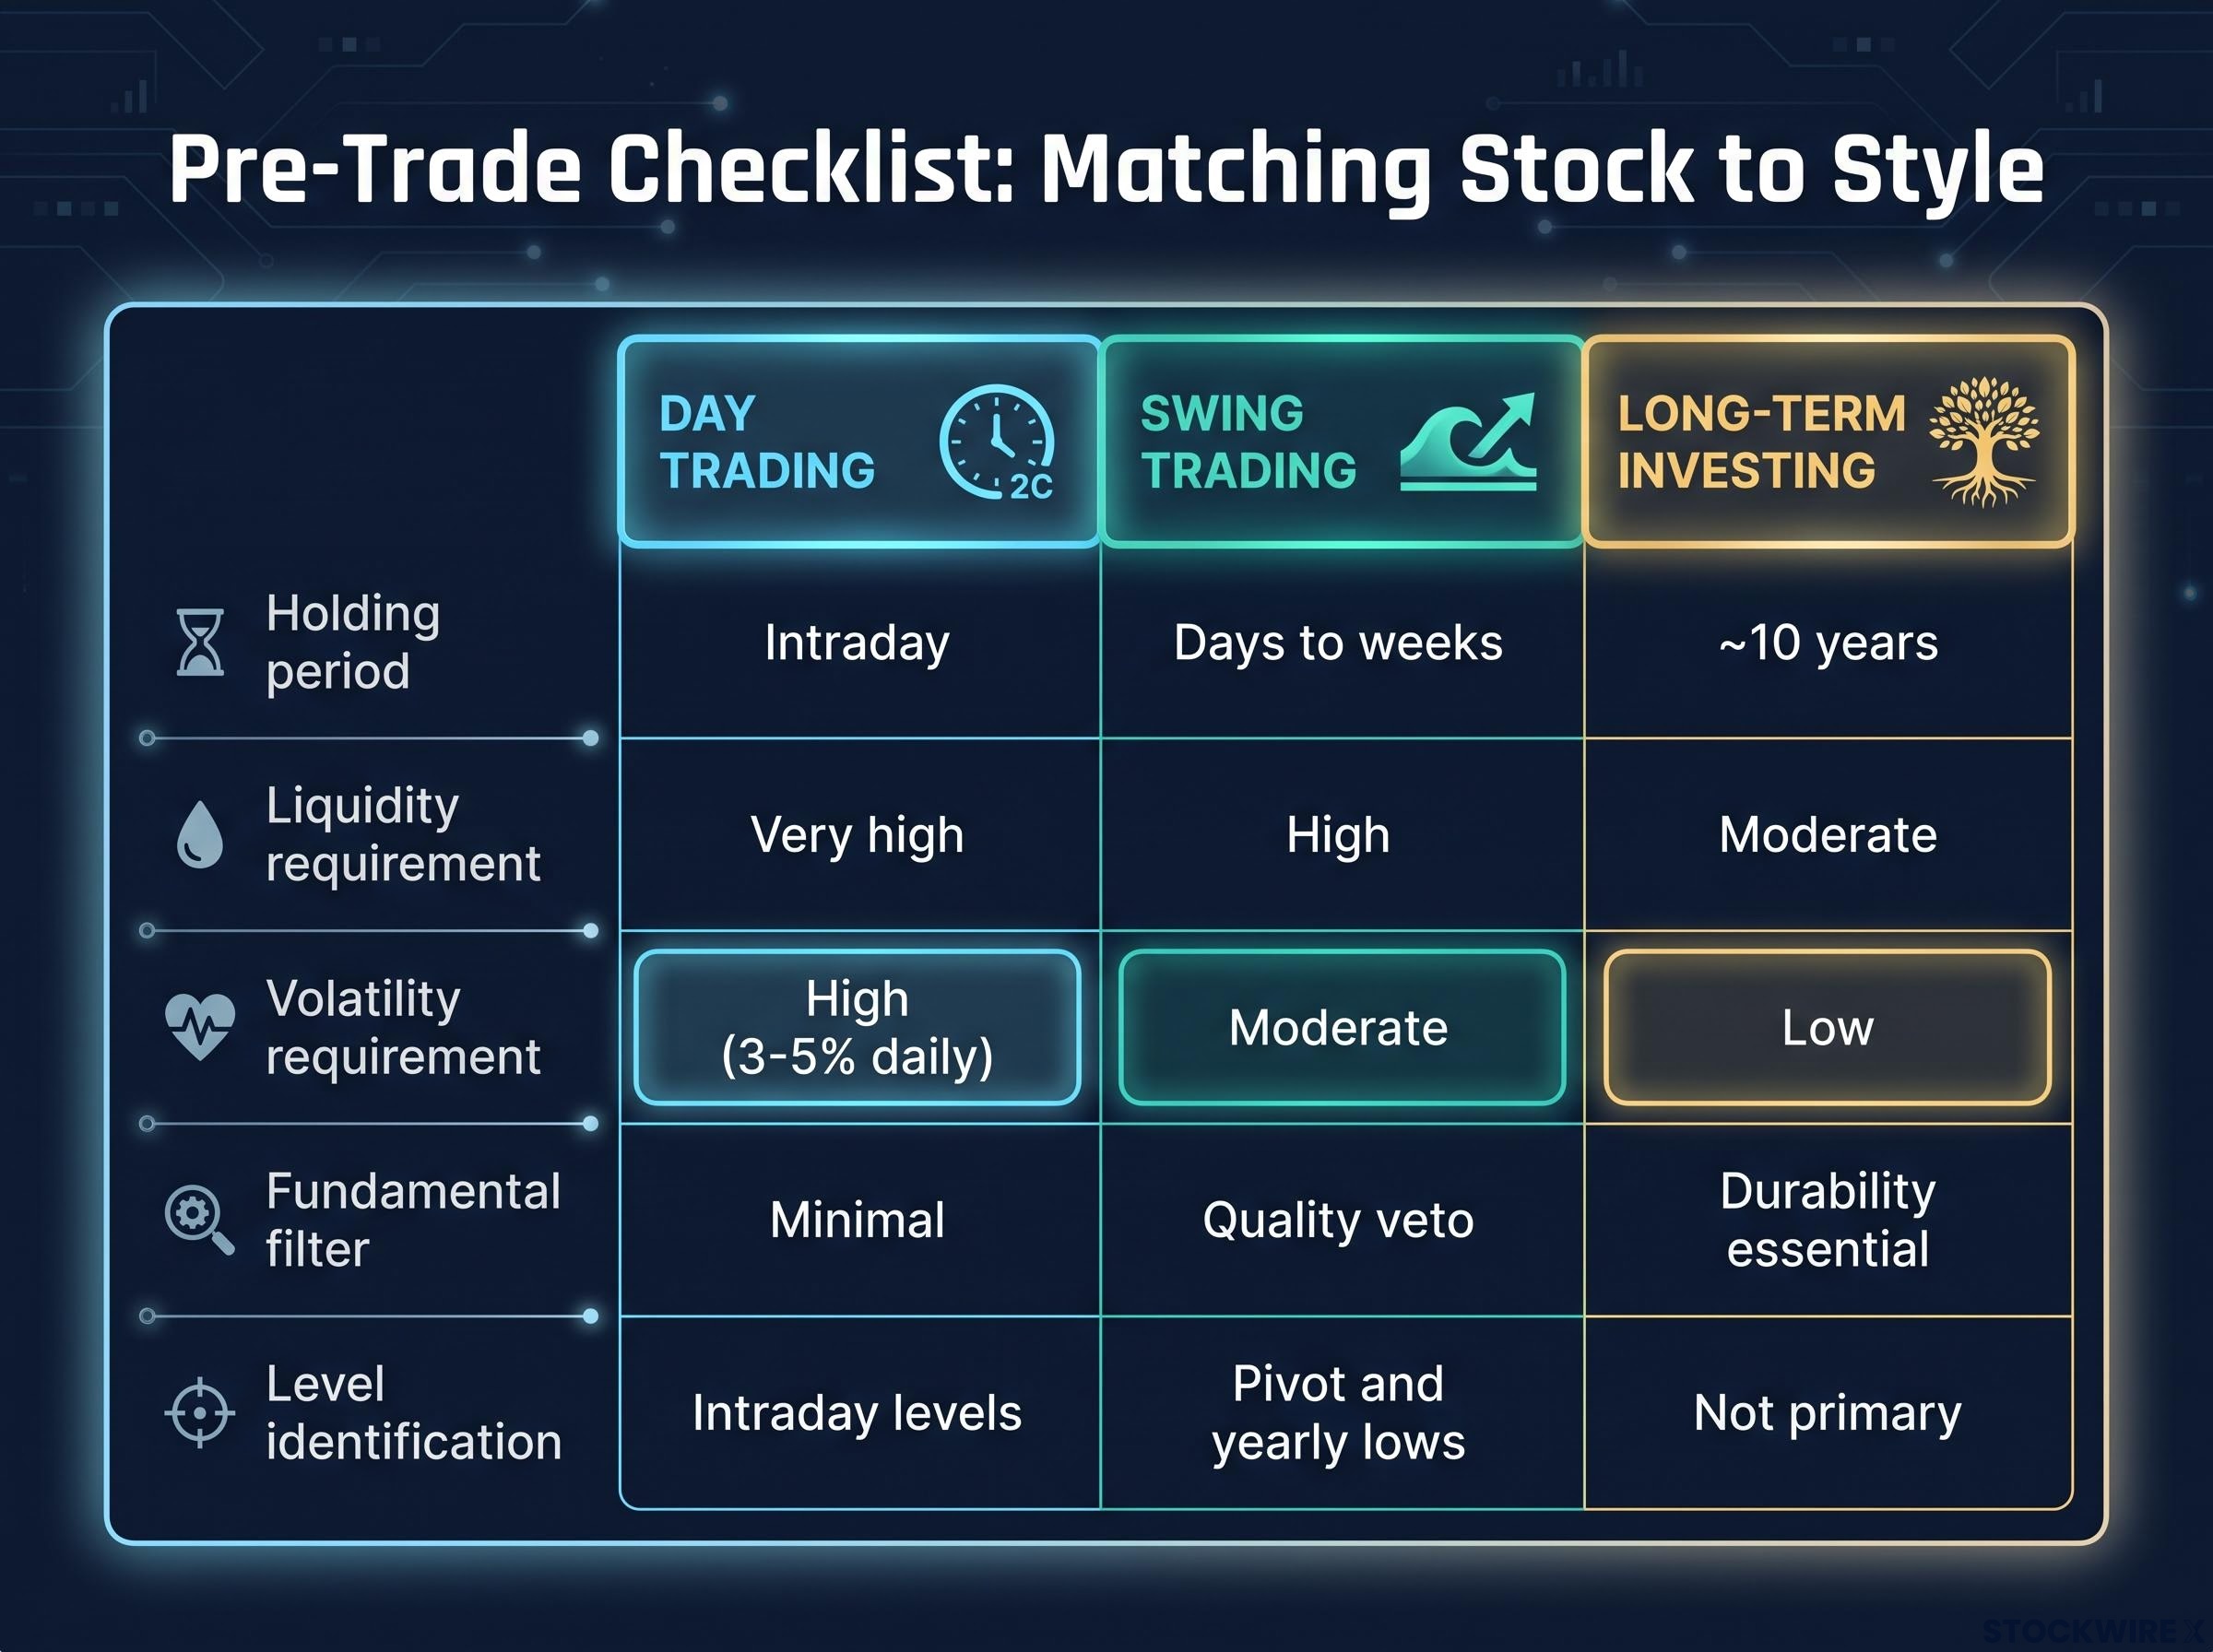
| Criterion | Day trading | Swing trading | Long-term investing |
|---|---|---|---|
| Holding period | Intraday | Days to weeks | ~10 years |
| Liquidity requirement | Very high | High | Moderate |
| Volatility requirement | High (3-5% daily) | Moderate | Low |
| Fundamental filter | Minimal | Quality veto | Durability essential |
| Level identification | Intraday levels | Pivot and yearly lows | Not primary |
Notice the volatility row. What day trading demands, long-term investing forbids. That is the mismatch made visible.
So what happens when you genuinely like a stock across multiple timeframes? You separate it into different positions. The long-term investment thesis and the short-term trade are not the same trade in different clothes. They require different checklists, different position sizes, and different risk controls, even on the identical ticker.
That is the blended approach practitioners use. Technicals decide when to trade, fundamentals decide what to trade, but your sizing, leverage, and risk rules shift sharply by style regardless of the stock.
Your decision gate has three steps, in this order.
- Fix the holding period. Decide which trade you are actually considering before anything else.
- Apply the matching checklist. Pull up the criteria for that style and only that style.
- Evaluate whether the stock clears. Now, and only now, judge the specific name against those criteria.
One caution worth keeping front of mind. FINRA states plainly that day trading is generally inappropriate for those with limited resources, limited experience, or low risk tolerance, and should never be funded from retirement savings or essential living expenses. Match the strategy to your capacity, not just to the chart.
FINRA’s day trading suitability standards establish that the strategy is generally inappropriate for those with limited resources, limited investment experience, or low risk tolerance, a regulatory baseline that applies regardless of how compelling a short-term setup appears on the chart.
The checklist is only as useful as the discipline behind it
The point of a style-matched checklist is not that it helps you pick better stocks. It is that it removes the structural mismatches that cost you money before the position is even open. That is where the edge actually lives, at the selection stage, not the exit.
Win rate alone does not tell you whether a strategy has a genuine mathematical edge; a trader winning 40% of trades can structurally outperform one winning 70% of the time when average wins dwarf average losses, which is precisely why the style-matched checklist matters more than any individual trade outcome.
Plenty of traders run several styles at once, and there is nothing wrong with that. What breaks discipline is reclassifying a position after the fact, letting a day trade quietly become a long-term hold because it moved against you. That is the disposition effect at work, and it is exactly what the checklist exists to prevent.
Keep the gate in the right order. Holding period first, criteria second, stock selection third.
The NASAA 2025 finding that most day traders lose their money is not there to scare you off. It is the reason this pre-trade discipline matters in the first place.
So the next time you spot a stock worth trading, the first question is not “is this a good stock.” It is “which version of this trade am I considering, and does this stock qualify under that style’s criteria.”
This article is for informational purposes only and should not be considered financial advice. Investors should conduct their own research and consult with financial professionals before making investment decisions. Past performance does not guarantee future results.