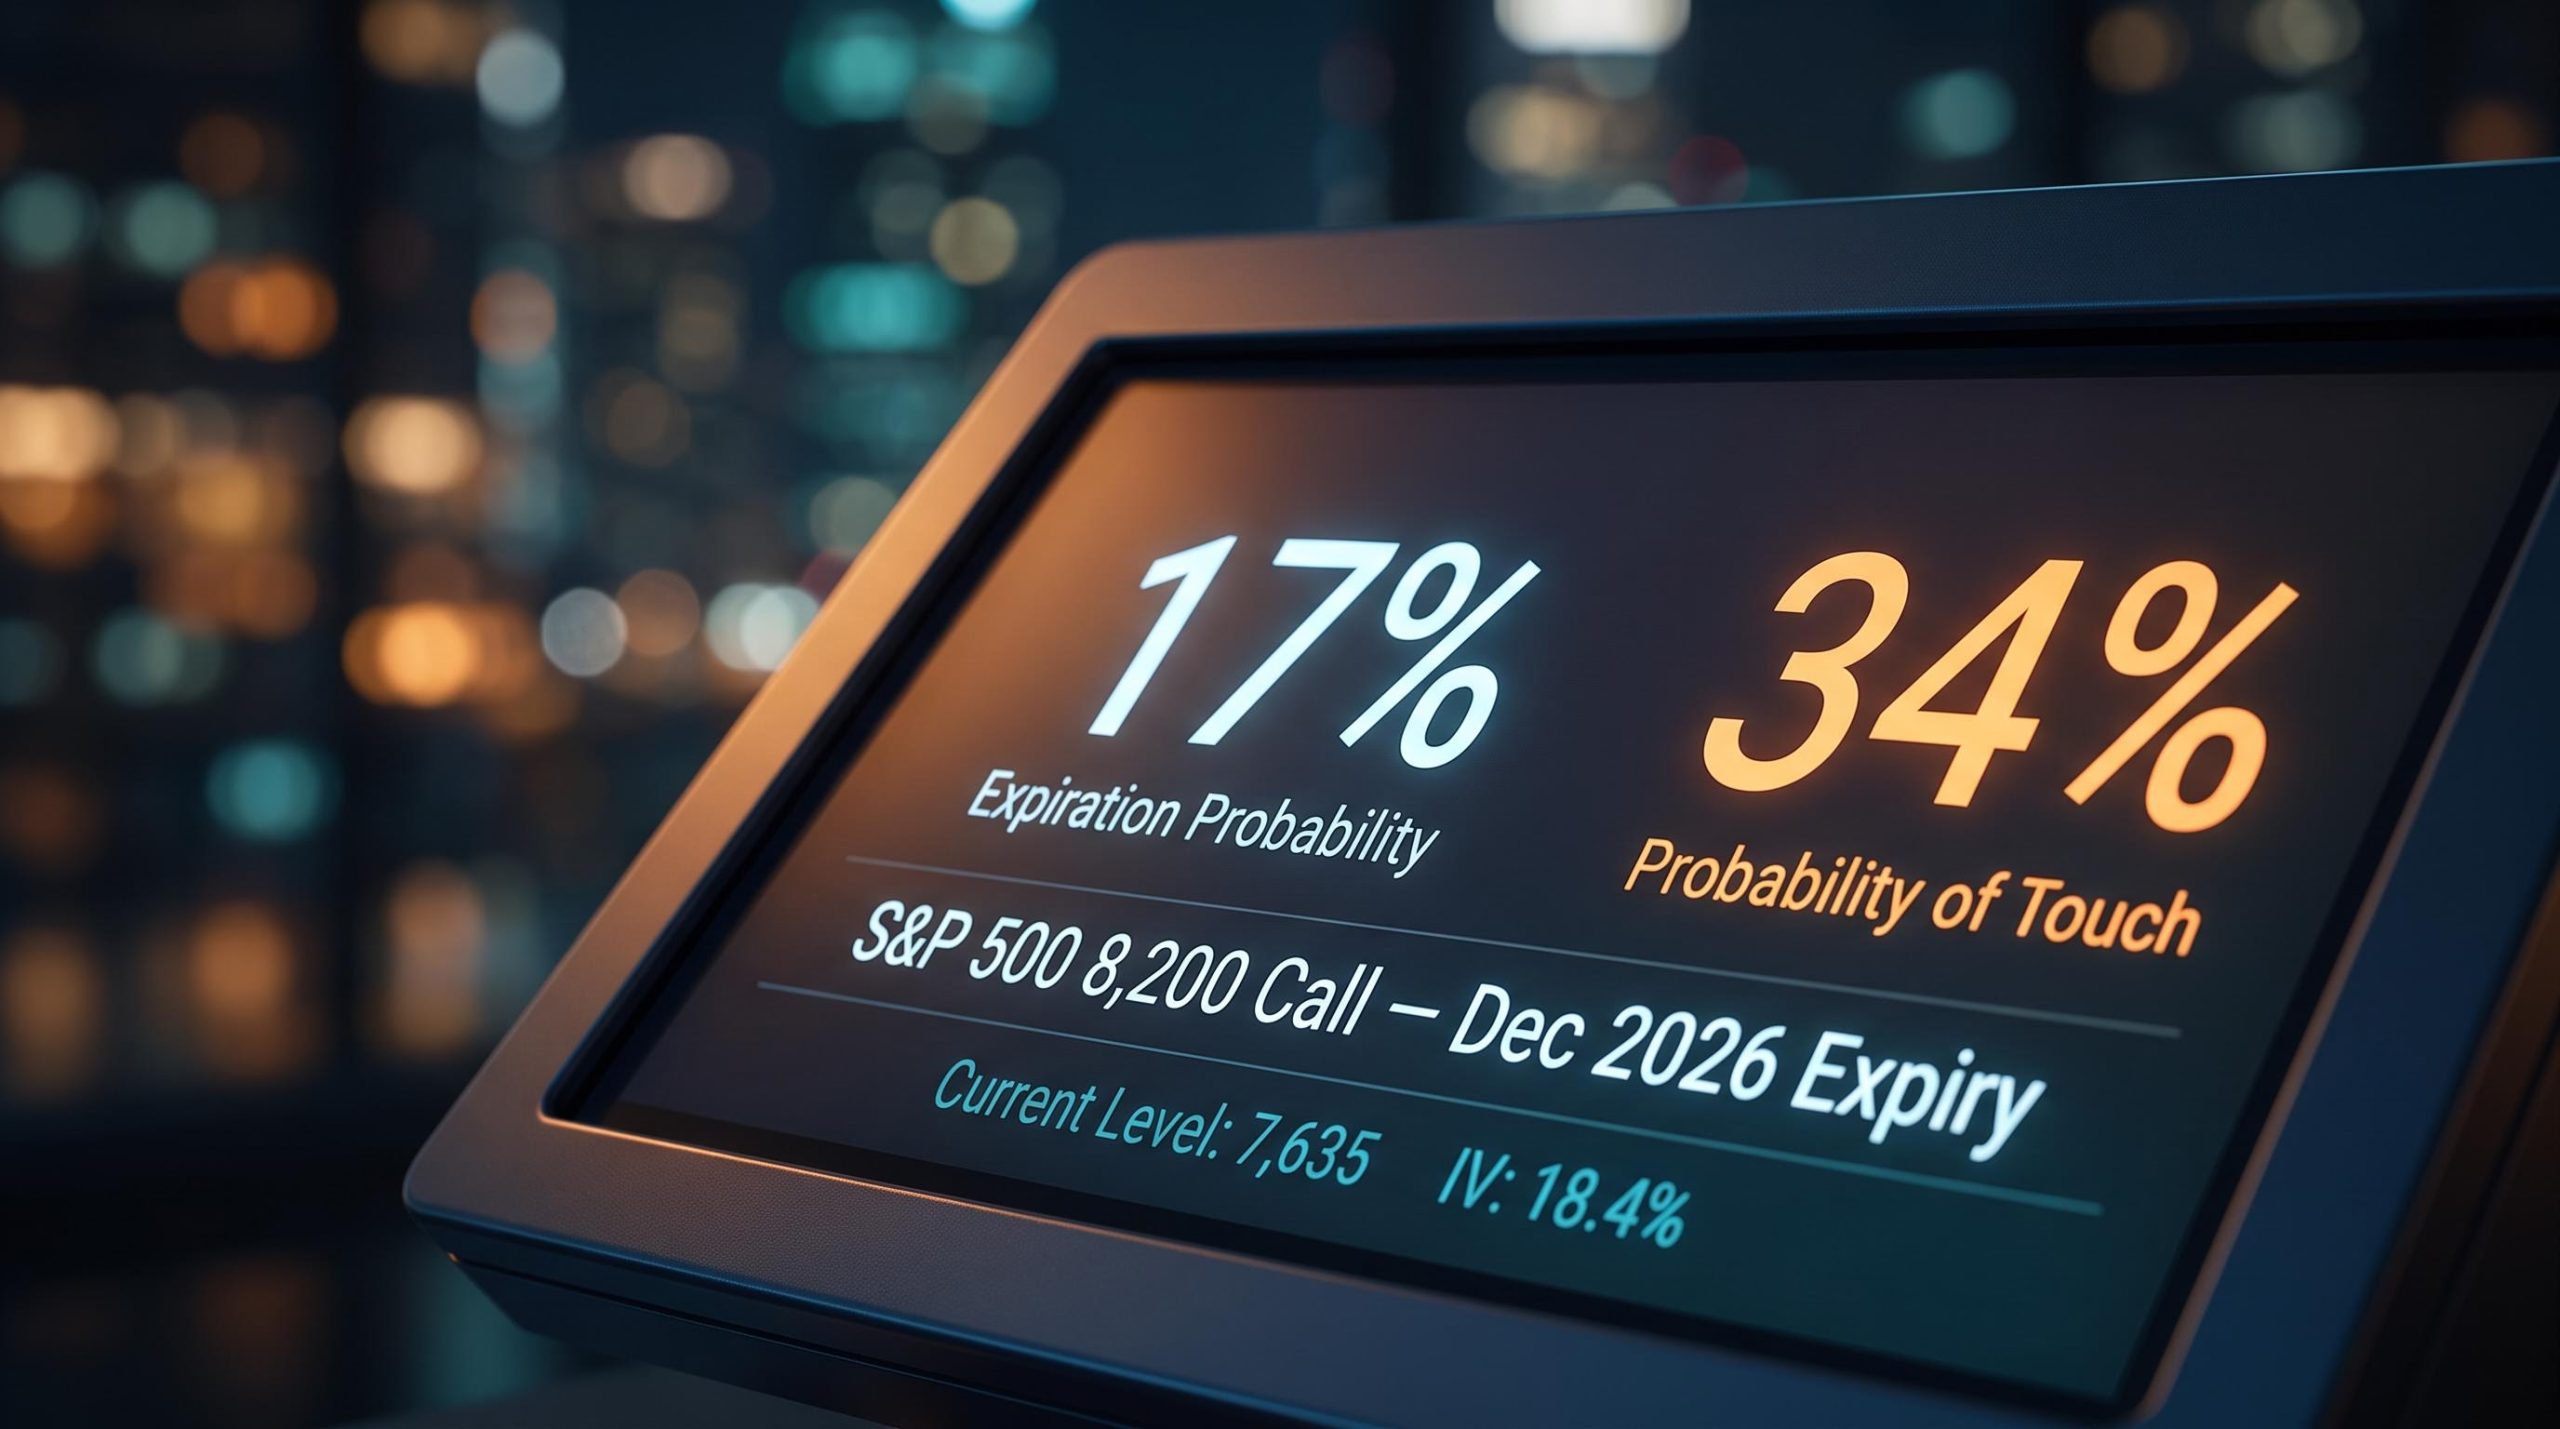
A professional Wall Street analyst tells you the S&P 500 will hit 8,200 by the end of the year. The options market tells you there is roughly a 17% chance of that happening. Both of those statements are true at the same time, and understanding why is how professional traders actually read a forecast.
Here is the useful part: options markets quietly generate a real-time probability estimate for any price target you can name. Those numbers are not opinion. They are derived from what real market participants are paying, right now, to position for or against that exact outcome. With the S&P 500 sitting near 7,635 and Fundstrat’s Tom Lee calling for 8,200, you have a concrete, live spread of 565 points to work with.
After reading this, you will be able to look at any strike price, find the two probability figures that options platforms display, and know precisely what each one is telling you and, just as importantly, what it is not.
What the S&P 500’s current options market tells you about the 8,200 target
Start with the raw picture, because it puts you inside a real decision rather than a textbook example.
- Current level: S&P 500 closed at 7,635.76 on 17 September 2026, up 1.11% on the day
- The target: Tom Lee’s 8,200 year-end call, a 565-point advance from here
- Time on the clock: the 31 December 2026 expiration, with 105 days remaining at the time of analysis
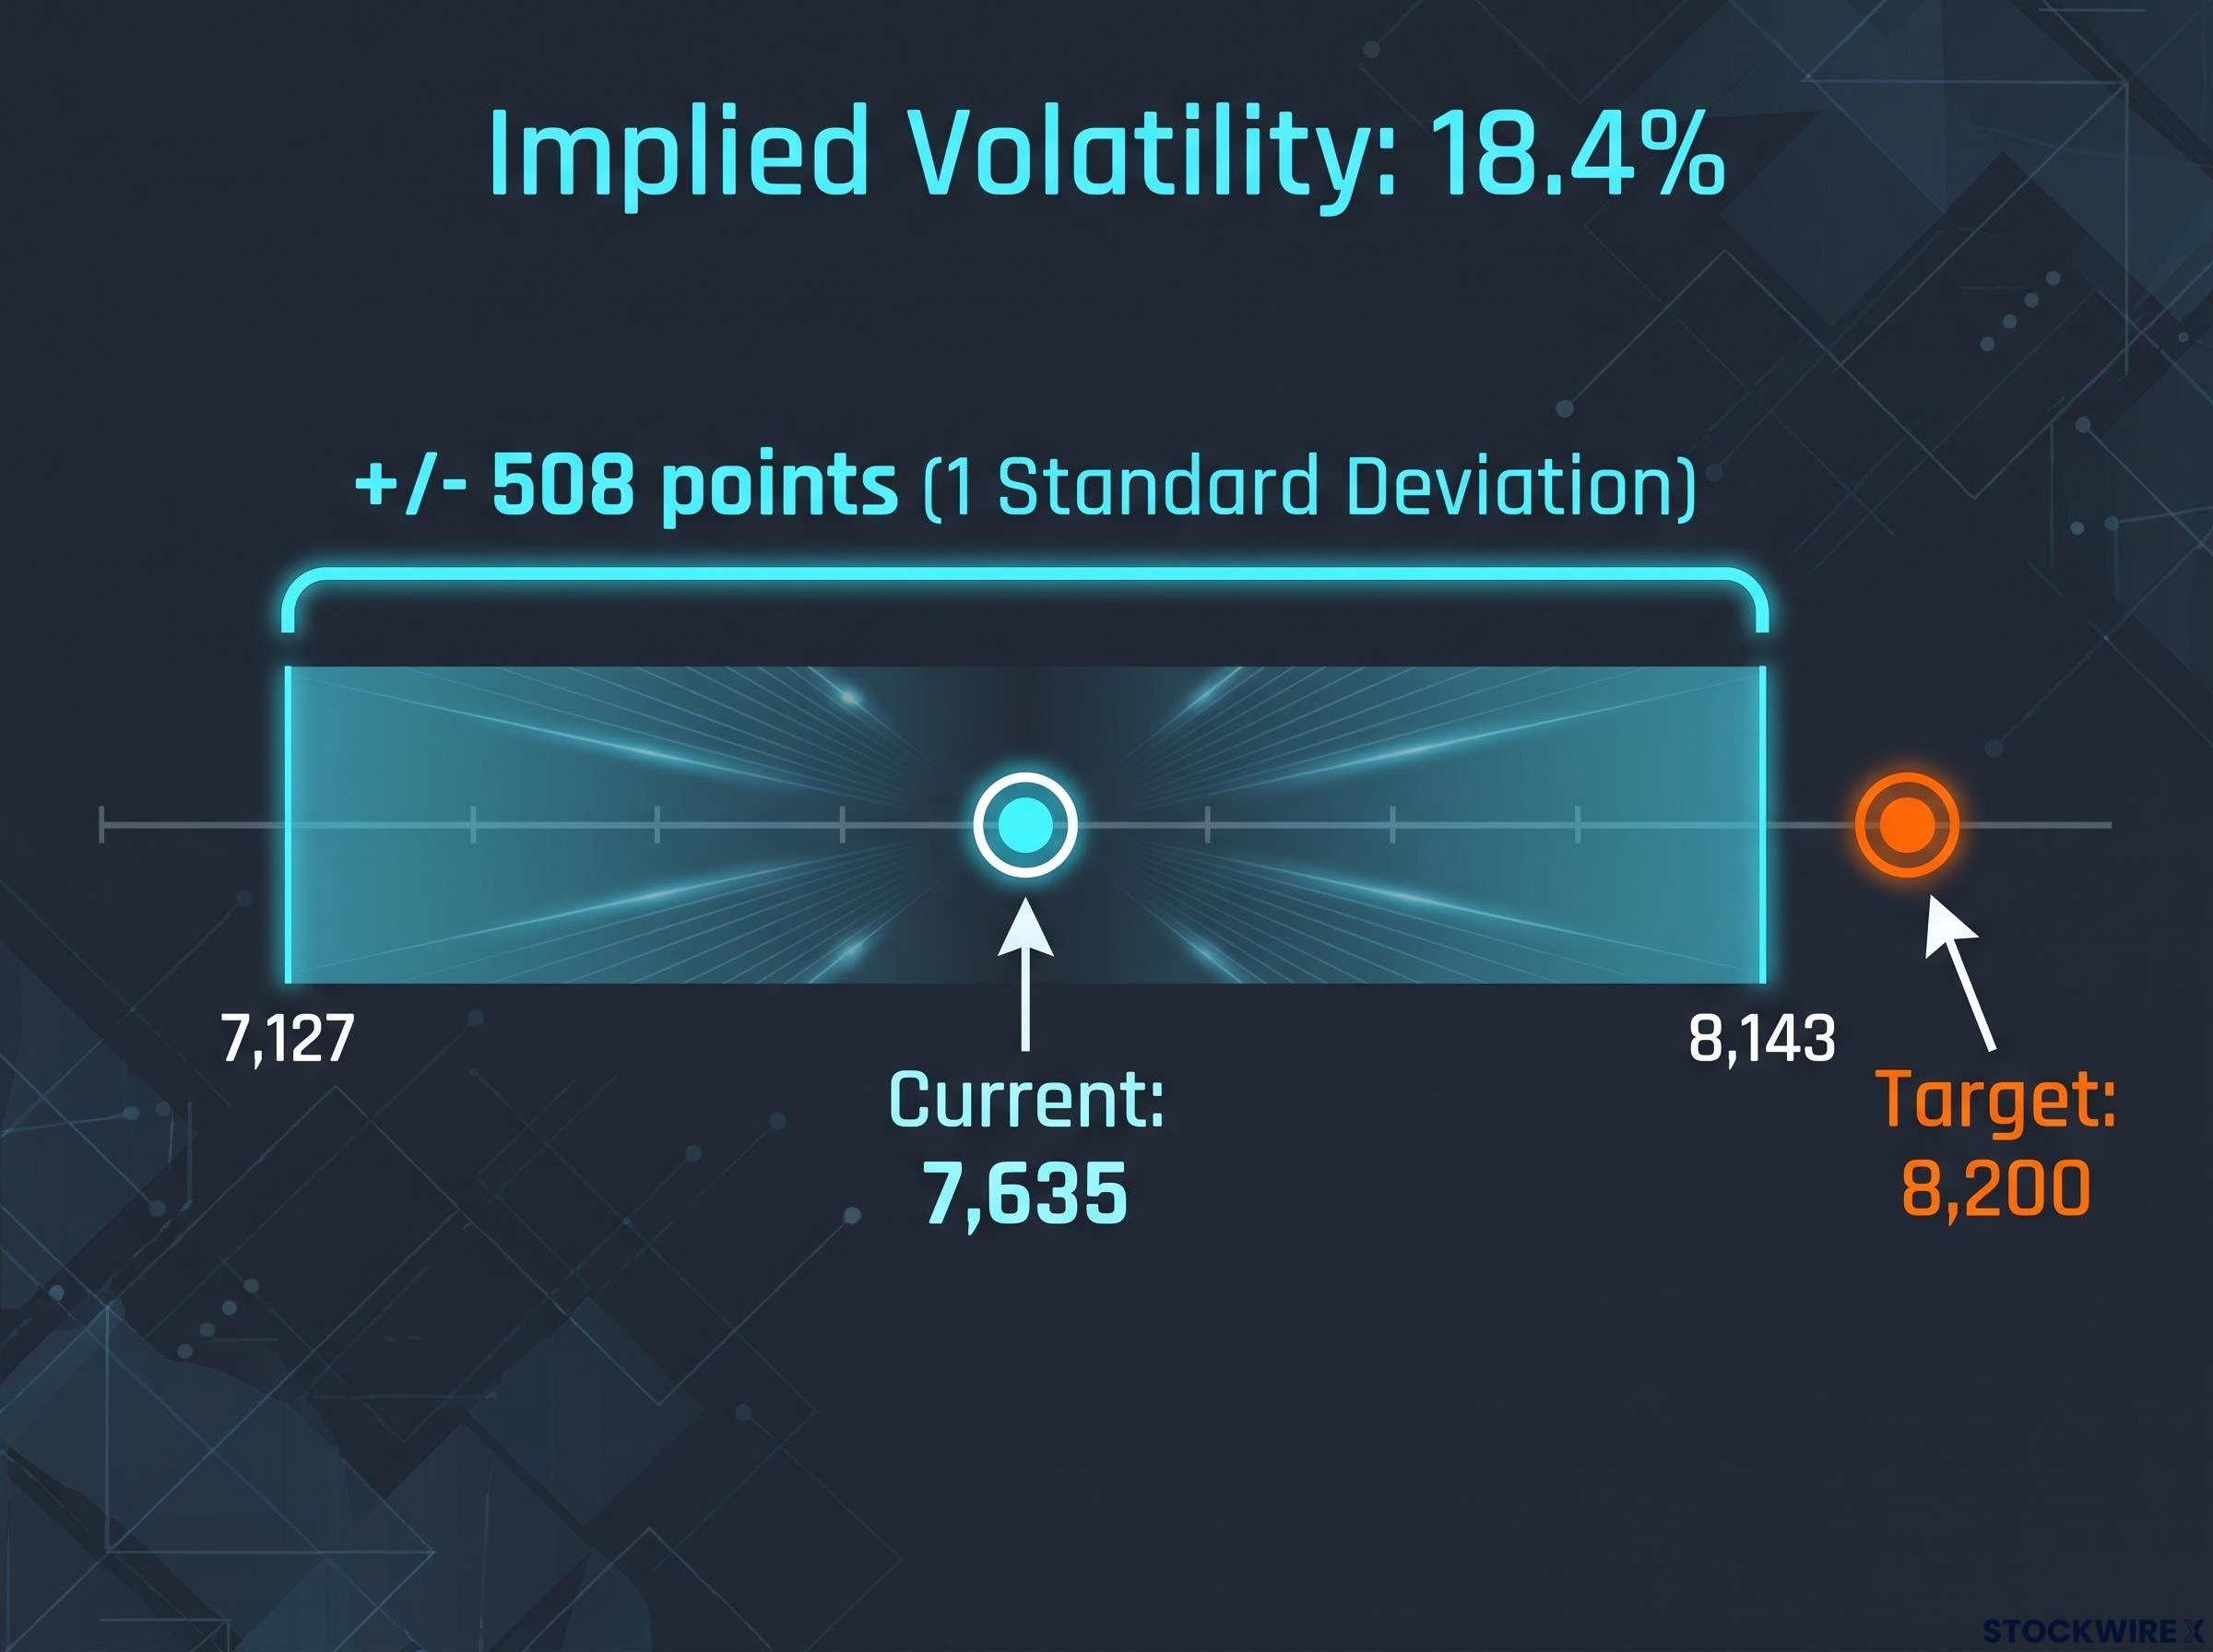
Now the numbers that matter. For that December cycle, implied volatility sat at 18.4%, and the market’s one-standard-deviation expected move worked out to roughly plus or minus 508 points from current levels. That is the statistical fence the options market has built around the index. The 8,200 strike sits just outside the upper edge of it.
Two probability figures fall out of this, and they are the heart of everything that follows.
The options market prices the S&P 500 finishing at or above 8,200 on 31 December at roughly 17%. It prices the index touching 8,200 at any point during the 105-day window at roughly 34%.
So what does the 17% actually mean for you? It means the collective, capital-backed signal of the options market assigns Tom Lee’s headline number about the same odds as a coin landing on the wrong side twice in a row. That is worth holding onto before you treat any analyst price target as a base case rather than an ambitious one.
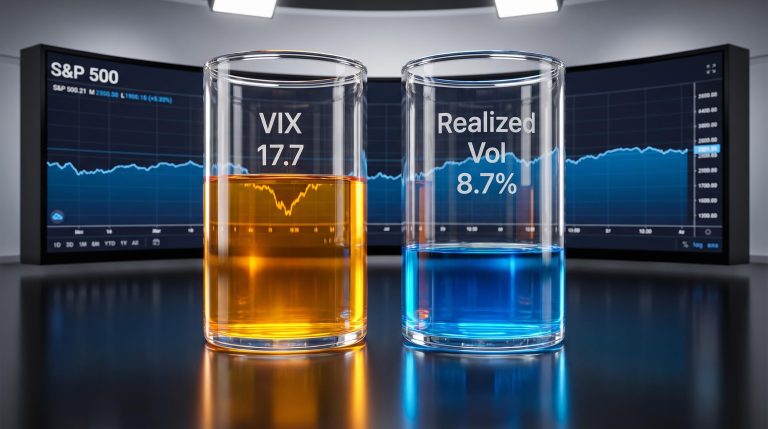
The backdrop was calm, too. The Cboe Volatility Index (VIX), which tracks near-term expected volatility in the S&P 500, was 15.44 on 17 September, down sharply from 17.71 the prior session. A low VIX means the market was not braced for turbulence, which shapes every probability figure below.
The Cboe VIX methodology defines the index as a forward-looking measure of 30-day expected volatility derived directly from S&P 500 option prices, which is why a reading of 15.44 on 17 September reflects genuine market pricing rather than a sentiment survey.
When big ASX news breaks, our subscribers know first
How implied volatility converts into a probability estimate
The 18.4% number on your screen is not a mood rating. Implied volatility is the market’s consensus estimate of how much the index is expected to move over a given period, expressed as an annualised percentage, and it is backed out of what buyers and sellers are actually paying for options contracts.
The 18.4% figure is itself derived from live options prices through a reverse-engineering process; implied volatility basics cover exactly how that extraction works and why the resulting number drives every Greek and probability estimate your platform displays.
The translation into a price range is more intuitive than it looks. You take the annualised volatility, scale it down for the number of days remaining, and the result is the expected move.
- Read the implied volatility. For December, that is 18.4% annualised.
- Scale it to the time period. Multiply the annual figure by the square root of days-remaining divided by 365. Over 105 days, that shrinks 18.4% into a much smaller period estimate.
- Locate your strike inside the range. For this index, the maths produces a one-standard-deviation band of about plus or minus 508 points, so roughly 7,127 to 8,143 on the downside and upside.
Notice where 8,200 lands: just above that upper band. That is why it is a plausible reach rather than a central expectation.
This connects directly to a number your platform already shows you: delta. The 8,200 call sits near the 20-delta level, which means market makers assign it roughly a 20% chance of expiring in-the-money. That is essentially what the 17% expiration probability is expressing. The formal engine underneath is the Black-Scholes N(d2) term, but you do not need to compute it to read the signal. Your platform already has.
Here is how the range shifts as volatility changes, holding the same 105-day window.
| Implied Volatility | Expected Move (points) | Approx. 8,200 Strike Probability |
|---|---|---|
| 18.4% | ~508 | ~17% |
The takeaway for you is direct: implied volatility is not a vague risk score, it is a market-priced estimate of the index’s likely range. When you see a strike sitting near the 20-delta level, you are reading the options market’s own stated confidence interval. Master this once and you can run the same read on any strike, any underlying, any expiration.
Why “probability of touch” is twice the expiration probability and why that gap matters
Picture yourself mid-trade, staring at two numbers that look like they contradict each other. Your platform tells you the 8,200 strike has a 17% chance of finishing in-the-money, then in the next column tells you it has a 34% chance of being reached. Both are correct, and the gap between them is one of the most useful things you can learn about options.
They measure different things. Expiration probability captures only the final state on 31 December: where does the index actually close? Probability of touch captures the entire path over 105 days: does the index reach 8,200 even once along the way, regardless of where it ends up?
The rule of thumb ties them together neatly.
For an asset without strong directional drift, the probability of touch is roughly twice the probability of expiring in-the-money.
That is exactly why 17% expiration produces 34% touch. The formal version is that probability of touch is approximately 2 x N(d2), where N(d2) is the expiration probability. The same pattern shows up across real examples.
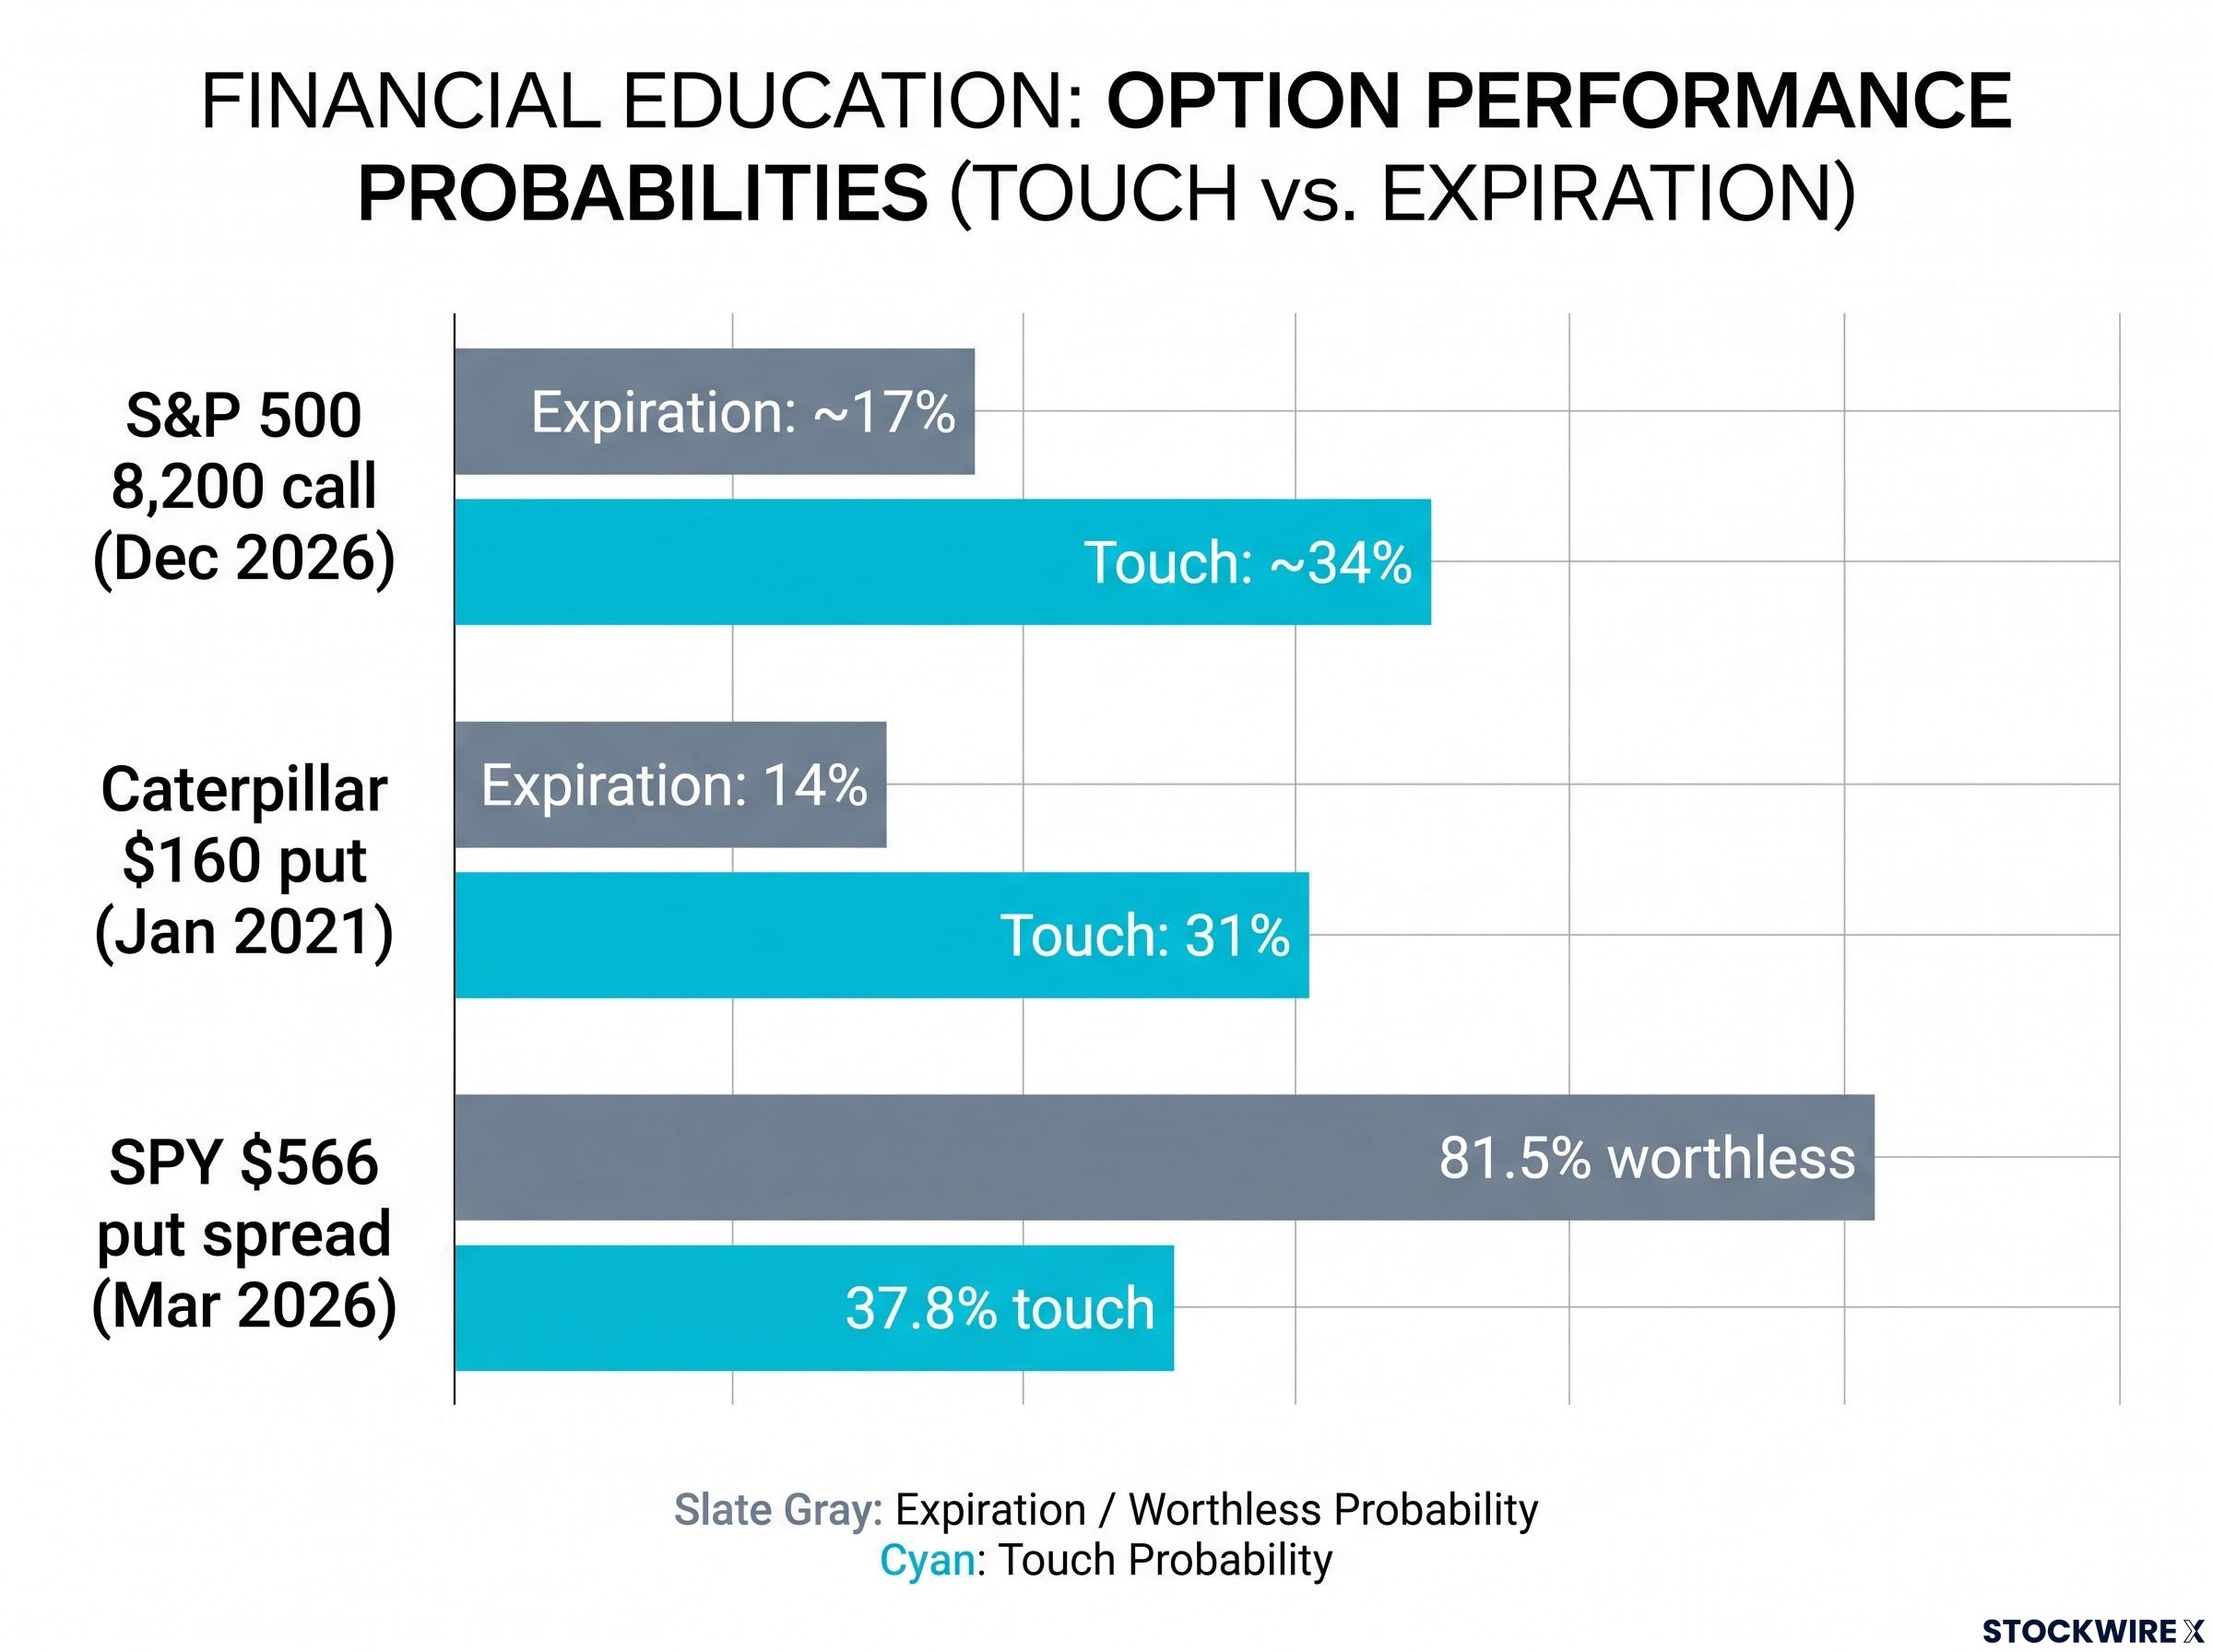
| Example | Expiration Probability | Touch Probability |
|---|---|---|
| S&P 500 8,200 call (Dec 2026) | ~17% | ~34% |
| Caterpillar $160 put (Jan 2021) | 14% | 31% |
| SPY $566 put spread (Mar 2026) | 81.5% worthless | 37.8% touch |
The SPY row is the one to sit with. A position with an 81.5% chance of expiring worthless still carries a 37.8% chance of being touched. If you read only the comforting expiration number, you would badly underestimate how often that strike gets tested. This is the single most common calibration error retail traders make.
For you, the practical meaning is this: a 17% chance of 8,200 at expiration understates how likely the market is to test that level during the trade. Any strategy with a trigger before expiration needs the 34% figure, not the 17% one.
When touch probability governs: stop-losses, rolls, and assignment risk
Three mid-trade events depend entirely on the path, not the finish.
- Stop-loss orders. A stop placed at 8,200 fires the moment the index touches it, whether the index later closes at 8,300 or falls back to 7,900. Your relevant probability is the 34% touch figure.
- Rolling decisions. If you are short a call at 8,200 and thinking about rolling it, you must price in a 34% chance of being tested, not a 17% chance of being finished against.
- Early assignment. American-style options can be assigned any time they are in-the-money, not only at expiration. Touch probability, not expiration probability, is what governs that risk.
Why index puts cost more than calls and what that reveals about market structure
You might reasonably assume that a call and a put sitting the same distance from the current price should cost about the same. For index options, that assumption is usually wrong, and understanding why gives you a sharper mental model of how big institutions shape prices.
Index put options are systematically more expensive than equidistant calls. The reason is a persistent “volatility skew”: downside strikes carry higher implied volatility than upside strikes at the same distance. Four structural forces drive it.
- Portfolio insurance demand: large institutions holding long stock buy puts to hedge, and that constant, price-insensitive buying pushes put implied volatility up regardless of near-term outlook.
- Asymmetric crashes: markets historically fall faster and more violently than they rise, so realised volatility runs higher on the downside, justifying richer put pricing.
- The leverage effect: as prices fall, volatility tends to rise, which fattens the left tail of the return distribution.
- Risk premium for sellers: market makers writing downside puts demand extra compensation to carry crash exposure, while upside call buyers are more price-sensitive.
Right now, though, something unusual is happening. As of 5 September 2026, the 25-delta skew briefly flipped positive at +0.035, meaning 25-delta calls were trading richer than equivalent puts. That inversion is rare, and it reflects a sustained rally that has compressed downside fear.
| Time Period | OTM Put IV Premium vs. ATM | Market Context |
|---|---|---|
| 2024 average | +1.67 points (5-yr avg +3.81) | Normal downside skew |
| June 2025 spike | +1 to 2 points, 99th percentile | Steep downside fear |
| September 2026 | 25-delta calls richer than puts | Rare upside skew |
You could see this asymmetry in live pricing during the 17 September rally. The 8,200 call gained roughly $1,100 in value, while a 7,100 put lost roughly $2,000, a far larger dollar swing, as put skew compressed on the way up.
For you, weighing that 8,200 call’s price tag, the practical read is that upside calls are structurally cheaper relative to the risk they carry than downside puts. Any strategy that leans on calls to capture a rally quietly benefits from that pricing asymmetry.
What option-implied probabilities can and cannot tell you about analyst forecasts
Now the honest reckoning, because a tool is only useful if you know where it breaks.
Option-implied probabilities are a genuinely valuable signal. They come from real capital at risk, they absorb macro tail risk that historical-returns models miss, and research from 2024 found that option-implied distributions improve forecast quality with information ratios above 0.60. That is a meaningful edge over guessing from past returns alone.
But there is a critical catch, and it changes how you should read every number in this article.
Options prices output risk-neutral probabilities. They embed the cost of hedging and the volatility risk premium. They tell you what the market charges for a risk, not purely what it expects.
The 17% on 8,200 is therefore part prediction and part insurance premium. Two further distortions compound this. Implied volatility historically overstates realised volatility by about 3 to 4 percentage points, which biases inferred crash and tail probabilities upward. And liquidity thins out at extreme strikes, exactly where a target like 8,200 lives, which can distort the implied distribution at the tails.
The implied vs realised volatility gap is the structural reason that 17% overstates the true probability of 8,200: implied volatility has historically run 3-4 points above realised volatility, fattening tail probabilities and embedding an insurance premium that the raw percentage does not separate from pure directional expectation.
There is also the timing trap known as IV crush: implied volatility often spikes ahead of a known event and collapses right after, which can punish a call buyer even when the index does move toward their target.
| What implied probabilities do well | Where they fall short |
|---|---|
| Built on real capital at risk | Risk-neutral, not pure prediction |
| Capture macro and tail risk | IV overstates realised vol by 3-4 points |
| Improve forecasts (info ratio >0.60) | Thin liquidity distorts extreme strikes |
Read the 17% correctly, then. It is not the options market predicting one-in-six odds as fact. It is the market charging a price that reflects roughly one-in-six odds once the cost of uncertainty is baked in. Treat it as a calibration reference, not an objective forecast. Worth noting too: the research flagged declining implied volatility, a volatility term structure in contango, and a seasonal holiday rally as conditions that could support a continued push toward 8,200.
Reading the options market alongside analyst targets, not instead of them
Put the pieces together and you have a repeatable method for any analyst forecast you meet from here on.
Check the expiration probability for the final-state view. Check the touch probability for the mid-journey view. Then hold both figures against the analyst’s stated reasoning to judge whether the target is structurally plausible or simply aspirational. For 8,200, that reads as 17% to finish there and 34% to get there at some point.
Two live conditions will move those odds. A sustained decline in implied volatility from the current 18.4% would widen the market’s priced probability of reaching 8,200, while any jump in the VIX from 15.44 back toward the mid-to-high 20s would compress it sharply.
The December put-versus-call premium spread and VIX futures term structure provide a broader cross-check on the single-strike read developed here; fall volatility signals from those positioning patterns converge on a similar picture of elevated year-end risk that the 8,200 call’s 17% expiration probability quietly encodes.
- Implied volatility trend: falling IV supports a higher priced probability of the target
- VIX level: currently 15.44, with a spike toward the mid-20s as the warning sign
- Seasonal calendar: the 105-day window to 31 December spans a historically supportive stretch, aided by a term structure in contango
With the 8,200 call priced near $4,500 as of 18 September 2026, the options market is neither endorsing nor rejecting Tom Lee’s call. It is offering a calibrated read that sits comfortably between “certain” and “impossible.” A 34% touch probability says a run at 8,200 is well within plausible market behaviour, even if it is not the base case. That nuance is exactly what options data is built to give you.
This article is for informational purposes only and should not be considered financial advice. Investors should conduct their own research and consult with financial professionals before making investment decisions. Past performance does not guarantee future results. Financial projections are subject to market conditions and various risk factors, and these statements are speculative and subject to change based on market developments.