Owning 500 stocks is supposed to mean owning 500 different risk exposures. That is the entire promise of an index fund, and for most of the last decade it has more or less held. It is not holding right now.
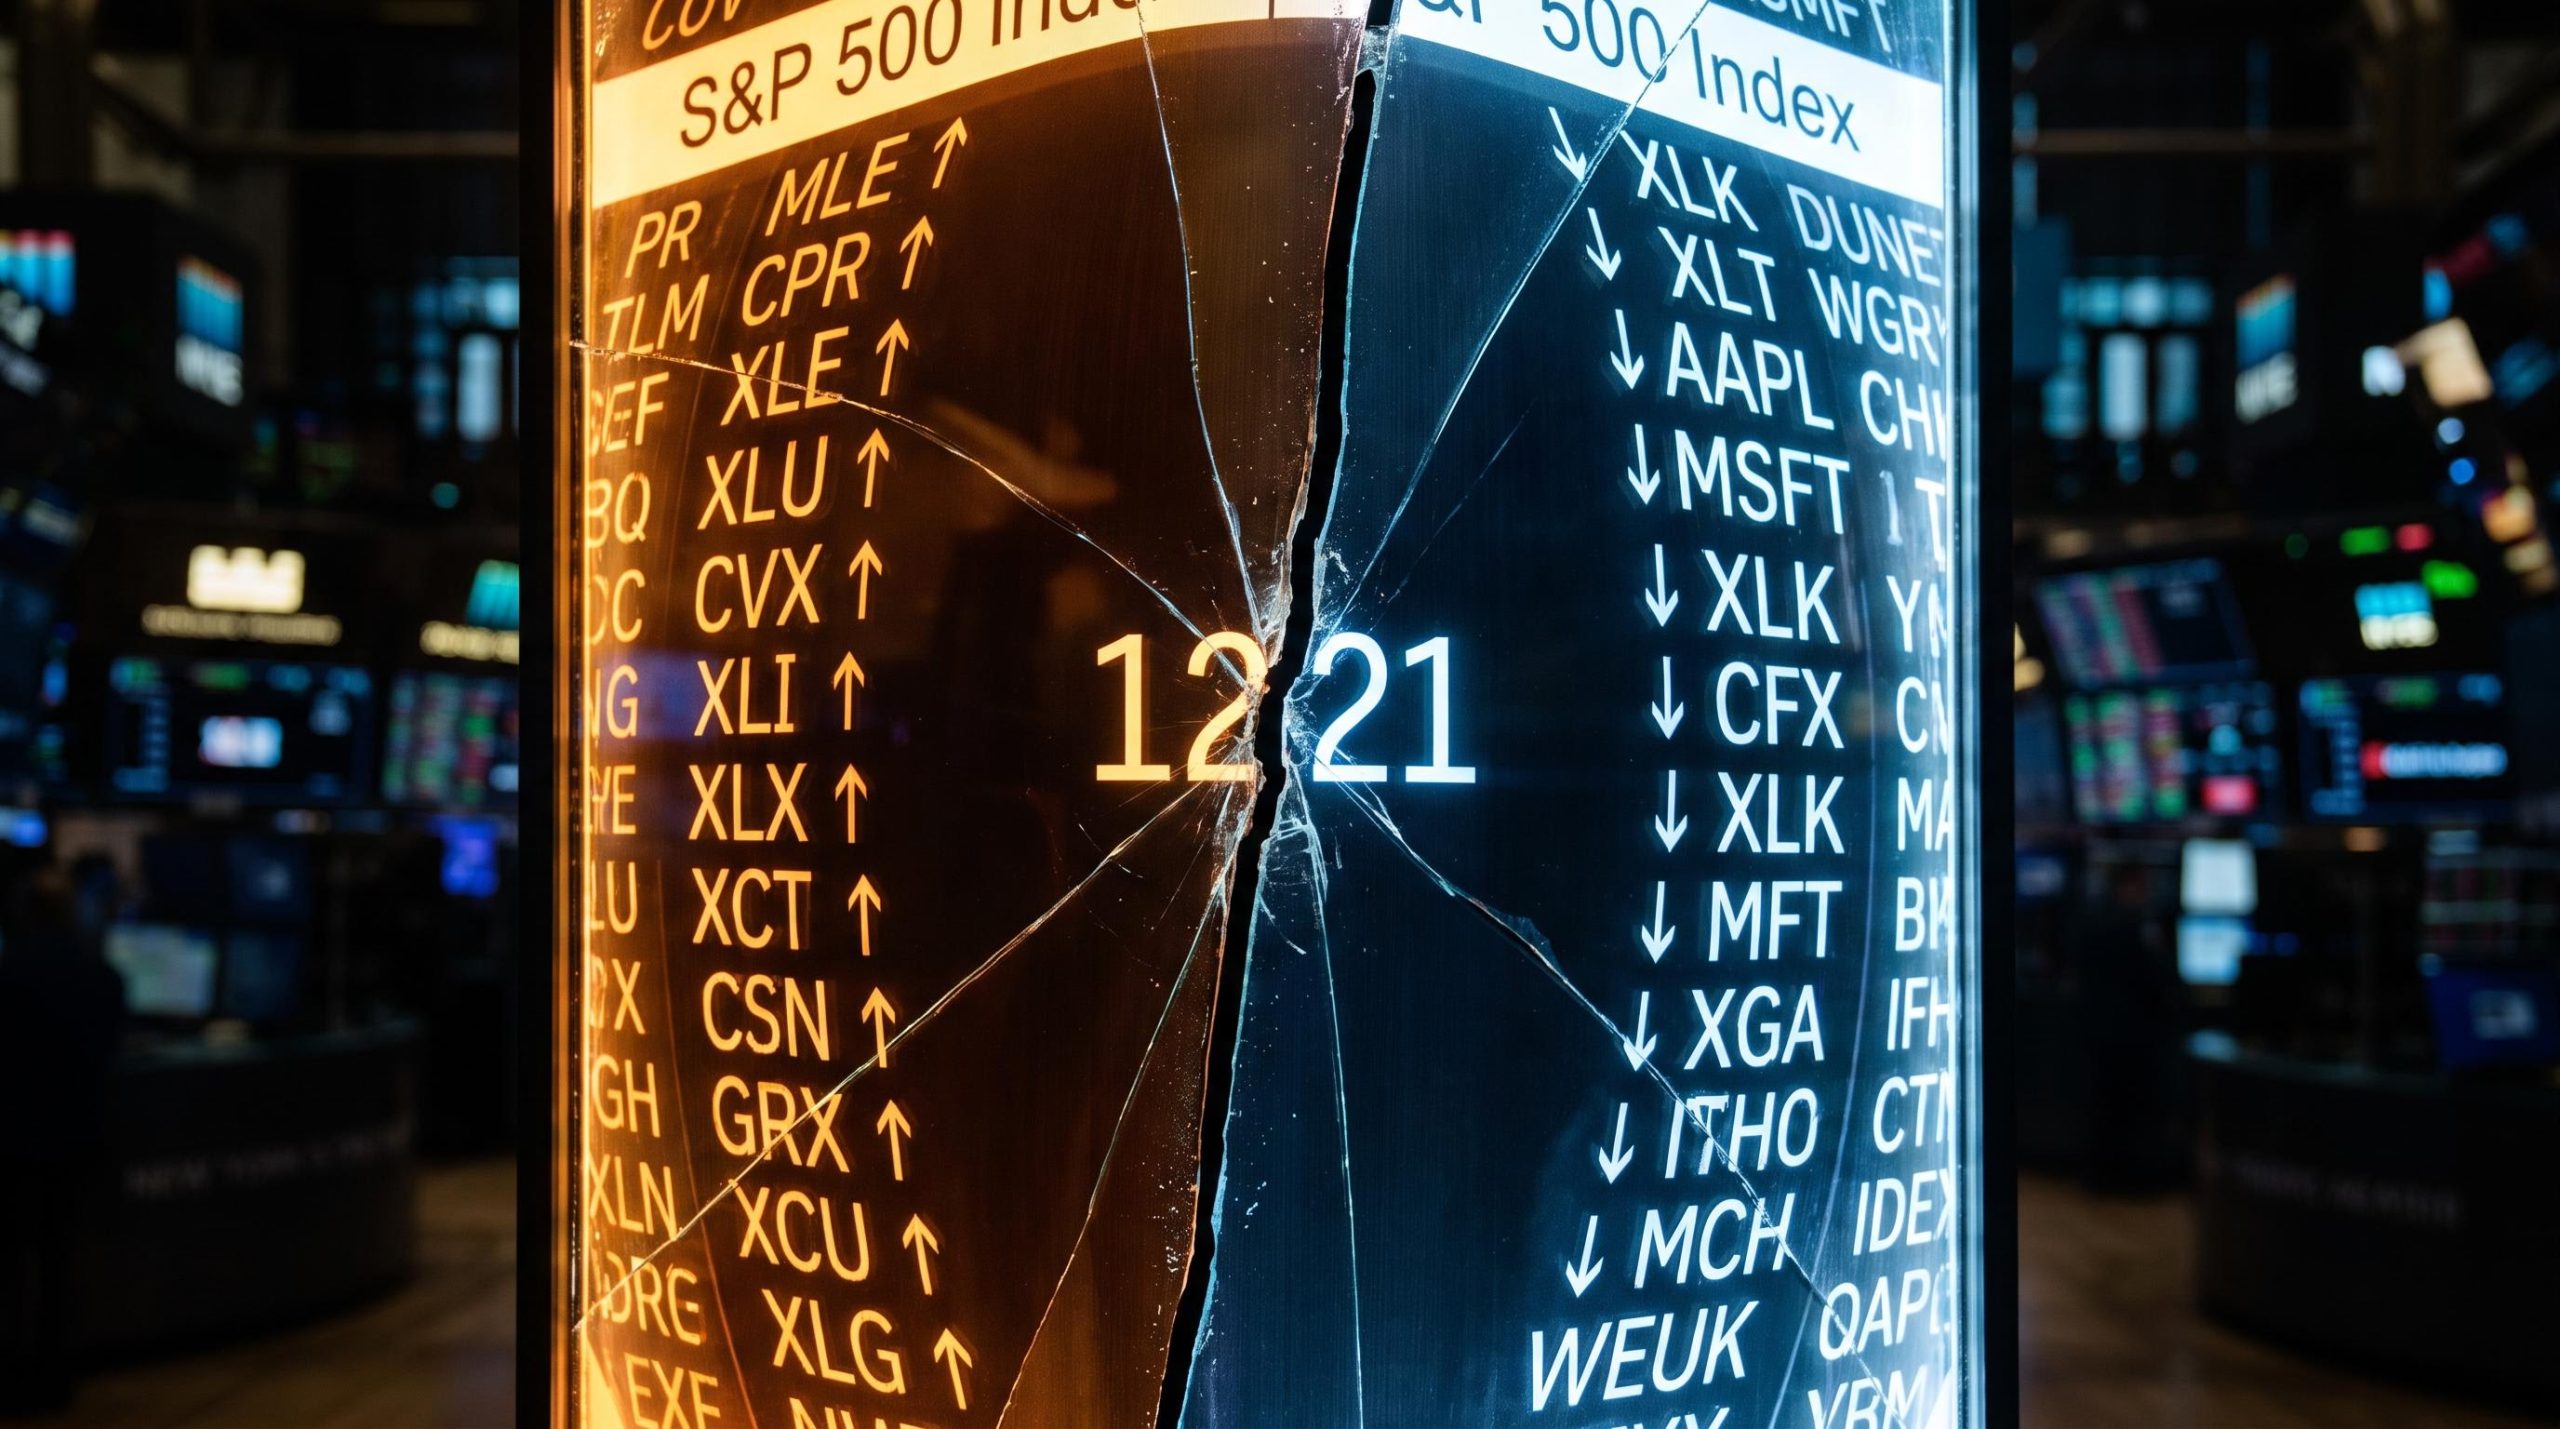
On 31 July 2026, Evercore ISI counted 121 S&P 500 stocks with negative beta to the index, meaning they were moving in the opposite direction to the market they are part of. That is the highest reading in the firm’s data going back to 1990, and it puts the current moment in the same rare company as the 2000-2001 dot-com peak.
This matters because a vast sum sits in funds that simply track the S&P 500, bought by people who were told the index gives them diversification. What is happening beneath the surface is a quiet polarisation between a technology-dominated core and a growing cluster of stocks pulling the other way. This piece gives you a clear framework for what negative beta means at the index level, why so many stocks are showing it right now, and what it actually says about the risk you are carrying in a standard S&P 500 fund. You will finish with a sharper picture of what you own, not just a new word.
What negative beta actually means when it shows up inside an index
You can spot it without any maths. A stock rises on a day the broader market falls, and keeps doing it, week after week. That behaviour has a name, and understanding it is the foundation for everything that follows.
Beta measures how a stock moves relative to the index it belongs to. It sorts into three zones:
- Positive beta above 1.0: the stock amplifies the index. When the market rises 1 percent, it tends to rise more, and it falls harder on down days.
- Beta near zero or between 0 and 1: the stock moves loosely with the index, dampened rather than amplified.
- Negative beta: the stock moves opposite to the index. When the market falls, this stock tends to rise, and vice versa.
There is nothing wrong with a negative-beta stock on its own. Investors buy them deliberately all the time as hedges, positions designed to gain when everything else drops. The problem is different when you did not choose them, and you own hundreds of them without realising, tucked inside a fund you bought for the opposite reason.
121 S&P 500 constituents showed negative beta on 31 July 2026, the highest reading since 1990.
By early September 2026 the count had eased to 115 stocks, still far above anything considered normal. Nationwide’s analysis found cross-sectional volatility, a measure of how differently individual stocks are behaving from one another, sitting more than five standard deviations above its long-term average. That is a level previously reached only after the dot-com bust, the financial crisis, and the COVID shock.
Index breadth deterioration is a measurable companion to the negative-beta count: only 50.9% of S&P 500 constituents were trading above their 200-day moving average in mid-May 2026, down sharply from above 70% in March, confirming that the surface-level index performance conceals a shrinking base of participating stocks.
When negative beta inside an index becomes a problem
A single hedge is a decision. A fifth of the index quietly running counter to the rest is a structural condition, and it is a different thing entirely.
The mechanics matter here. An index is supposed to work as an integrated portfolio of loosely correlated risks, which is what makes cap-weighted diversification hold together mathematically. When a large block of constituents systematically moves the other way, the index stops behaving like one portfolio and starts behaving like two camps pulling against each other.
The negative-beta names carry relatively small weight, because the index weights by company size and these are not the giants. But their behaviour still corrodes the correlation assumptions that passive investors rely on without ever being told they are relying on them. In plain terms: a meaningful chunk of your S&P 500 fund is now working against the rest of it, which is precisely the opposite of what diversification was meant to do for you.
When big ASX news breaks, our subscribers know first
Why energy stocks are moving against the market right now, and why oil is the trigger
The single biggest driver of this inverse behaviour is sitting at the petrol pump. Oil has stayed above $100 per barrel, and that one fact sets off a chain of consequences that ends in your technology holdings.
The oil supply shock driving crude above $100 per barrel has a specific structural cause: Saudi Arabia’s output collapsed to its lowest level since 1990, global inventories are drawing at more than double the previous record pace, and the IEA projects no rebalancing before late 2026.
Here is the mechanism, step by step:
- A supply shock lifts oil prices. Crude climbs and stays high, and energy producers gain because they sell into a higher price.
- Higher oil feeds the producer price index (PPI). Oil flows into diesel, freight, and input costs, pushing inflation readings up.
- Rising inflation raises Federal Reserve rate expectations. Higher PPI increases the odds of tighter policy, which lifts bond yields.
- Rising yields de-rate technology equities. Long-duration growth stocks, whose value depends on distant future cash flows, become worth less when yields rise. And technology is the index’s dominant weight.
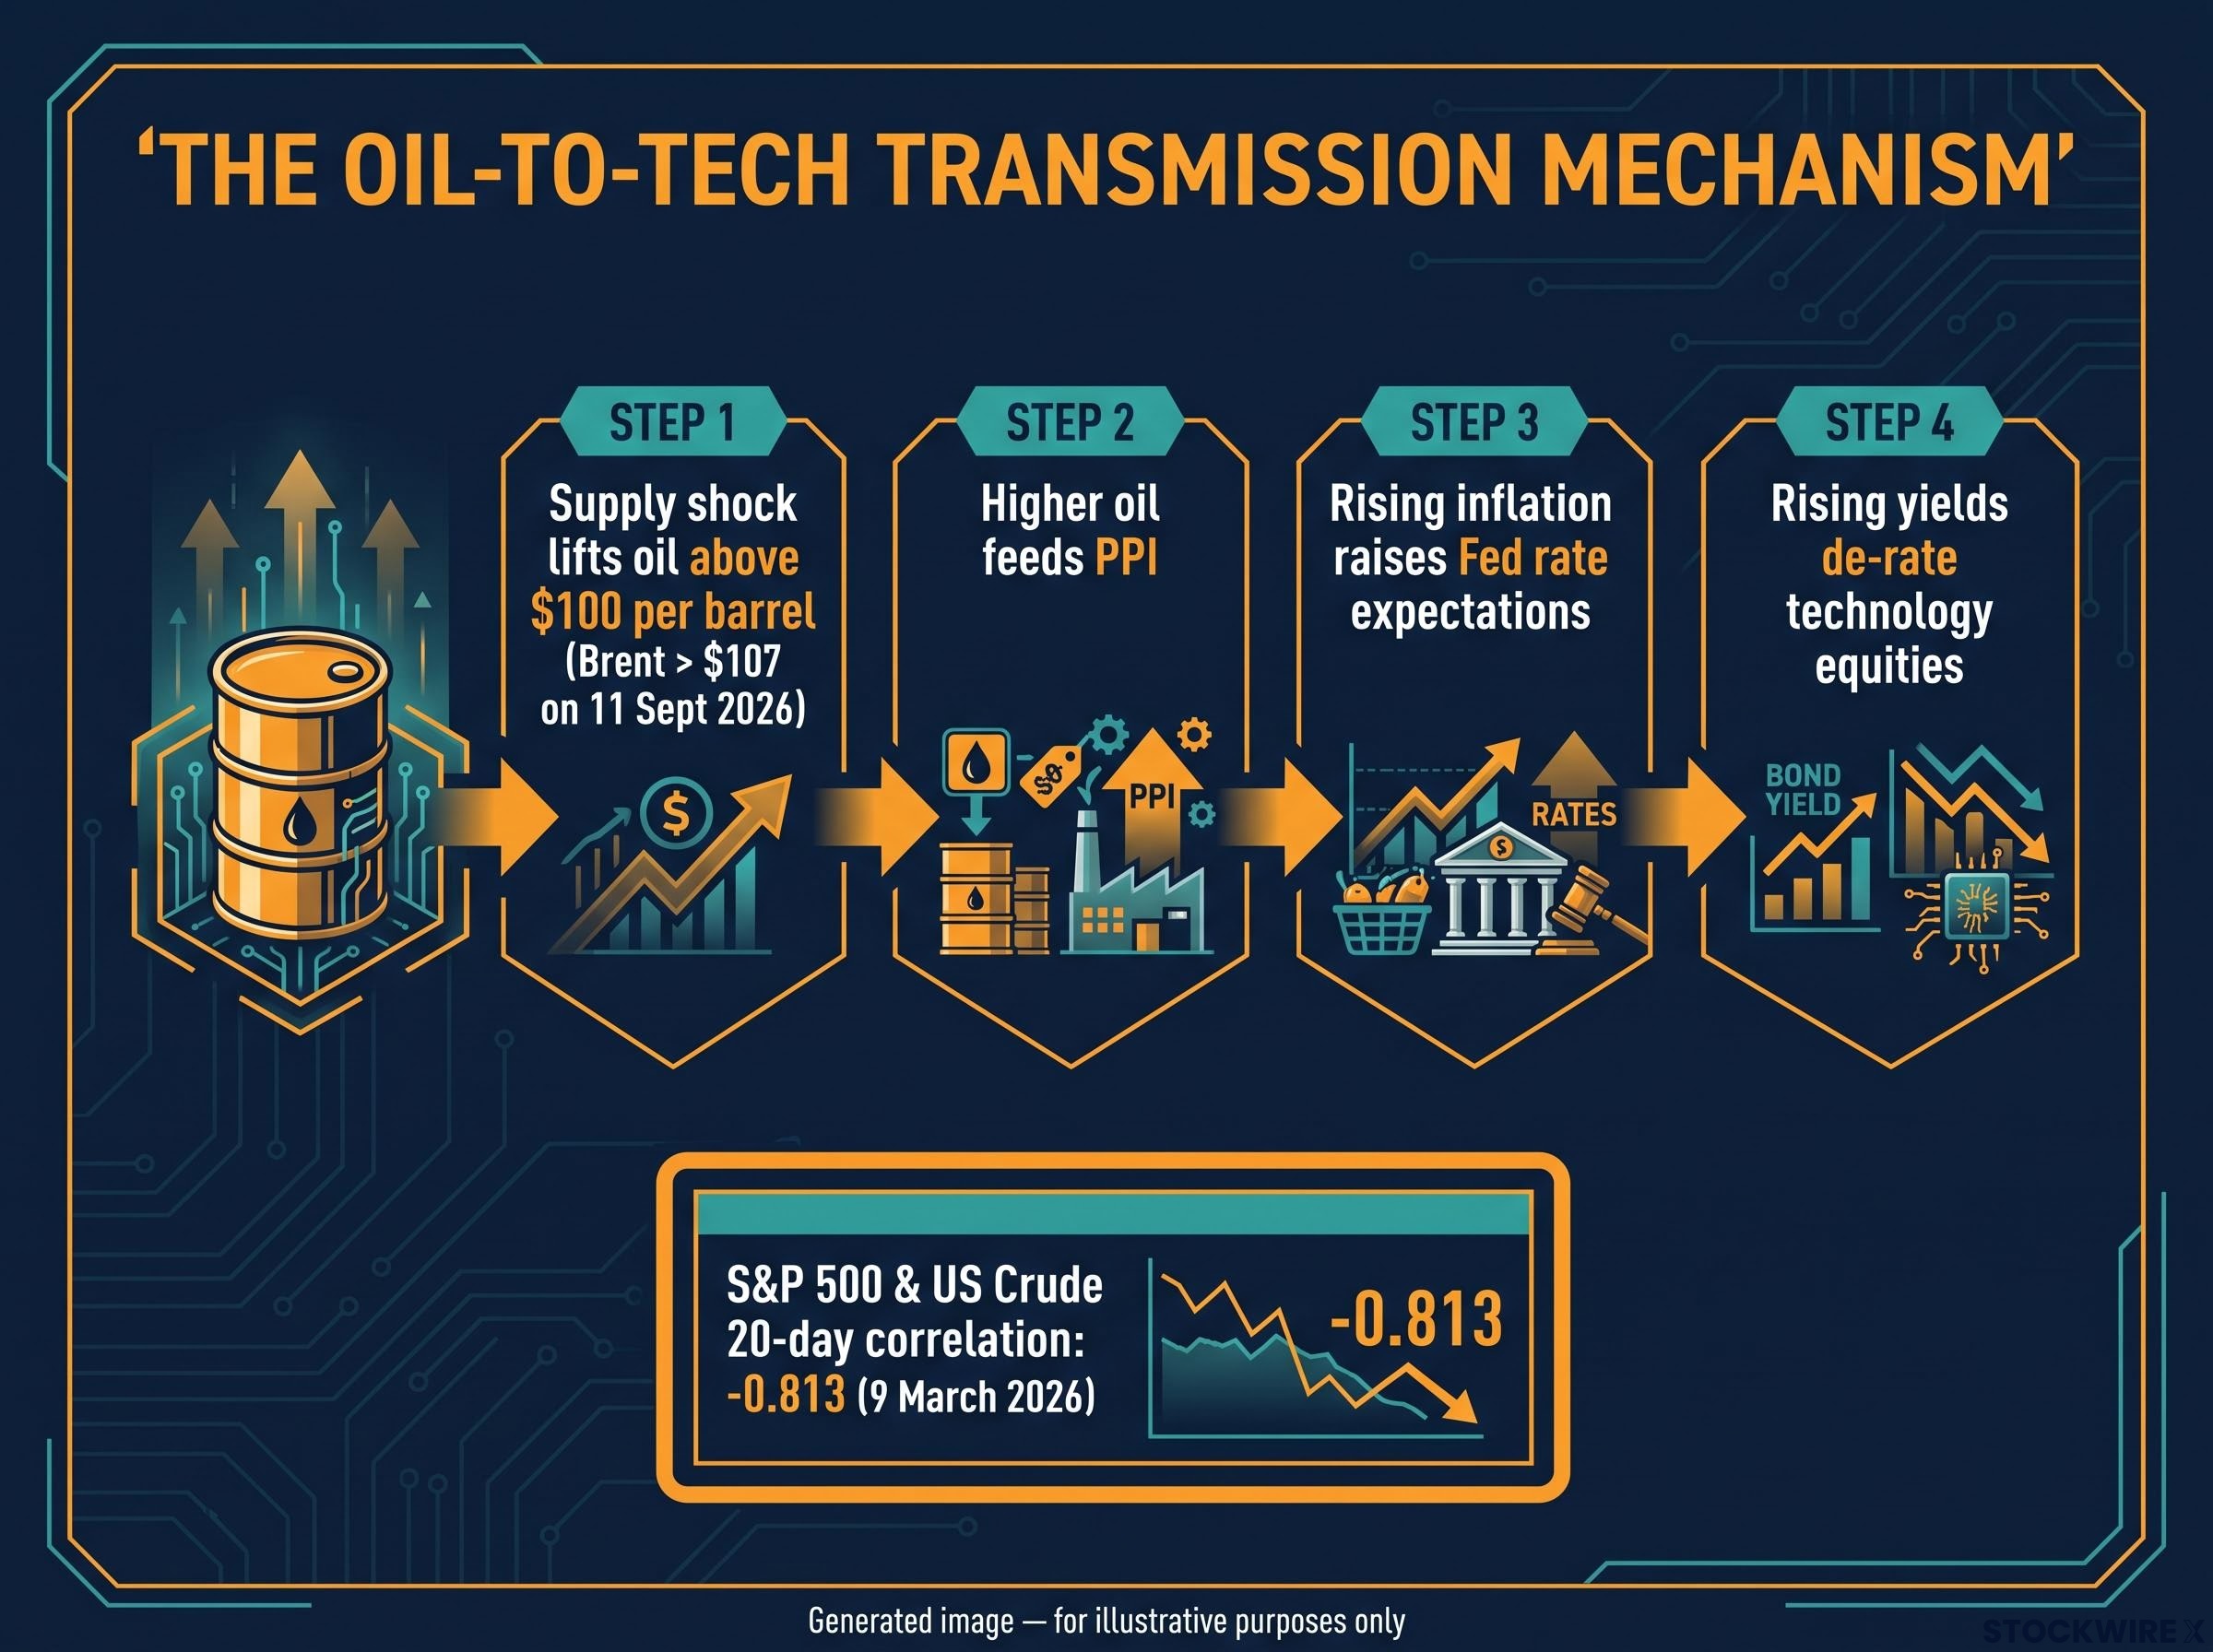
So energy rallies while the index falls. According to Investing.com’s 11 September 2026 market note, with Brent above $107, oil was feeding directly into the rates and Fed story rather than trading as an isolated geopolitical event.
The $100 per barrel level acts as a sentiment threshold. Above it, rate-hike fear dominates and appetite for technology stocks weakens. Below it, yield pressure eases, the 10-year Treasury yield tends to soften, and tech interest returns.
The correlation data shows how tightly this has bound together. Reuters reported the 20-day correlation between the S&P 500 and US crude oil at -0.813 on 9 March 2026, a strong inverse relationship. A MarketWatch/Morningstar analysis tracked the rolling 63-day correlation between WTI and the index falling from roughly zero in late February to -0.48 by late April 2026.
The EIA Short-Term Energy Outlook for September 2026 provides the authoritative government dataset on Brent and WTI price trajectories, supply and demand balances, and inventory levels, giving context to the sustained above-$100 crude readings that have kept rate-hike expectations elevated throughout the period.
| Date (2026) | Brent settlement | WTI settlement | Index context |
|---|---|---|---|
| 9 September | $101.21 | Above $100 | Rate-hike sentiment dominant |
| 14 September | $105.68 | Above $100 | Yield pressure on tech |
| 15 September | $108.75 | Above $100 | Peak crude reading |
| 17 September | $104.82 | $101.91 | Oil feeding rates story |
What that -0.813 figure means for you is direct: every sustained oil spike above $100 is functionally a headwind pressing on the majority of your fund’s value, even as the energy stocks inside it are the ones rallying. And energy is only about 3.0 percent of the index by weight, so this is not about energy carrying the fund. It is about oil pulling the rate lever that moves everything else.
How extreme technology concentration created the conditions for this anomaly
None of this would matter if the S&P 500 were genuinely broad. The reason an oil-driven rate move can whipsaw the whole index is that the index is, at its functional core, a concentrated technology fund wearing the label of a diversified market.
The numbers are stark. Information Technology represented approximately 38.6 percent of S&P 500 market capitalisation on 16 September 2026, per ChartRow, up from 38.0 percent on 30 June 2026 according to S&P Dow Jones Indices. The top three names carry most of that: Nvidia at roughly 7.5-8.6 percent, Apple at around 6.8-7.5 percent, and Microsoft at approximately 4.7-5.7 percent. Together, the top 10 constituents account for around 37-38 percent of the entire index.
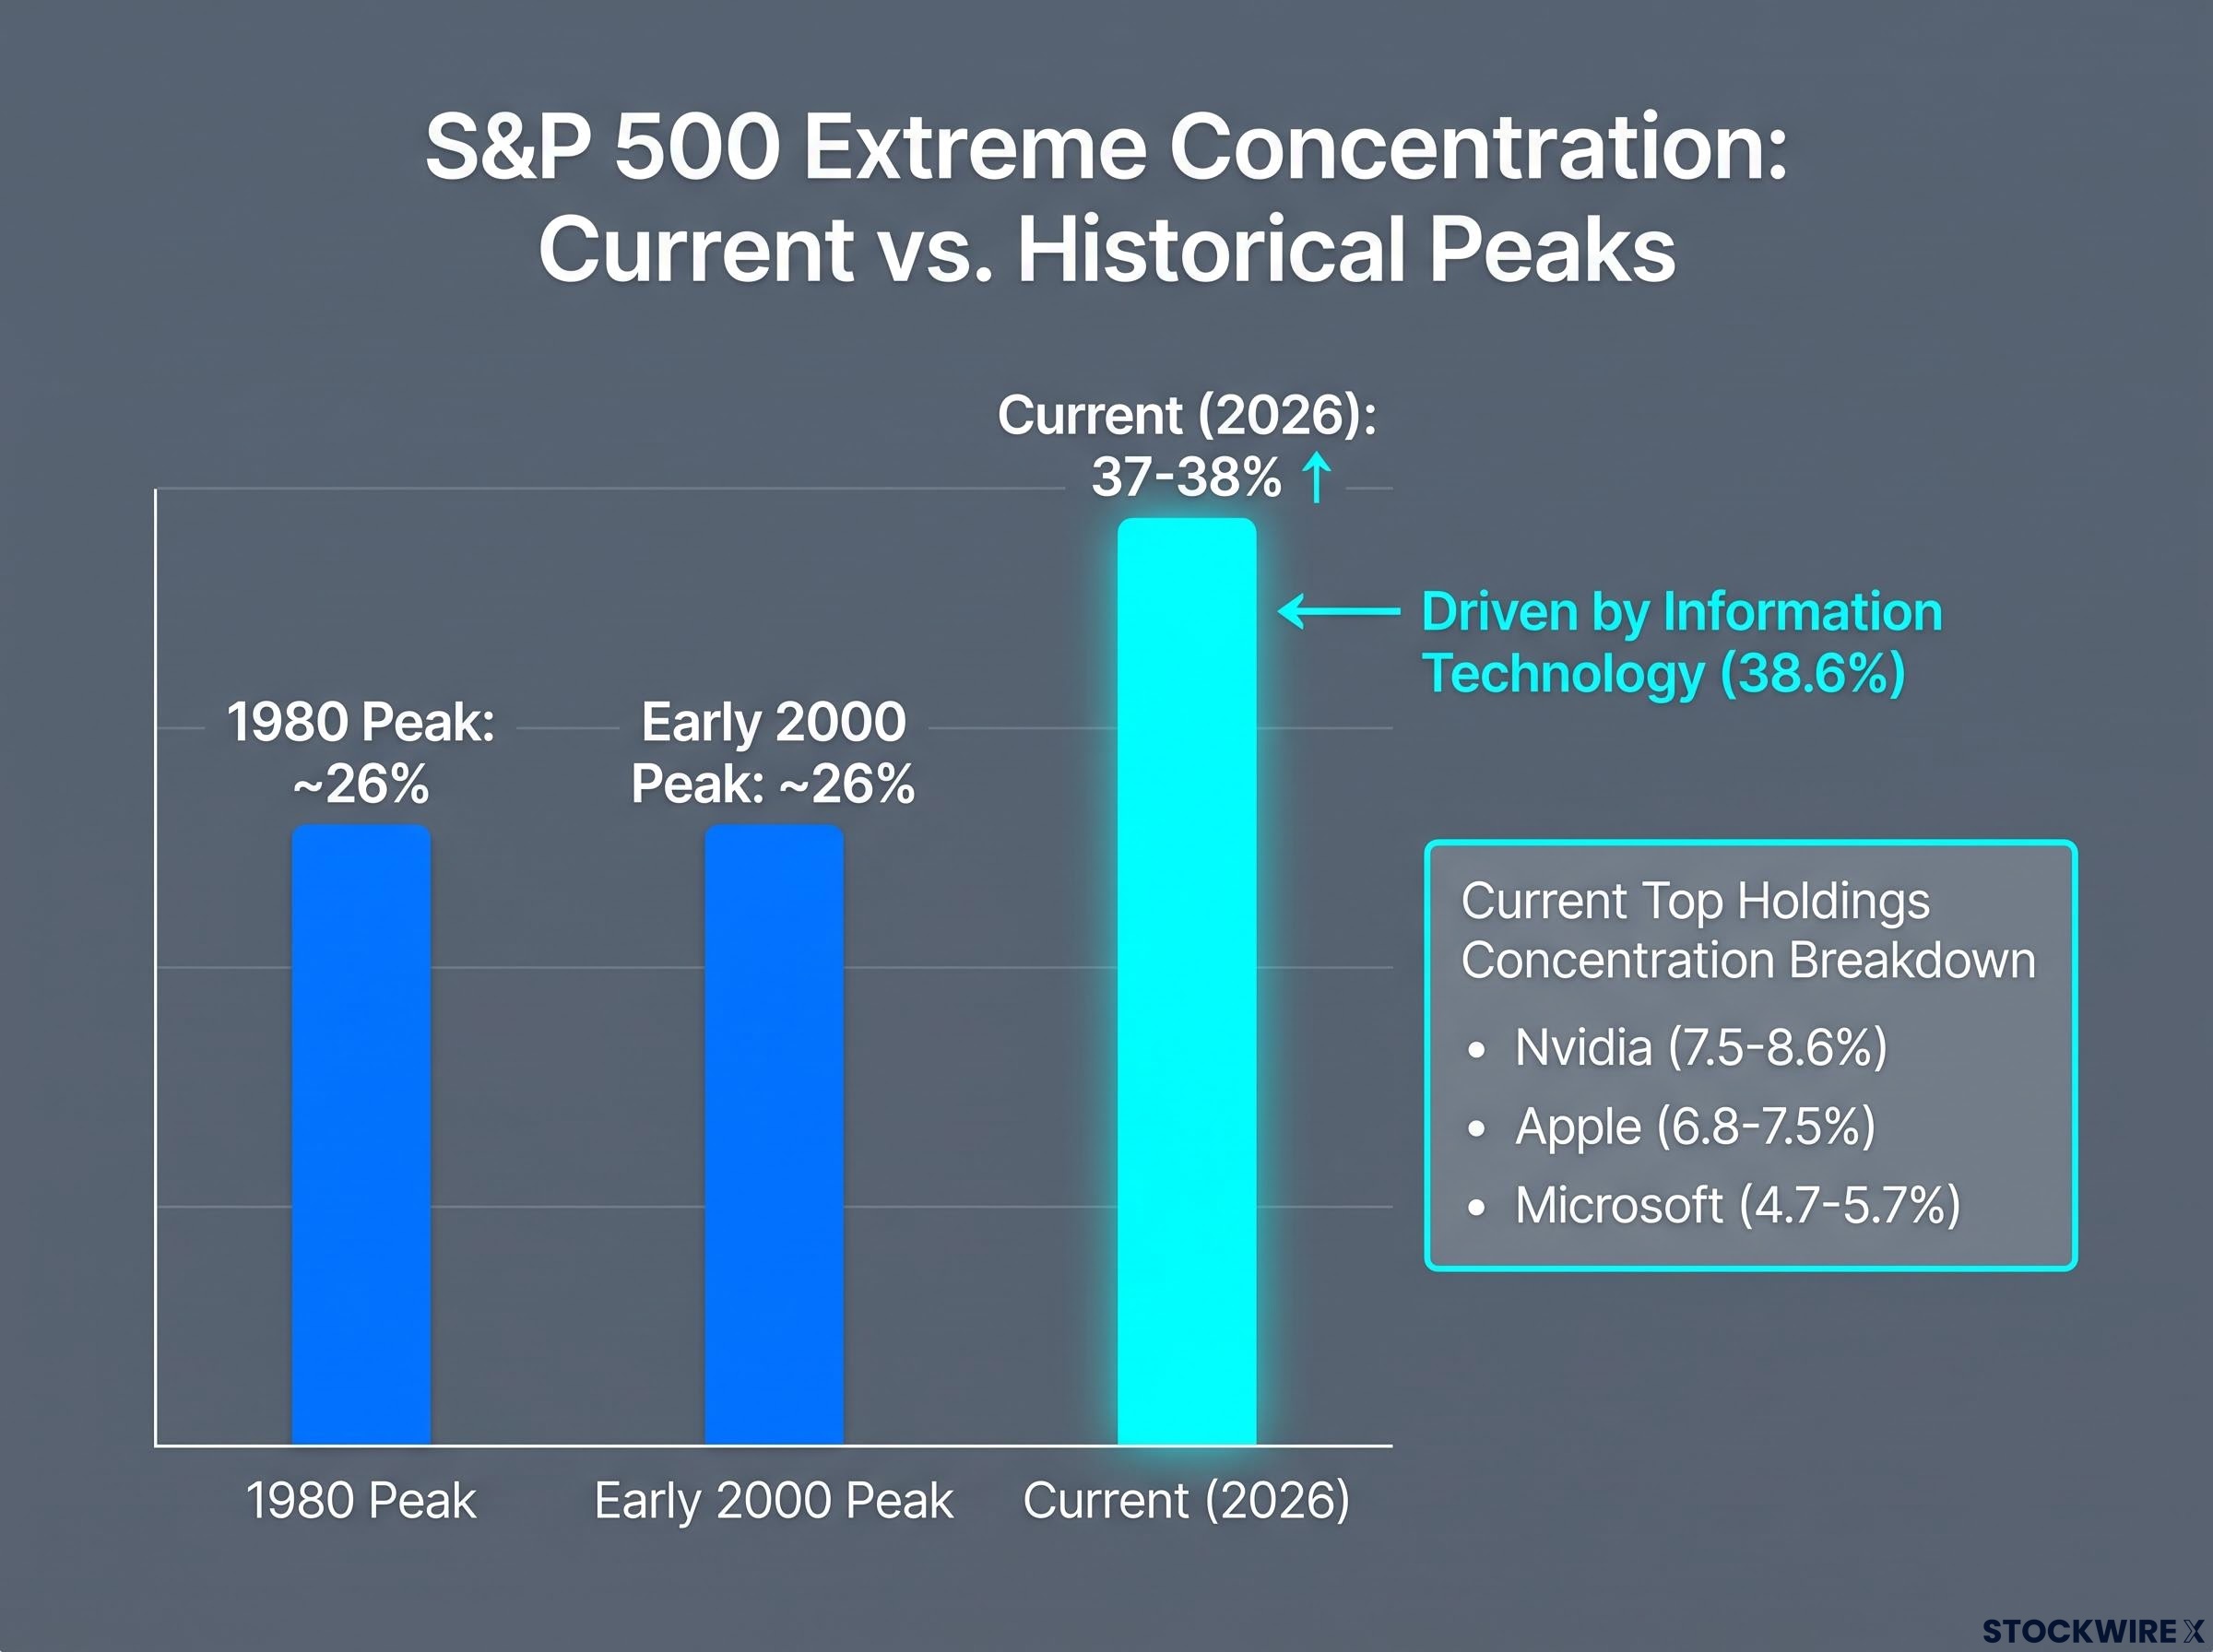
This is what creates the polarisation. Mega-cap technology and AI-linked names dominate the positive-beta side, while energy, utilities, consumer staples, and rate-sensitive sectors form the negative-beta counterweight. Evercore ISI found that financials, utilities, consumer staples, and energy made up roughly 70 percent of the 20 most negative-beta names.
| Sector | Weight (30 June 2026) | Current beta camp |
|---|---|---|
| Information Technology | 38.0% | Positive-beta core |
| Financials | 11.8% | Mixed, rate-sensitive names negative |
| Consumer Staples | 4.6% | Negative-beta counterweight |
| Energy | 3.0% | Negative-beta counterweight |
| Utilities | 2.2% | Negative-beta counterweight |
VanEck put the consequence bluntly in a July 2026 note: with a small number of mega-caps driving nearly 40 percent of the index, a passive S&P 500 allocation has effectively become an active bet on concentrated technology and growth themes.
Index fund concentration in the US has now exceeded the 1930s historical peak, with five mega-cap names controlling roughly 23% of the broad market and driving over 70% of Q1 2026 losses before engineering more than half of April’s recovery, a pattern that illustrates how cap-weighted construction amplifies both upside and downside.
The 100-day correlation between the Magnificent 7 and the S&P 500 Equal Weight Index has fallen to -0.27, a historically low reading (AllianceBernstein, July 2026).
That -0.27 figure is the clearest evidence you can get. The largest names in your S&P 500 fund are now moving inversely to the average stock inside the same fund. Owning the index no longer means owning a diversified market. It means owning a concentrated growth bet with a set of defensive stocks quietly hedging against it.
Why the problem does not fix itself when oil falls
Here is the trap that makes this hard to escape. If oil rises, it hurts the tech-heavy index through the rate channel described above. If oil falls, the energy stocks that had been rallying now drop, removing the partial counterweight and dragging on the index directly.
There is no clean exit in either direction. With energy at only 3 percent of the index, its indirect influence through inflation and rate expectations far outweighs its direct contribution to index performance. The tail is wagging the dog, and both ends of the oil move find a way to press on your holdings.
Is this structural or cyclical, and what historical episodes say about resolution
So is the index broken, or is this a phase? Two credible camps disagree, and the honest answer is that both have evidence worth weighing.
The structural-risk camp argues this is durable. ClearBridge Investments, part of Franklin Templeton, contended in June 2024 that the cap-weighted index has become less diversified because the largest names pull the entire valuation multiple higher, effectively concentrating passive investors in a narrow set of mega-caps. Morgan Stanley’s 2025 “Consequences of Concentration” work reinforced the point.
NBER research on index concentration and diversification published in July 2026 found that the growing weight of a handful of mega-caps in the S&P 500 creates measurable compliance and portfolio construction challenges for investment funds, reinforcing the structural rather than merely cyclical character of the polarisation.
The top names share similar factor and sector exposures, reducing the diversification benefit within the index and favouring equal-weight strategies (Morgan Stanley, “Consequences of Concentration”, 2025).
The cyclical-rotation camp reads the same data differently. AllianceBernstein framed the current moment in July 2026 as a high-dispersion episode, with the 63-day correlation roughly 1.5 standard deviations below average and the 126-day correlation near levels last seen after the 2000 tech bubble, an environment that creates active-management opportunity rather than a permanent flaw. On this view, dispersion spikes, leadership rotates, and valuations mean-revert.
Which camp proves right will come down to three variables:
- Oil relative to $100: sustained readings above it keep the rate pressure on tech and the polarisation alive; a drop below eases it.
- Federal Reserve policy: a shift toward cutting relieves the yield pressure de-rating growth stocks; continued tightening entrenches it.
- Earnings breadth: if profit growth broadens beyond the technology core, the positive-beta camp widens and the index re-diversifies naturally.
What the 2000 dot-com and 2008 commodity episodes actually teach us
History offers a warning rather than a timetable. Osborne Partners noted in January 2025 that the two most concentrated prior periods, 1980 and early 2000, saw the top 10 names reach about 26 percent of the market, after which that cohort underperformed for years.
In 2008, energy hit roughly 17 percent of the S&P 500 as oil pushed past $140, and CNN Money reported that 17 of the 25 biggest first-half index gainers were energy stocks. When leadership reversed, investors most concentrated in the dominant sector took the sharpest losses, not merely mild underperformance.
The uncomfortable detail is that today’s concentration, with the top 10 at 37-38 percent, exceeds both the 1980 and 2000 peaks. That makes this episode structurally more extreme than its predecessors, not less. The precedents are clear that extreme concentration reverts. They are silent on when.
What this means for your S&P 500 allocation before the next rotation arrives
None of this is an argument to sell your index funds. It is an argument to understand what is actually inside them before you assume the diversification is doing its job.
Beta-weighted position sizing converts each holding into market-risk equivalent dollars, which is how you move from counting stocks to measuring actual exposure; a 50/50 dollar split between a high-beta technology ETF and a low-beta utilities ETF produces a 90/10 risk split that never appears on a standard brokerage statement.
The 115 negative-beta stocks currently in the index are a live, measurable signal that the polarisation is still active. That is not a reason to panic. It is a precise reason to check whether your portfolio’s real factor exposures match what you thought you bought.
Here are the diagnostic questions worth taking into a portfolio review or a conversation with your adviser:
- What percentage of your total equity exposure is effectively in technology and AI-adjacent themes, once you look through your index funds?
- Do you already hold, elsewhere in your portfolio, the sectors currently running negative-beta, such as energy, utilities, and staples?
- Would an equal-weight S&P 500 fund, which caps the influence of the mega-caps, change your effective exposure meaningfully?
- Is your idea of diversification based on the number of positions you hold, or on how those positions actually correlate?
Institutional responses cited across 2026 point in a consistent direction. InvestmentNews in May 2026 and Investing.com in August 2026 both pointed toward under-represented sectors and equal-weight or alternative-weighting strategies. CFA Society New York in 2025 raised small-caps, international equities, and long/short strategies as structural complements to a concentrated index.
This analysis is for informational purposes only and should not be considered financial advice. Investors should conduct their own research and consult with a qualified financial adviser before making allocation decisions based on structural index analysis.
A structurally polarised index is not a permanently broken one, but the risks are real and measurable
The core of all this is simple to hold in your head. The record count of 115 negative-beta stocks is a measurable symptom of two forces: extreme technology concentration at 38.6 percent of the index, and an oil-to-rates transmission mechanism activated by crude holding above $100 per barrel. Together they have temporarily split the index into two camps pulling against each other.
The uncertainty is real. The structural and cyclical camps both hold credible evidence, and the timeline for resolution is genuinely unknown. History says extreme concentration reverts; it does not say when.
Your takeaway is a shift in mental model more than a portfolio action. The index is not broken in any permanent sense, but it is not doing what most investors assume it is doing right now. Watch the three variables that will tell you when the polarisation is easing: oil relative to $100, the Fed’s signals on rates, and whether earnings leadership broadens beyond technology. Knowing the difference between what you own and what you think you own is, in itself, a genuine edge.
Past performance does not guarantee future results, and forward-looking interpretations are subject to market conditions and various risk factors.