The S&P 500 was barely moving. Stocks drifted, the tape looked quiet, and yet the VIX, the market’s so-called fear gauge, was sitting at 17 or 18. If that index really measures how much the market is moving, those two numbers cannot both be right at the same time.
That gap between implied volatility (what the VIX shows) and realized volatility (what markets are actually doing) is not a glitch. It is a structural feature of how options are priced, and it widens or narrows on forces most equity investors never see directly. Understanding it matters because the VIX shapes how professionals hedge, how dealers position, and how large events like triple-witching or VIX settlement reshape near-term price behaviour across the whole market.
This piece gives you a clear framework for why the VIX reads higher than realized volatility almost all of the time, what happens when a trillion-dollar options expiration clears the board, and what both of those things mean when you are trying to make sense of short-term price action.
Why the VIX and realized volatility are measuring different things
Look at the VIX on your screen and you might assume you are reading a live measurement of market turbulence. You are not. You are reading a price.
The VIX is derived from options prices, which reflect what traders are willing to pay for protection right now. Realized volatility, by contrast, measures what has actually happened to the S&P 500 over a trailing window. One is a forward-looking insurance quote; the other is a backward-looking count of how much prices really moved.
The VIX futures premium compounds this structural gap further: because spot VIX cannot be directly purchased or cost-effectively replicated, futures sit in contango roughly 80% of the time, meaning the price you trade is almost always above the index you are watching.
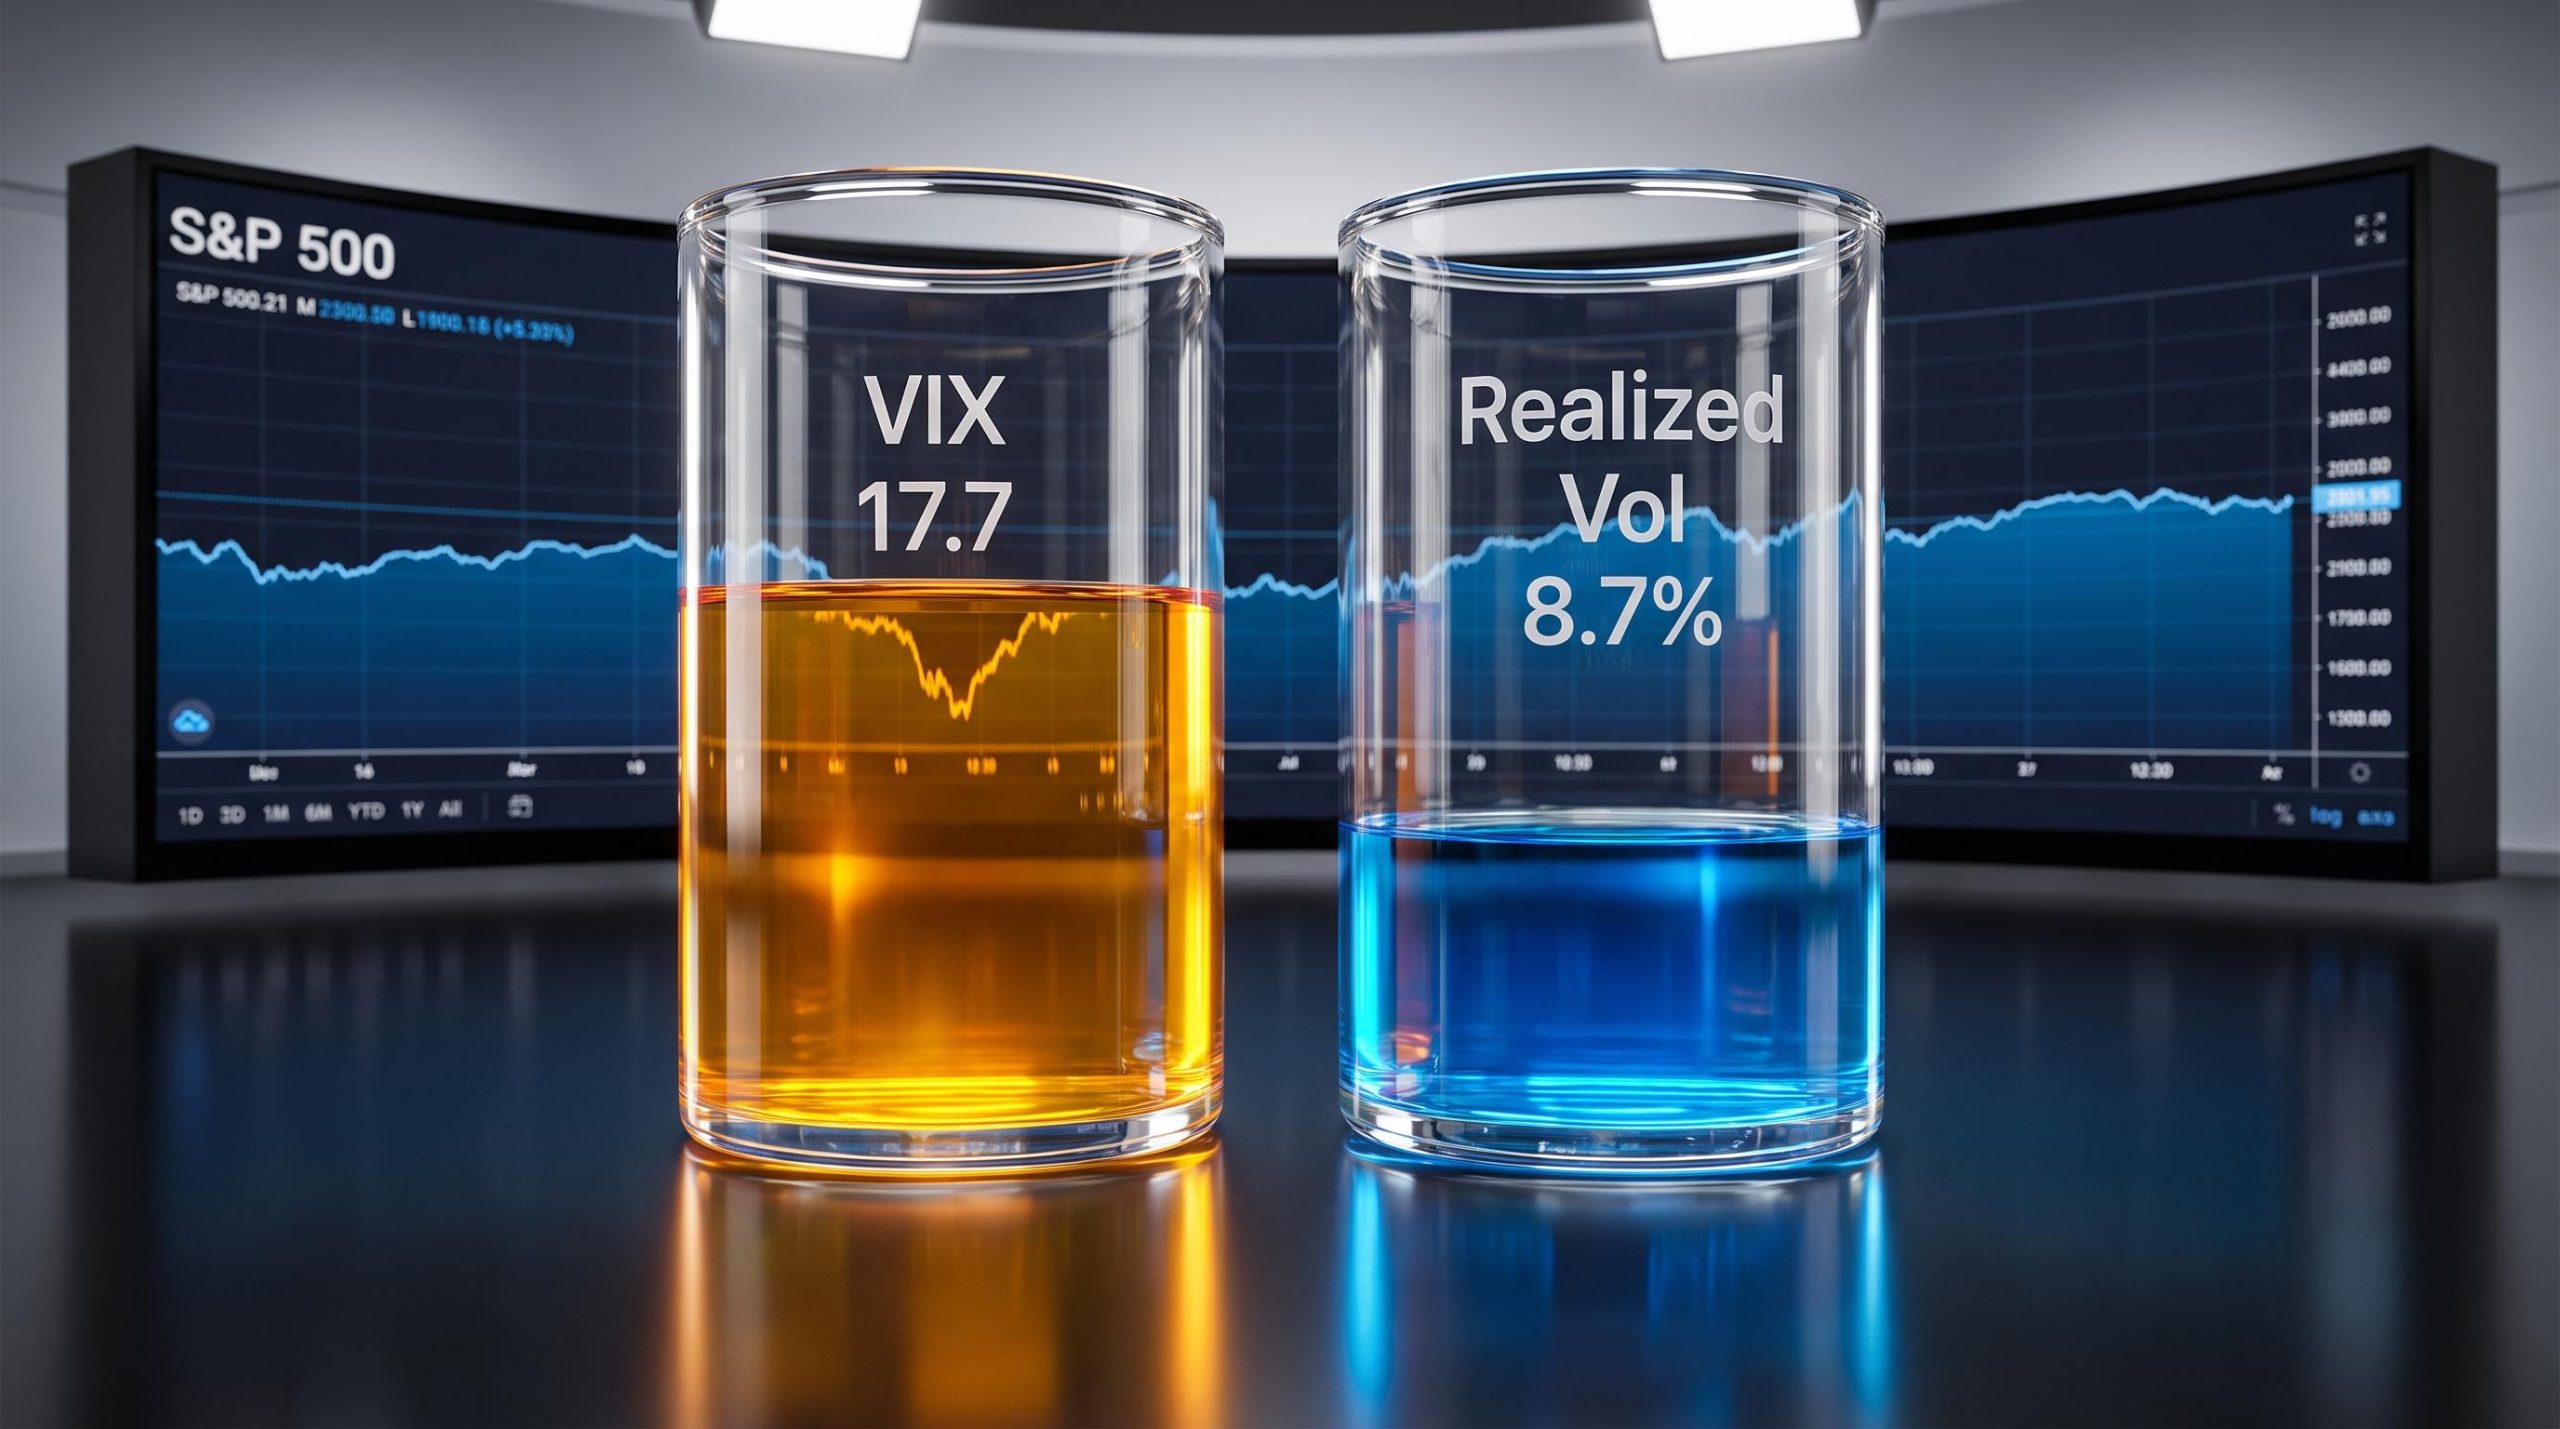
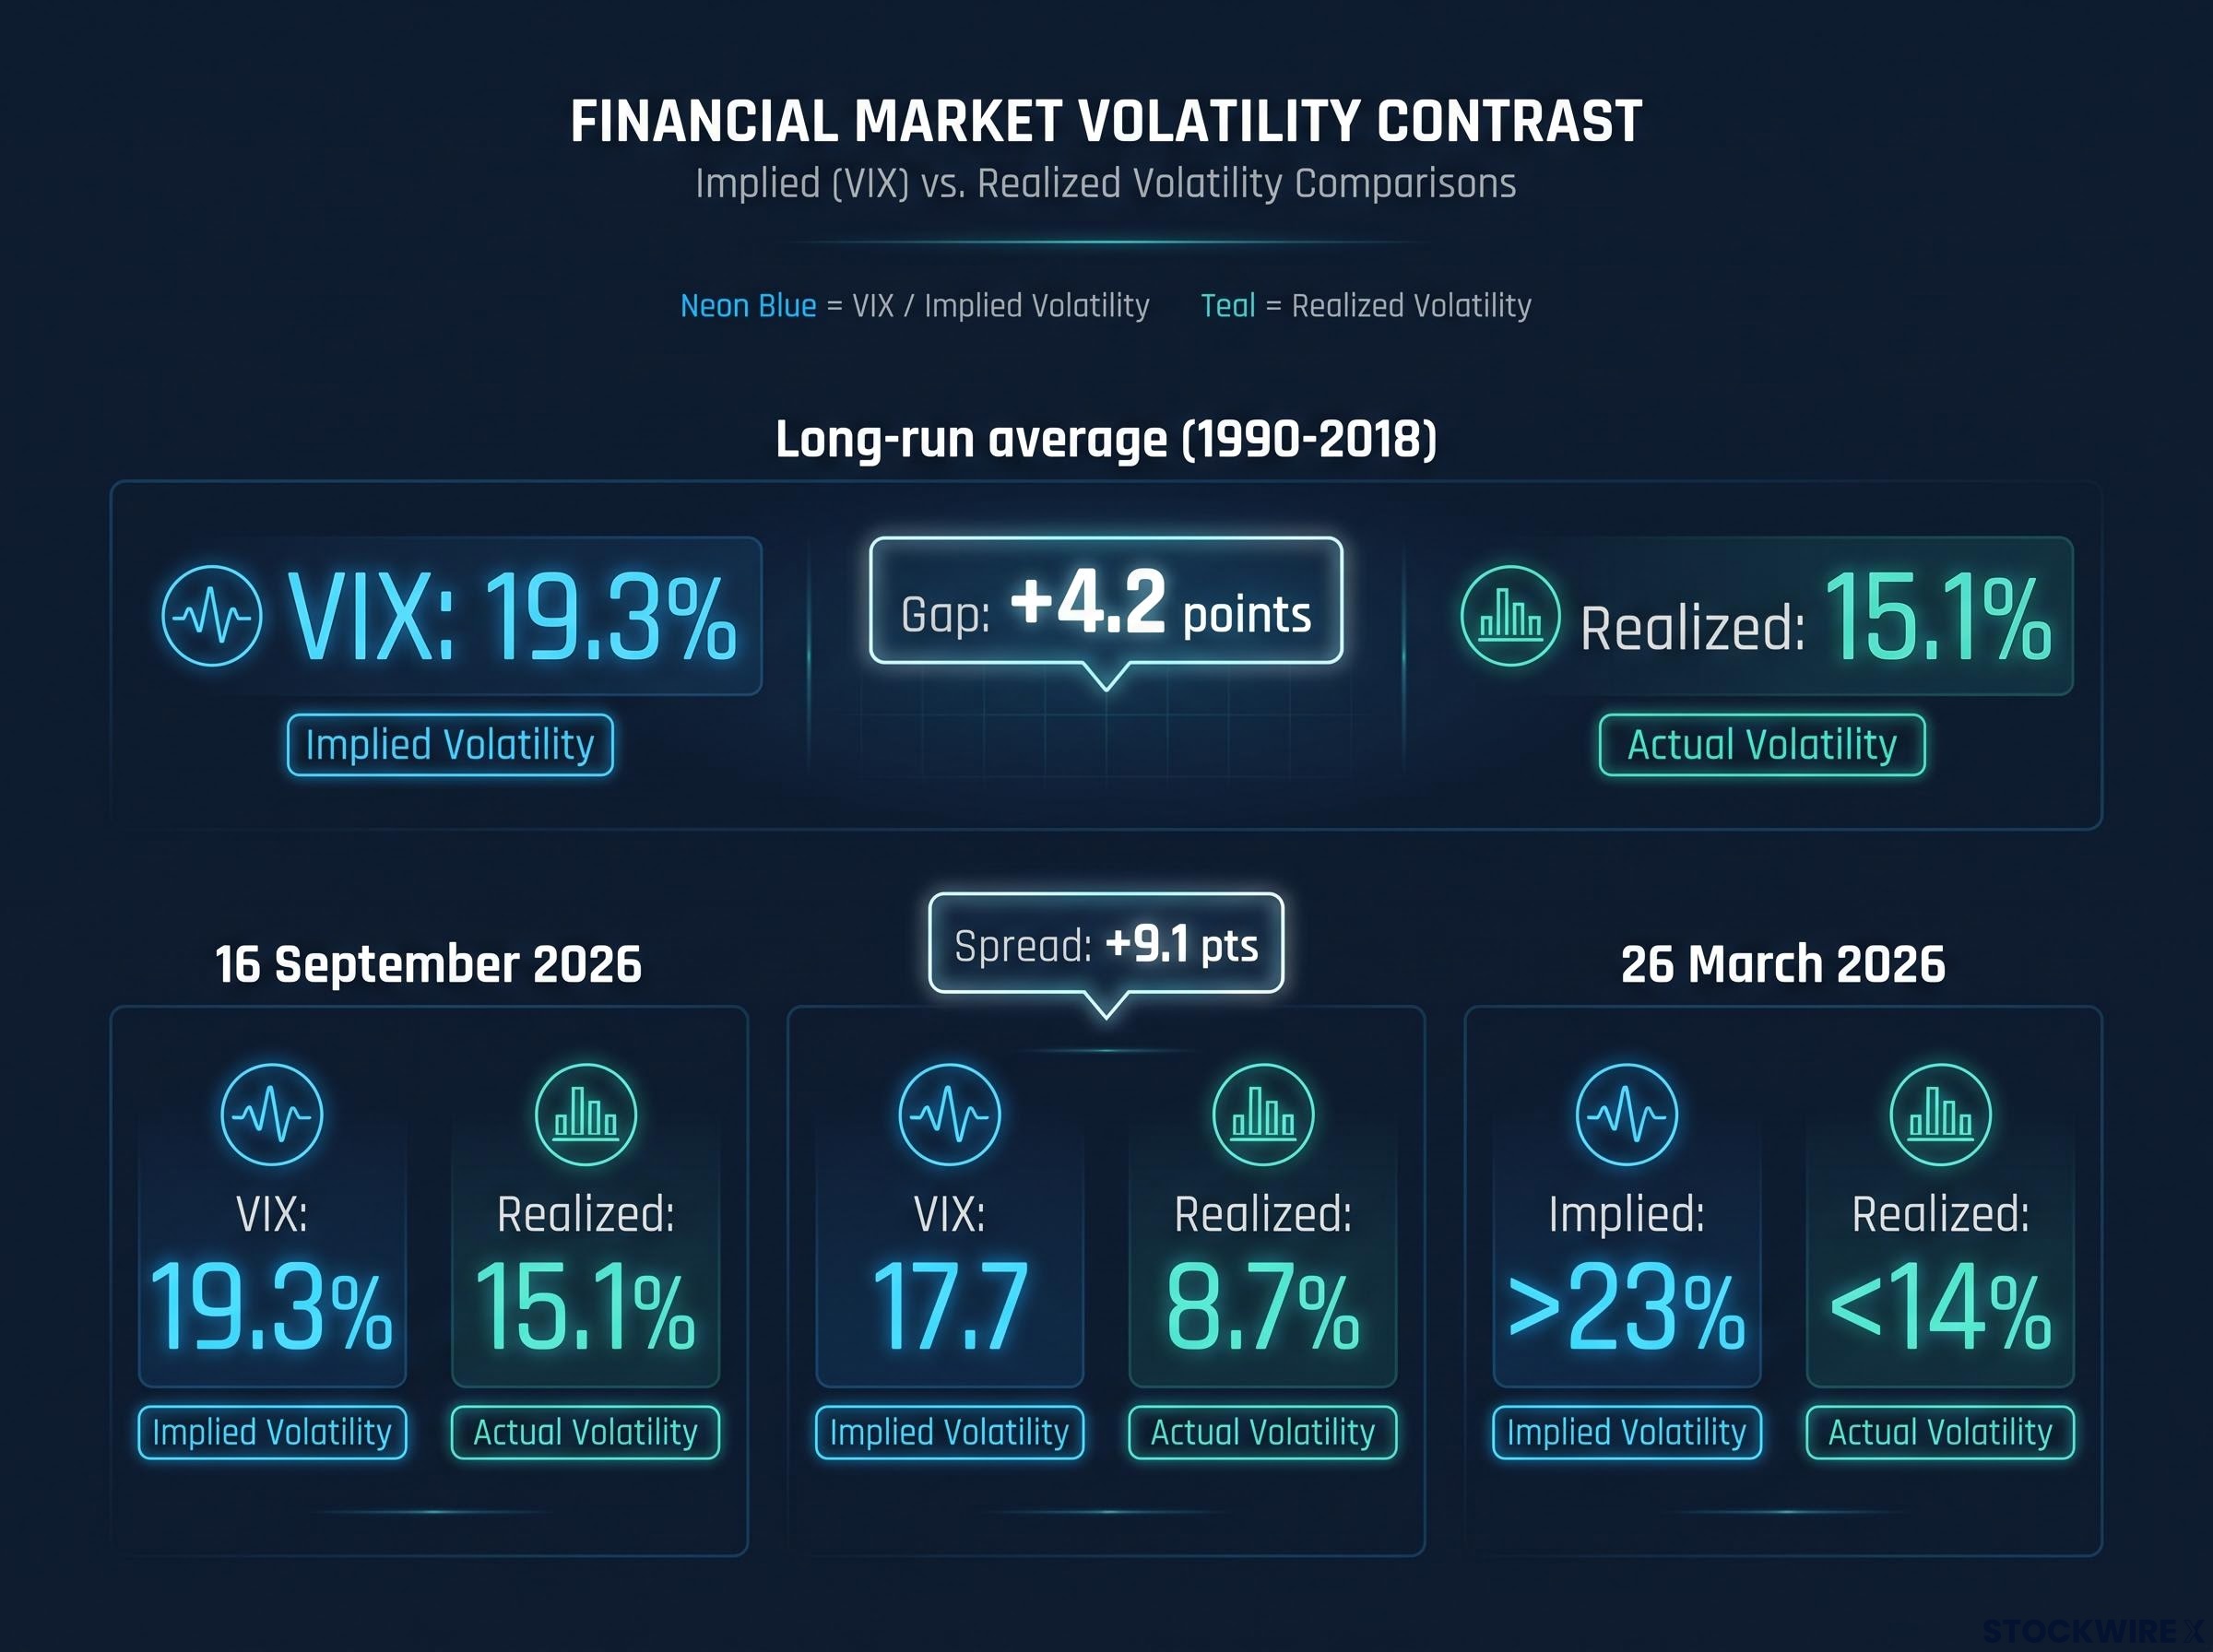
That distinction shows up in the numbers immediately. Around the most recent Federal Open Market Committee (FOMC) meeting, the VIX sat near 17-18 while realized volatility was running around 9, with the S&P 500 holding near 7,600. That is a spread of roughly 8-9 volatility points, more than double the long-run norm.
The reason the VIX runs structurally rich is buried in how it is built. It is computed from a strip of out-of-the-money SPX options, including crash-sensitive puts. Those puts are priced for rare but severe downside events, so the headline number embeds skew and tail-risk pricing rather than a neutral estimate of average volatility.
From 1990 to 2018, the VIX averaged 19.3% while S&P 500 realized volatility averaged 15.1%, a persistent gap of 4.2 points, according to research by Bondarenko summarised in a Cboe white paper.
Set the recent readings against that long-run anchor and the current gap looks stretched.
| Observation period | VIX level | Realized volatility | Spread |
|---|---|---|---|
| 16 September 2026 (TheTrading.tools) | 17.7 | 8.7% (1-month) | +9.1 pts |
| Recent FOMC period | ~17-18 | ~9 | ~8-9 pts |
| Long-run average (1990-2018) | 19.3% | 15.1% | +4.2 pts |
The takeaway for you is simple but easy to miss. When you glance at the VIX, you are reading a market-derived insurance price, not a statistical prediction, and that price will almost always sit above what the market subsequently does.
When big ASX news breaks, our subscribers know first
The structural reasons the gap is not an accident
If the VIX consistently overstates realized volatility, why does the gap never close for long? Because three separate forces hold it open, and none of them is temporary.
The first is the most intuitive. Large institutions are structurally long equities and chronically need portfolio insurance. To get it, they bid up out-of-the-money puts above their actuarial fair value, which embeds a permanent crash-insurance premium into option prices and, by extension, into the VIX itself.
The second is academic but well documented. Research by Bollerslev, Tauchen and Zhou, by Carr and Wu, and by Bondarenko shows that option-implied variances systematically exceed realized variances. That surplus is compensation to option sellers for bearing volatility risk and rare, violent jump risk in equity returns.
The three drivers behind the persistent premium break down like this:
- Insurance demand: long-only institutions overpay for downside protection they cannot easily replicate.
- Jump-risk compensation: sellers demand a premium for absorbing the tail risk of sudden crashes.
- Construction-level skew: the VIX formula pulls in crash-sensitive puts, so their elevated prices flow straight into the headline number.
The empirical fingerprint of all this is the Cboe PUT index, which tracks a strategy of selling cash-secured S&P 500 puts. It has historically delivered higher risk-adjusted returns than simply holding the index, which is exactly what you would expect if buyers consistently overpay for protection.
How the VIX’s own construction method magnifies the gap
Here is the part most investors miss. The VIX is calculated from a weighted strip of out-of-the-money options across many strikes, not just the at-the-money contracts. Because crash-sensitive puts carry inflated prices, those prices feed directly into the headline figure.
The Cboe VIX calculation methodology specifies that near- and next-term out-of-the-money puts and calls are all included in the weighted strip, which means crash-sensitive puts with elevated prices flow directly into the headline index number regardless of prevailing market sentiment.
This is distinct from the demand-side story. Even in a market with perfectly neutral sentiment, the methodology alone would tend to produce a VIX that reads above a naive volatility forecast.
You can see the gap stretch under stress. Penn Mutual Asset Management reported on 26 March 2026 that 30-day implied volatility had climbed above 23% while 30-day realized volatility stayed below 14%, one of the widest implied-realized gaps in recent years. A separate Cboe cross-asset note put the premium near a one-year high across several asset classes in early 2026.
What this means for you is important. The “extra” VIX premium above realized volatility is not free money waiting to be harvested by selling options. It exists because sellers are absorbing the risk of rare, violent events, and the premium is the price of that exposure.
What actually happens when a trillion-dollar OPEX clears
Options do not just expire quietly. On the biggest expiration days, a wall of positioning rolls off the board at once, and the dealer flows behind it can pin the market beforehand and jolt it afterwards.
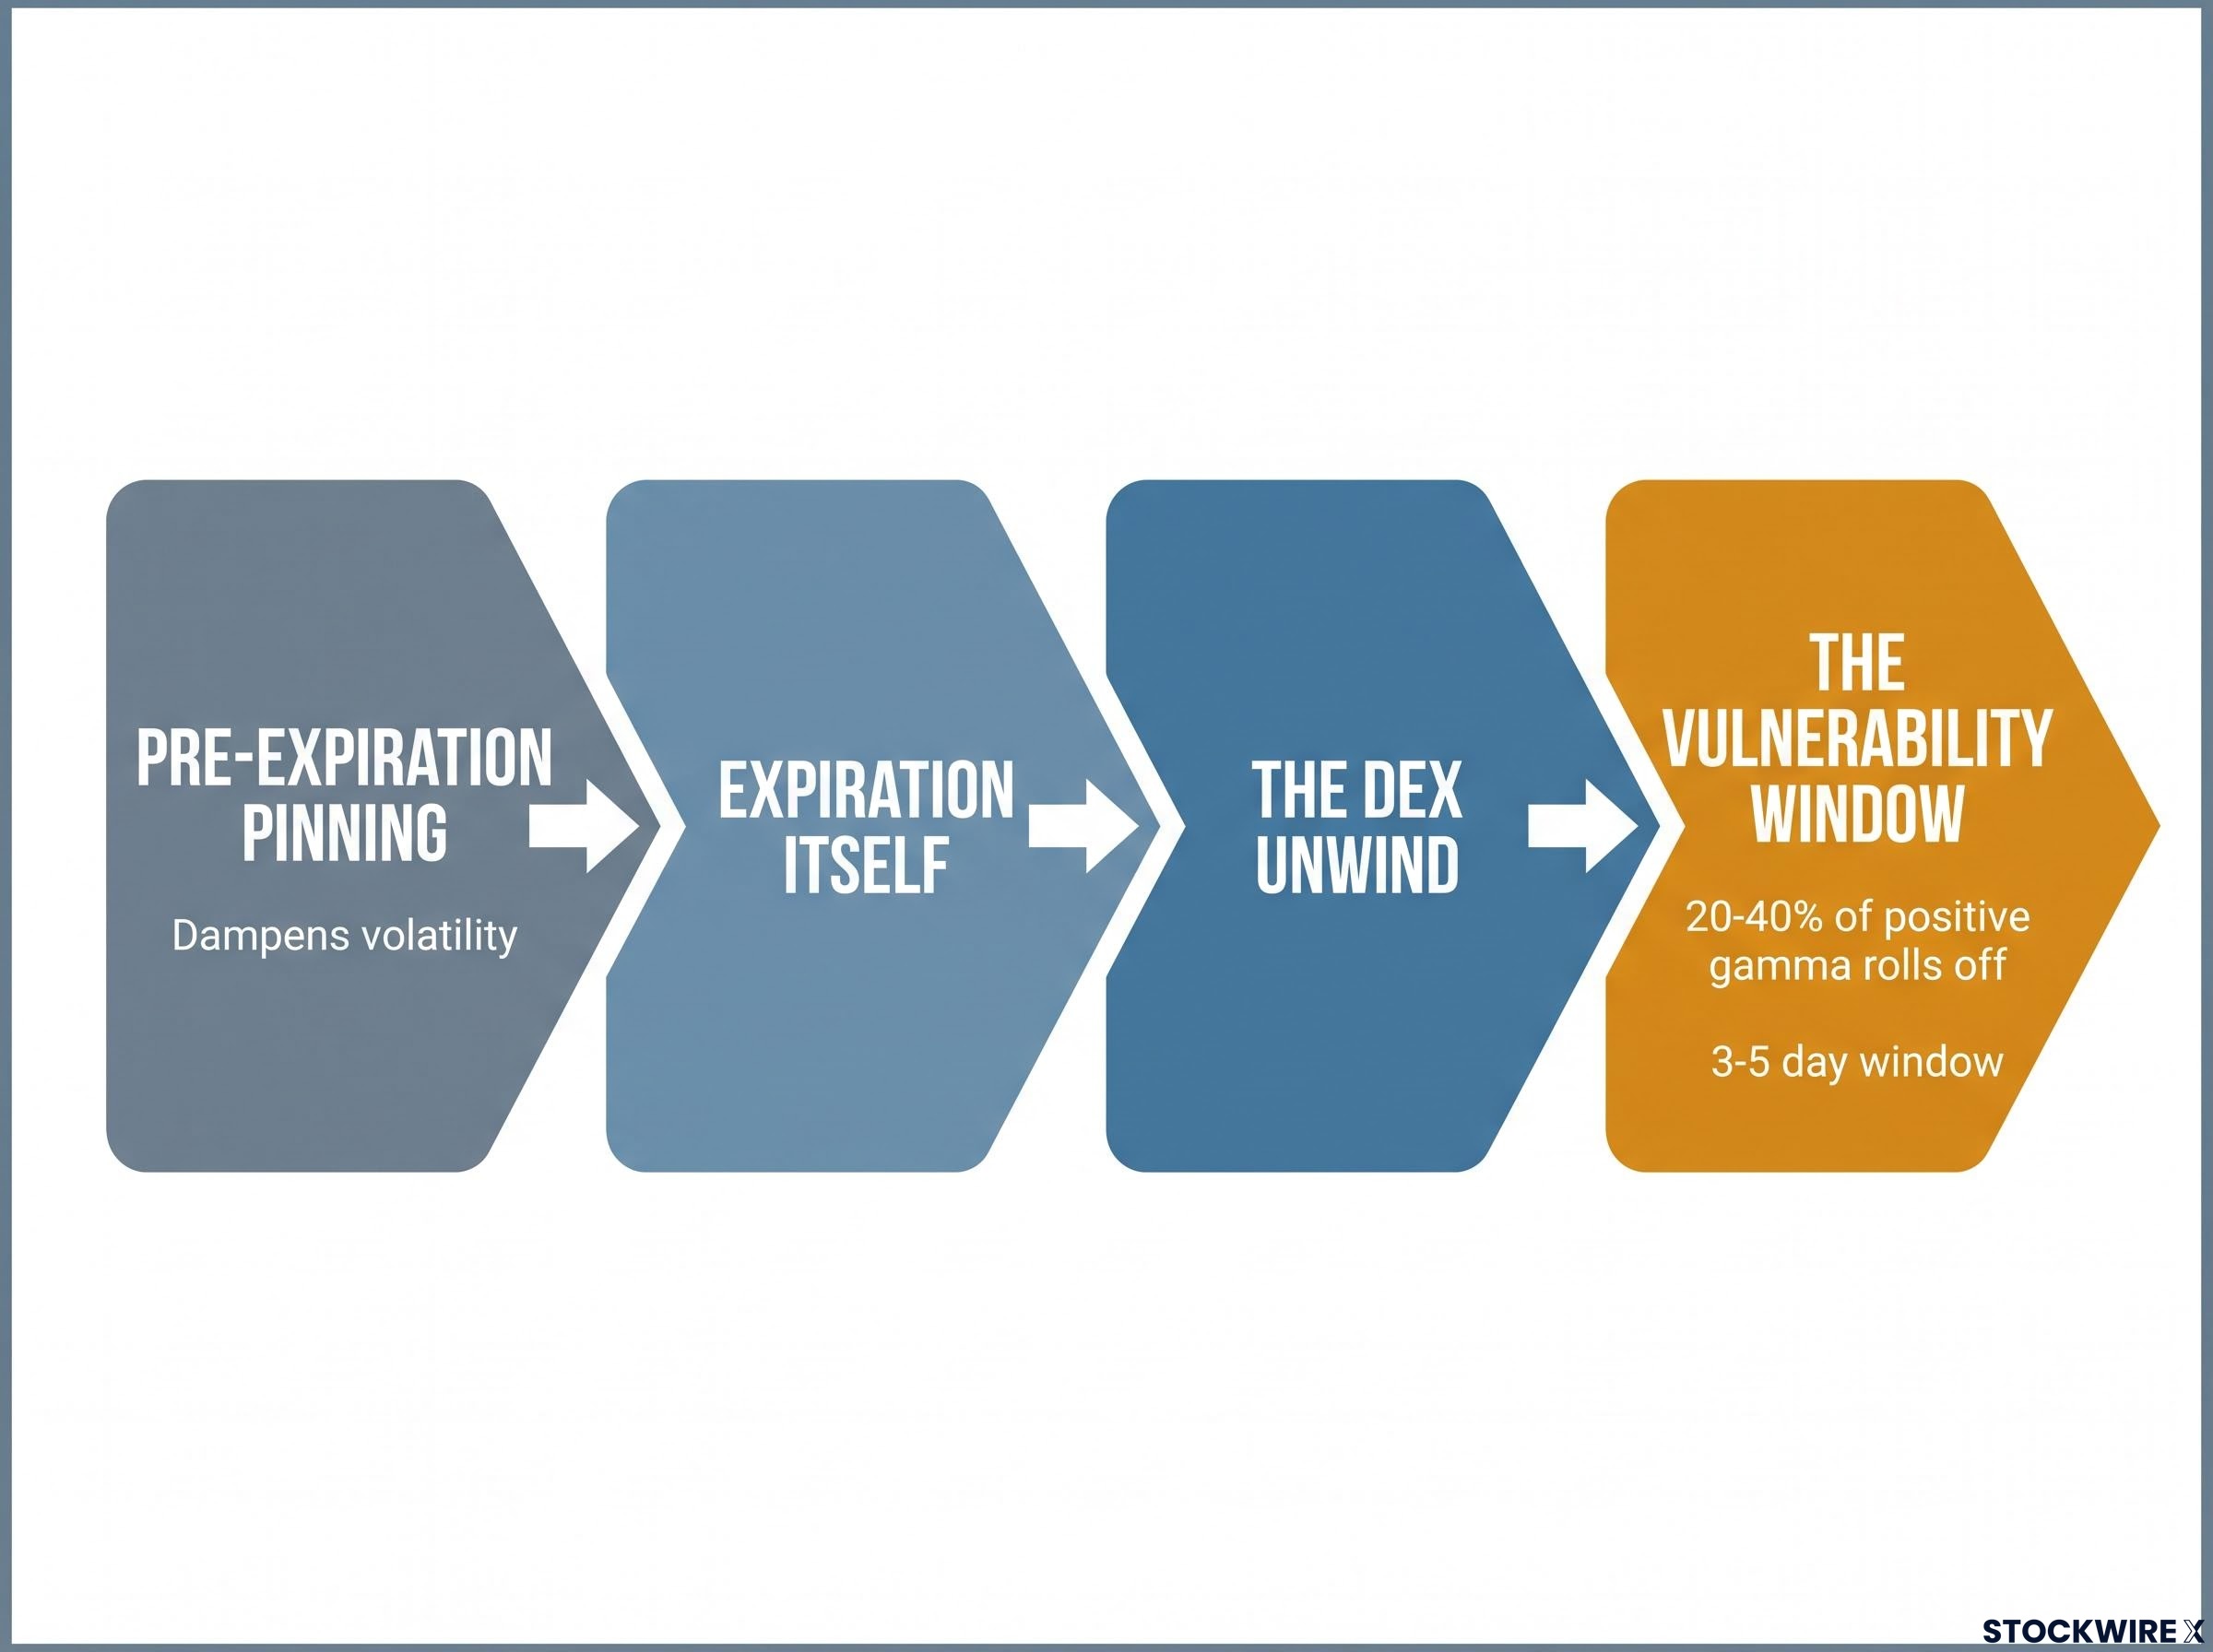
Walk through the sequence and you can map what you see on a chart to what is happening underneath:
- Pre-expiration pinning. When dealers are short options near large strikes, they must continuously re-hedge their delta as the index moves. That means buying when prices fall and selling when they rise, which dampens volatility and tends to pin the index near high-open-interest strikes.
- Expiration itself. At settlement, the options exposure vanishes from the book while the futures hedges are still on it momentarily.
- The DEX unwind. Those leftover hedges must be closed, generating mechanical buying or selling pressure in the immediate post-OPEX window.
- The vulnerability window. With gamma gone, the dampening mechanism disappears, leaving the market more exposed to directional moves.
That last point has real numbers behind it. Research from SpotGamma and GEXMetrix estimates that 20-40% of total positive gamma can roll off around a major expiration, opening a 3-5 day window in which markets are structurally more prone to sharp moves.
Triple-witching mechanics extend the disruption well beyond the expiration session itself: the S&P 500 has closed lower in the post-expiry week 27 of 35 times since 1990, averaging a loss of roughly 1.05%, a pattern driven by the same gamma rolloff and dealer unwind sequence described above.
The scale of these events has grown extraordinary.
In December 2025, more than $7.1 trillion in notional options exposure expired in a single session, the largest options expiration on record, according to Goldman Sachs data cited by CNBC.
The expiration discussed in the original source material was a smaller but still substantial event. Estimated notional was around $2.5 trillion, among the top five largest at the time. At the 7,600 strike, open interest was nearly balanced at roughly 60,000 puts and 60,000 calls; at 7,650, around 38,000 calls sat against 37,000 puts. The concurrent VIX settlement cleared roughly 40% of total VIX open interest, and that reduction, coinciding with the FOMC meeting, helped relieve some volatility pressure.
| Event | Notional value | Classification | Source |
|---|---|---|---|
| December 2025 | $7.1 trillion | Largest ever (overall) | CNBC, Goldman Sachs |
| June 2025 | $6.8 trillion | Largest triple-witching | BlockchainReporter, SpotGamma |
| March 2026 | $5.7 trillion | Largest March ever | Investing.com (Citigroup) |
| Source-discussion OPEX | ~$2.5 trillion | Top five at the time | Original source discussion |
For you, holding positions through a major expiration, the practical read is this. The calm that often precedes a big OPEX is not a sign of reduced risk. It is a mechanical condition created by dealer pinning, and it ends the moment the options expire and the hedges come off.
When the VIX-to-realized gap becomes a misleading signal
A persistently wide gap between implied and realized volatility looks like a gift. The VIX is “too high,” realized volatility is low, so surely you can sell the difference and pocket the premium.
The surface logic is not wrong. Strategies that systematically sell index options have historically harvested excess returns precisely because buyers keep overpaying for protection. The problem is what happens on the rare days when the trade goes against you.
Shorting volatility to harvest the premium is a negative-skew strategy. It earns small, frequent gains and then, without warning, gives all of them back and more.
Volatility premium inversion, where realized volatility overtakes implied by as much as 33 points, is documented most clearly in slow-moving crises that options markets price too calmly to anticipate, making it the scenario that most harms sellers who enter positions during seemingly benign conditions.
On 5 February 2018, the VIX spiked from roughly 17 to roughly 37 in a single session, wiping out investors who had built positions assuming elevated implied volatility would revert quietly.
That day, remembered as Volmageddon, collapsed short-volatility products including the XIV note. It is the clearest reminder that the premium exists to compensate for exactly the kind of shock that erases it.
The gap is especially deceptive under three conditions:
- A known macro event is coming. An FOMC decision, major earnings, or a geopolitical flashpoint means the VIX is already pricing risk it has not yet experienced.
- Realized volatility has been suppressed. A recent stretch of calm makes the gap look structurally wider than it really is.
- Short-vol positioning is crowded. When too many traders are on the same side, the unwind itself becomes the catalyst.
The recent FOMC episode fits the first pattern precisely. The VIX near 17-18 against realized volatility around 9 was attributed to FOMC and oil market uncertainty, not to a mathematical mispricing waiting to be exploited.
Analysts who track this closely are blunt about its limits. GlobalMarketStructure warns that the implied-realized gap “is not a standalone market forecast, trading signal, guaranteed edge, or complete market-stress reading.” VolRadar adds that the premium can flip negative suddenly during shocks, and that a positive reading guarantees nothing without regime analysis alongside it.
So the honest read for you is this. A wide VIX-to-realized spread does not tell you the market has made an error. It tells you the market is nervous about something specific it has not lived through yet, and that context matters far more than the number.
Reading the volatility plumbing before the next big expiration
You now have the pieces to read the volatility machinery rather than just watch the VIX tick. Three habits turn that into a repeatable skill.
- Read the spread in context. Compare the VIX-to-realized gap against the long-run average of 4.2 points, and never treat a wide reading in isolation.
- Check the expiration calendar. Know where the next major OPEX falls and what the open interest looks like around key strikes, because that positioning shapes near-term price behaviour.
- Identify the driver. Ask whether a wide gap is powered by a known macro event or by structural premium alone. The answer changes everything about how much weight to give it.
The events worth tracking most closely are the quarterly triple-witching cycles in March, June, September and December. SpotGamma and GEXMetrix estimate these carry roughly three to eight times the structural impact of ordinary months, with the clearest pinning beforehand and the most vulnerable window (3-5 days as 20-40% of positive gamma rolls off) afterwards.
Keep the long view in mind as you do it. Over time, the VIX will almost always read above subsequent realized volatility, because that gap is the price of insurance and the compensation for jump risk in a market where catastrophic events do, occasionally, happen. It is a recurring feature, not an anomaly to be arbitraged away.
For readers wanting a practical framework for combining these signals in real time, our full explainer on reading volatility signals together covers the mosaic method, tracking VIX level, term structure slope, the realized-implied spread, and dealer gamma positioning as a combined system rather than as competing single-factor narratives.
This article is for informational purposes only and should not be considered financial advice. Investors should conduct their own research and consult with financial professionals before making investment decisions.
Past performance does not guarantee future results, and any discussion of volatility strategies is subject to market conditions and various risk factors.