While Bitcoin soaks up most of the retail attention, three mid-cap altcoins are sitting at precise decision points on their charts right now. NEAR Protocol is stretched into an overbought reading below a measured-move target. Zcash is stairstepping through a breakout with a clean support ladder beneath it. Hyperliquid is pressing against a channel midpoint that keeps rejecting it.
This matters because the current altcoin cycle is unusually compressed. The average rally has contracted to roughly 19-20 days, which means these technical setups resolve faster than they used to and the cost of getting the timing wrong is higher.
That speed rewards one skill above the rest: reading chart structure clearly. Fundamentals tell you what a project is worth over years. Technical setups tell you where the decision points sit this week.
Here is your chart-reading roadmap for these three assets right now. This guide maps each live setup with specific support and resistance levels, the reasoning behind each, and the exact price events that would confirm or invalidate every thesis.
What parallel channels, RSI, and measured moves actually tell you
Before you look at a single price level in the sections below, you need the three tools those levels are built on. Each one shows you something specific on the chart, and each one has a failure mode that trips up newer traders.
Here is the quick reference:
- Parallel channel: two sloping lines drawn from a high pivot and a low pivot that map a probable price corridor. Its limitation is that price frequently pierces the midpoint and then rejects, so a channel is a guide, not a guarantee.
- RSI(14): a momentum gauge running 0 to 100, with 70 flagged as overbought by convention. Its limitation is that in strong uptrends RSI can hold above 70 for weeks, so a single reading is not a sell signal.
- Measured move: a projection technique where a prior price range is duplicated from the breakout point to estimate a target. Its limitation is probability: upside measured moves complete only about 60% of the time, and downside moves about 43%.
The RSI point deserves a moment. Traders working in genuinely strong trends often shift their thresholds to 80/40 rather than the standard 70/30, precisely so they do not exit a powerful move too early. An RSI of 72 in a weak market and an RSI of 72 in a raging bull trend mean very different things.
These tools work because they map crowd behaviour. A channel line is respected because enough traders watch it. A measured move projects because ranges tend to repeat. Understanding that mechanism is what lets you read the setups below critically rather than taking any number on faith.
RSI divergence signals carry a meaningfully different statistical weight than simple threshold readings: a 2024 academic study found RSI divergence at structural confluence levels achieved an 87.61% success rate across three eight-year windows, which is why the ADX-RSI combination for NEAR carries more weight than the overbought reading alone.
The channel midpoint as the pivotal battleground
The 50% level of a parallel channel is where the fight concentrates. Both sides of the market use it as a reference: bulls defend it as support, bears target it as resistance, and that shared attention makes it the most reactive level inside the channel.
History shows how decisive it can be. Ethereum reacted sharply at its $2,700 channel midline, and Solana failed to reclaim its midpoint near $295.83, a failure that opened the door to deeper corrective pressure. When an asset pierces the midpoint but cannot hold it as support, it frequently rejects back toward the lower trendline. Keep that in mind for Zcash and Hyperliquid below.
When big ASX news breaks, our subscribers know first
NEAR Protocol’s overbought RSI and the measured move to $3.87
NEAR has moved hard. The asset has advanced strongly off lows near $1.60 and is now trading in the $2.34-$2.43 range, sitting well above its 50-day moving average near $1.88. That is the structure of a real trend, not a random bounce.
Here is the tension you need to read. The daily RSI(14) sits between 67 and 70.8, brushing the overbought line, while the ADX (Average Directional Index, a measure of trend strength) reads 52.24. Those two numbers together tell a specific story.
An ADX above 50 places NEAR Protocol in the top tier of trend strength, a reading that historically sustains upward momentum even as RSI signals short-term stretch.
An ADX above 50 confirms the move is genuine, not noise. But an RSI approaching 70 suggests the asset has earned a pause. The highest-probability read here is not an immediate reversal and not an immediate breakout; it is consolidation near $3.00 while the trend digests its recent gains.
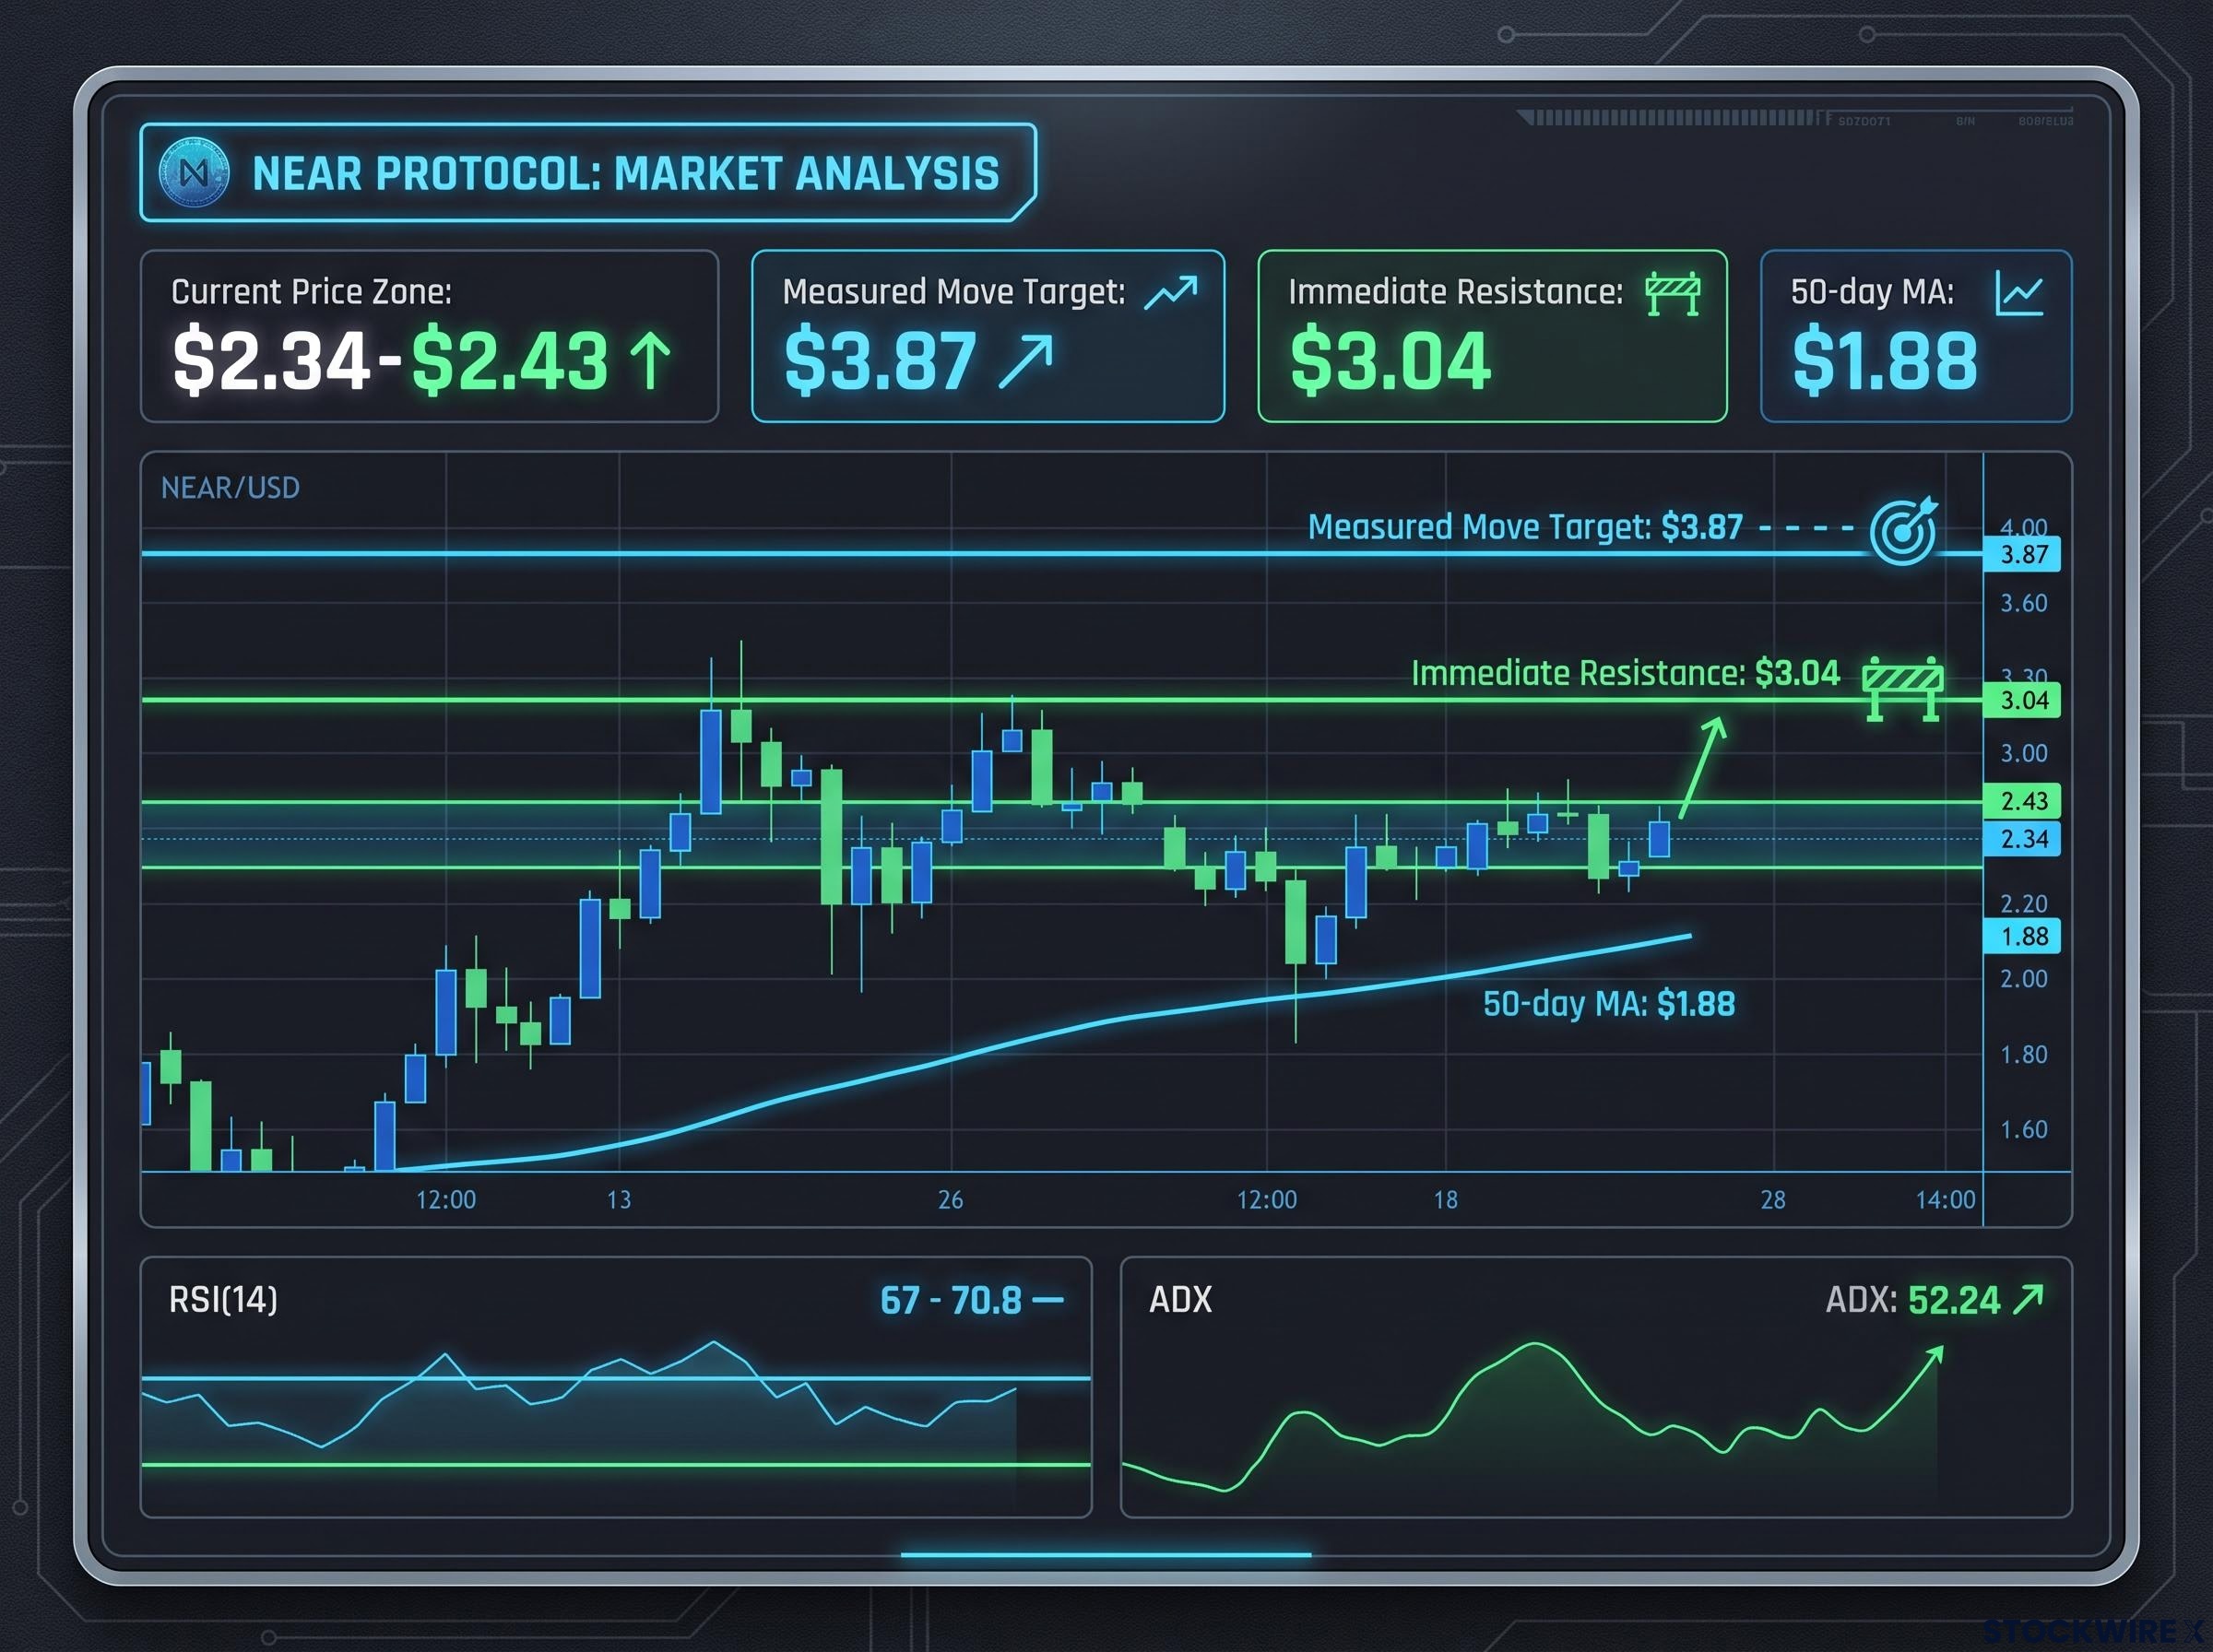
The key levels frame the decision cleanly.
| Level | Price | Type | Significance |
|---|---|---|---|
| 50-day MA | $1.88 | Support | Trend floor |
| Pullback support | $2.34-$2.43 | Support | Retrace zone |
| Immediate resistance | $3.04 | Resistance | Weekly pivot |
| Measured move target | $3.87 | Target | Pattern projection |
The critical distinction for you is between $3.04 and $3.87. The $3.04 level, a prior weekly pivot, is the resistance that must be cleared and held first. Only after a confirmed break above it does the measured move toward $3.87 become the active target.
Chasing the $3.87 number before $3.04 confirms is the mistake to avoid. The statistics say a strong overbought trend needs to breathe, and buying the extension before the confirmation is one of the costliest errors in momentum trading.
Zcash’s stairstep breakout and the pullback support ladder
Zcash has not moved in a straight line, and that is the point. It has climbed in a stairstep pattern: a sequence of consolidations and breakouts, each one a rung on the ladder rather than an isolated event. Reading it as a progression is what lets you plan around it.
Here is the sequence that got ZEC to where it is:
- Channel containment: ZEC traded inside a defined parallel channel from September 2025, building energy through a multi-month base.
- Initial breakout: price broke above the channel’s upper boundary, escaping the containment phase.
- First consolidation: rather than running vertically, it paused and built a new base before pushing higher, the first clear stairstep rung.
- Current price discovery: ZEC now trades between $1,189 and $1,377, having tagged an intraday high near $1,495.
Solana wrote this template earlier, stairstepping from a $10 bottom to consolidate at $25, then $35, then $45. Sequential consolidations are the signature of the pattern, and ZEC is following it.
The value of recognising a stairstep is that you can map the support ladder before any pullback arrives.
| Support Level | Price Zone | Structural Basis |
|---|---|---|
| First support | $1,294-$1,300 | Prior consolidation range top |
| Second support | $1,231 | Lower parallel channel boundary |
| Third support | $1,170 | Secondary support floor |
| Conservative hold | $1,000 | Historical channel top |
Here is what that ladder tells you. A pullback from these elevated levels is not a thesis-breaker; it is a normal feature of stairstep patterns. The level at which price stabilises is the information that matters, because it reveals whether the breakout structure is holding or quietly failing.

That is the difference between reacting to red candles emotionally and making a structurally informed call. If you already know $1,294, $1,231, $1,170, and $1,000 are the rungs, a pullback becomes a decision point about whether to hold, add, or step aside, not a panic.
Hyperliquid’s midpoint rejection and the probability-weighted setup
Hyperliquid has one of the strongest fundamental stories in decentralised trading. The numbers are hard to argue with: $633 billion in perpetual volume in Q1 2026, which is 32% of all on-chain perpetual futures volume, and $4.15 trillion in cumulative all-time volume. Its buyback-and-burn mechanism directs 99% of protocol revenue to an Assistance Fund.
That is a genuinely compelling business. The chart, though, is telling a more cautious near-term story, and the gap between the two is exactly what you need to weigh.
HYPE has traded within an upward-sloping parallel channel for most of its history, currently sitting at $80-$82.43. The channel’s 50% midpoint maps to $84.27, the high of the September 10th candle, and that level is now acting as the ceiling. After pushing above the midpoint, the asset formed a bearish consolidation pattern, a structure that has historically preceded downward moves in HYPE.
Bearish consolidation patterns that form after a midpoint resistance rejection carry documented completion rates well above the baseline 52.8% win rate for chart patterns generally, but only when volume filters confirm the formation, which is why the structure HYPE printed above $84.27 warrants watching rather than dismissing as noise.
HYPE’s RSI near 52.79 is the definition of an uncommitted market, neither overbought nor oversold, waiting for the midpoint resistance question to resolve before choosing a direction.
The full structure lays out where the battle lines sit.
| Level | Price | Direction | Context |
|---|---|---|---|
| All-time high | $89.50 | Resistance | Structural ceiling |
| Resistance cluster | $83.41-$88.13 | Resistance | Heavy supply zone |
| Midpoint resistance | $84.27 | Resistance | Channel 50% level |
| Lower channel boundary | $82.40 | Support | Rising trendline |
| Primary support | $78.58 | Support | First defence |
Below primary support at $78.58, the ladder continues to secondary support at $65.92 and tertiary support in the $61.75-$60.61 zone. The probability-weighted path here favours a rejection at the midpoint and a move toward the lower boundary, not a breakout to new highs.
The token unlock overhang
There is a supply-side complication stacked on top of the resistance. A $1.2 billion token unlock, roughly 14.18 million tokens or about 1.4% of supply, occurred near recent highs, with a significant portion distributed to insiders.
Why does timing matter so much here? Insiders receiving tokens near an all-time high have a strong incentive to sell into any strength, which increases sell-side pressure exactly where the chart already shows heavy supply.
At 1.4% of supply, this unlock is not catastrophic on its own. But its timing and insider concentration make it a compounding headwind layered directly on the midpoint resistance, and a position thesis that ignores this distribution risk is incomplete.
Managing risk when setups resolve against you
Every setup in this guide is a probability statement, not a prediction. Roughly 40% of upside measured moves fail to complete, which means you need a plan for the cases where the chart goes against you, not just the cases where it cooperates.
The core risk-management act is simple: define the price level that proves you wrong before you enter, not after. Each of these three setups has one.
Take NEAR. An RSI approaching 70 with a strong ADX can keep climbing, so overbought alone is not your exit. But if NEAR rejects back below the $2.34 support zone on heavy volume, the measured move thesis toward $3.87 is off the table, not merely delayed.
The pattern setups work the same way. A ZEC close below $1,170 on meaningful volume would signal the stairstep is breaking down. A HYPE close and hold above $84.27 would invalidate the midpoint rejection thesis and open the door to the $88-$89.50 resistance cluster.
There is also a confirmation rule for channel breakouts worth holding onto: a valid breakout needs a candle close outside the channel boundary accompanied by volume above the 20-period average. Without that volume, a breakout is suspect.
Volume confirmation on breakouts is the filter that separates genuine channel escapes from fakeouts: valid moves typically require volume at least 1.5 to 2 times the 20-day average on the breakout bar, a threshold the article’s confirmation rule for NEAR’s $3.04 level directly reflects.
A measured move target is a zone to plan around, not a guaranteed destination. The roughly 40% of cases where targets do not complete are just as important to your strategy as the 60% that do.
Here are your three invalidation levels in one place:
- NEAR: rejection below $2.34 on volume kills the measured move.
- ZEC: a close below $1,170 signals the stairstep is failing.
- HYPE: a close and hold above $84.27 flips the rejection thesis bullish.
Defining your exit before you enter is what separates a structured approach from chart-reading as entertainment. It is also the difference between managing a drawdown and simply enduring one.
This article is for informational purposes only and should not be considered financial advice. Investors should conduct their own research and consult with financial professionals before making investment decisions.
Past performance does not guarantee future results. Financial projections are subject to market conditions and various risk factors, and technical setups are speculative and subject to change based on market developments.
Where each setup stands and what to watch next
You now have three setups and three specific triggers to watch. Here is where each one stands right now, distilled to what actually matters.
| Asset | Current Price Zone | Key Resistance | Critical Support | Thesis-Changing Event |
|---|---|---|---|---|
| NEAR | $2.34-$2.43 | $3.04 | $2.34 | Break of $3.04 on volume |
| ZEC | $1,189-$1,377 | ~$1,495 | $1,170 | Close below $1,170 |
| HYPE | $80-$82.43 | $84.27 | $78.58 | Hold above $84.27 |
NEAR Protocol
Consolidation near $3.00 is the base case, with RSI and ADX both arguing for patience over urgency. Your trigger is a confirmed break of $3.04 on volume, which activates the $3.87 measured move, while a rejection below $2.34 takes the thesis off the table.
Zcash
The stairstep structure stays intact as long as price holds above $1,170, and the support ladder below is defined and ordered down to the conservative $1,000 base. Patience here is rewarded with clarity: each level either holds or breaks, and both outcomes tell you something.
Hyperliquid
Midpoint rejection is the probability-weighted read, with the $1.2 billion insider-heavy unlock adding near-term distribution pressure. A hold above $84.27 is the single signal that would flip the thesis bullish; short of that, the lower channel boundary and $78.58 are the levels to watch.
In a cycle where altcoin rallies average just 19-20 days, these setups are likely to resolve inside a compressed window. That makes the next few weeks a high-information period across all three, and you now have the exact price events to watch for rather than a vague sense that something is happening.
For readers wanting broader macro context around why altcoin cycle compression has accelerated in 2026, our dedicated guide to sector rotation signals examines how institutional capital repositioning between risk-on and risk-off sectors tends to precede crypto sentiment shifts by several weeks.