
Most retail traders can draw a line on a chart. What separates them from the professionals watching the same chart is knowing which lines are actually worth trusting, and why price keeps returning to zones everyone else has already forgotten about.
The stocks in this piece, Meta, SpaceX, KBH, SoFi, GEV, Circle, and LIT, are being used here as live teaching instruments. Each one is sitting at or near a technical level that traders are actively watching as of mid-September 2026, which makes this a practical read rather than a theoretical one.
After this, you will have a working method for spotting the five types of structural evidence that matter most. You will understand why price returns to unfilled gaps and multi-touch trend lines. And you will know exactly what separates a disciplined trade entry from an optimistic guess.
What professional traders actually mean when they “read” a level
Here is the assumption you probably arrived with: reading a level means drawing a horizontal line at a price, usually a round number or a prior high, and treating it as a place to buy or sell. That instinct is where most retail traders stop. It is also why most of them get chopped up.
Reading a stock chart correctly starts with understanding that every indicator overlaid on it is simply a different interpretation of the same historical price and volume data, not a forecast, which is why the structural evidence framework in this article depends on identifying what the chart has already recorded rather than predicting what it will do.
Professionals do not treat a level as a single price. They treat it as a zone, and they only give that zone weight when several independent pieces of structural evidence converge on it.
A level earns its credibility through repetition. Price has visited that zone before, was rejected or supported there, and left behind a structural fingerprint that both algorithms and human traders reference the next time price approaches.
Take Meta as the anchor. Its 638-640 zone is not meaningful because it is a nice round area. It carries three distinct structural elements: a reclaimed trend line, a prior week low, and an established pivot support. Three separate reasons for buyers to defend that price.
Compare that to GEV, which ran into resistance right at its 924-925 range. That was not a coincidence of price. That zone coincided with a filled prior gap, and the completion of the gap fill acted as a natural stopping point for the rally.
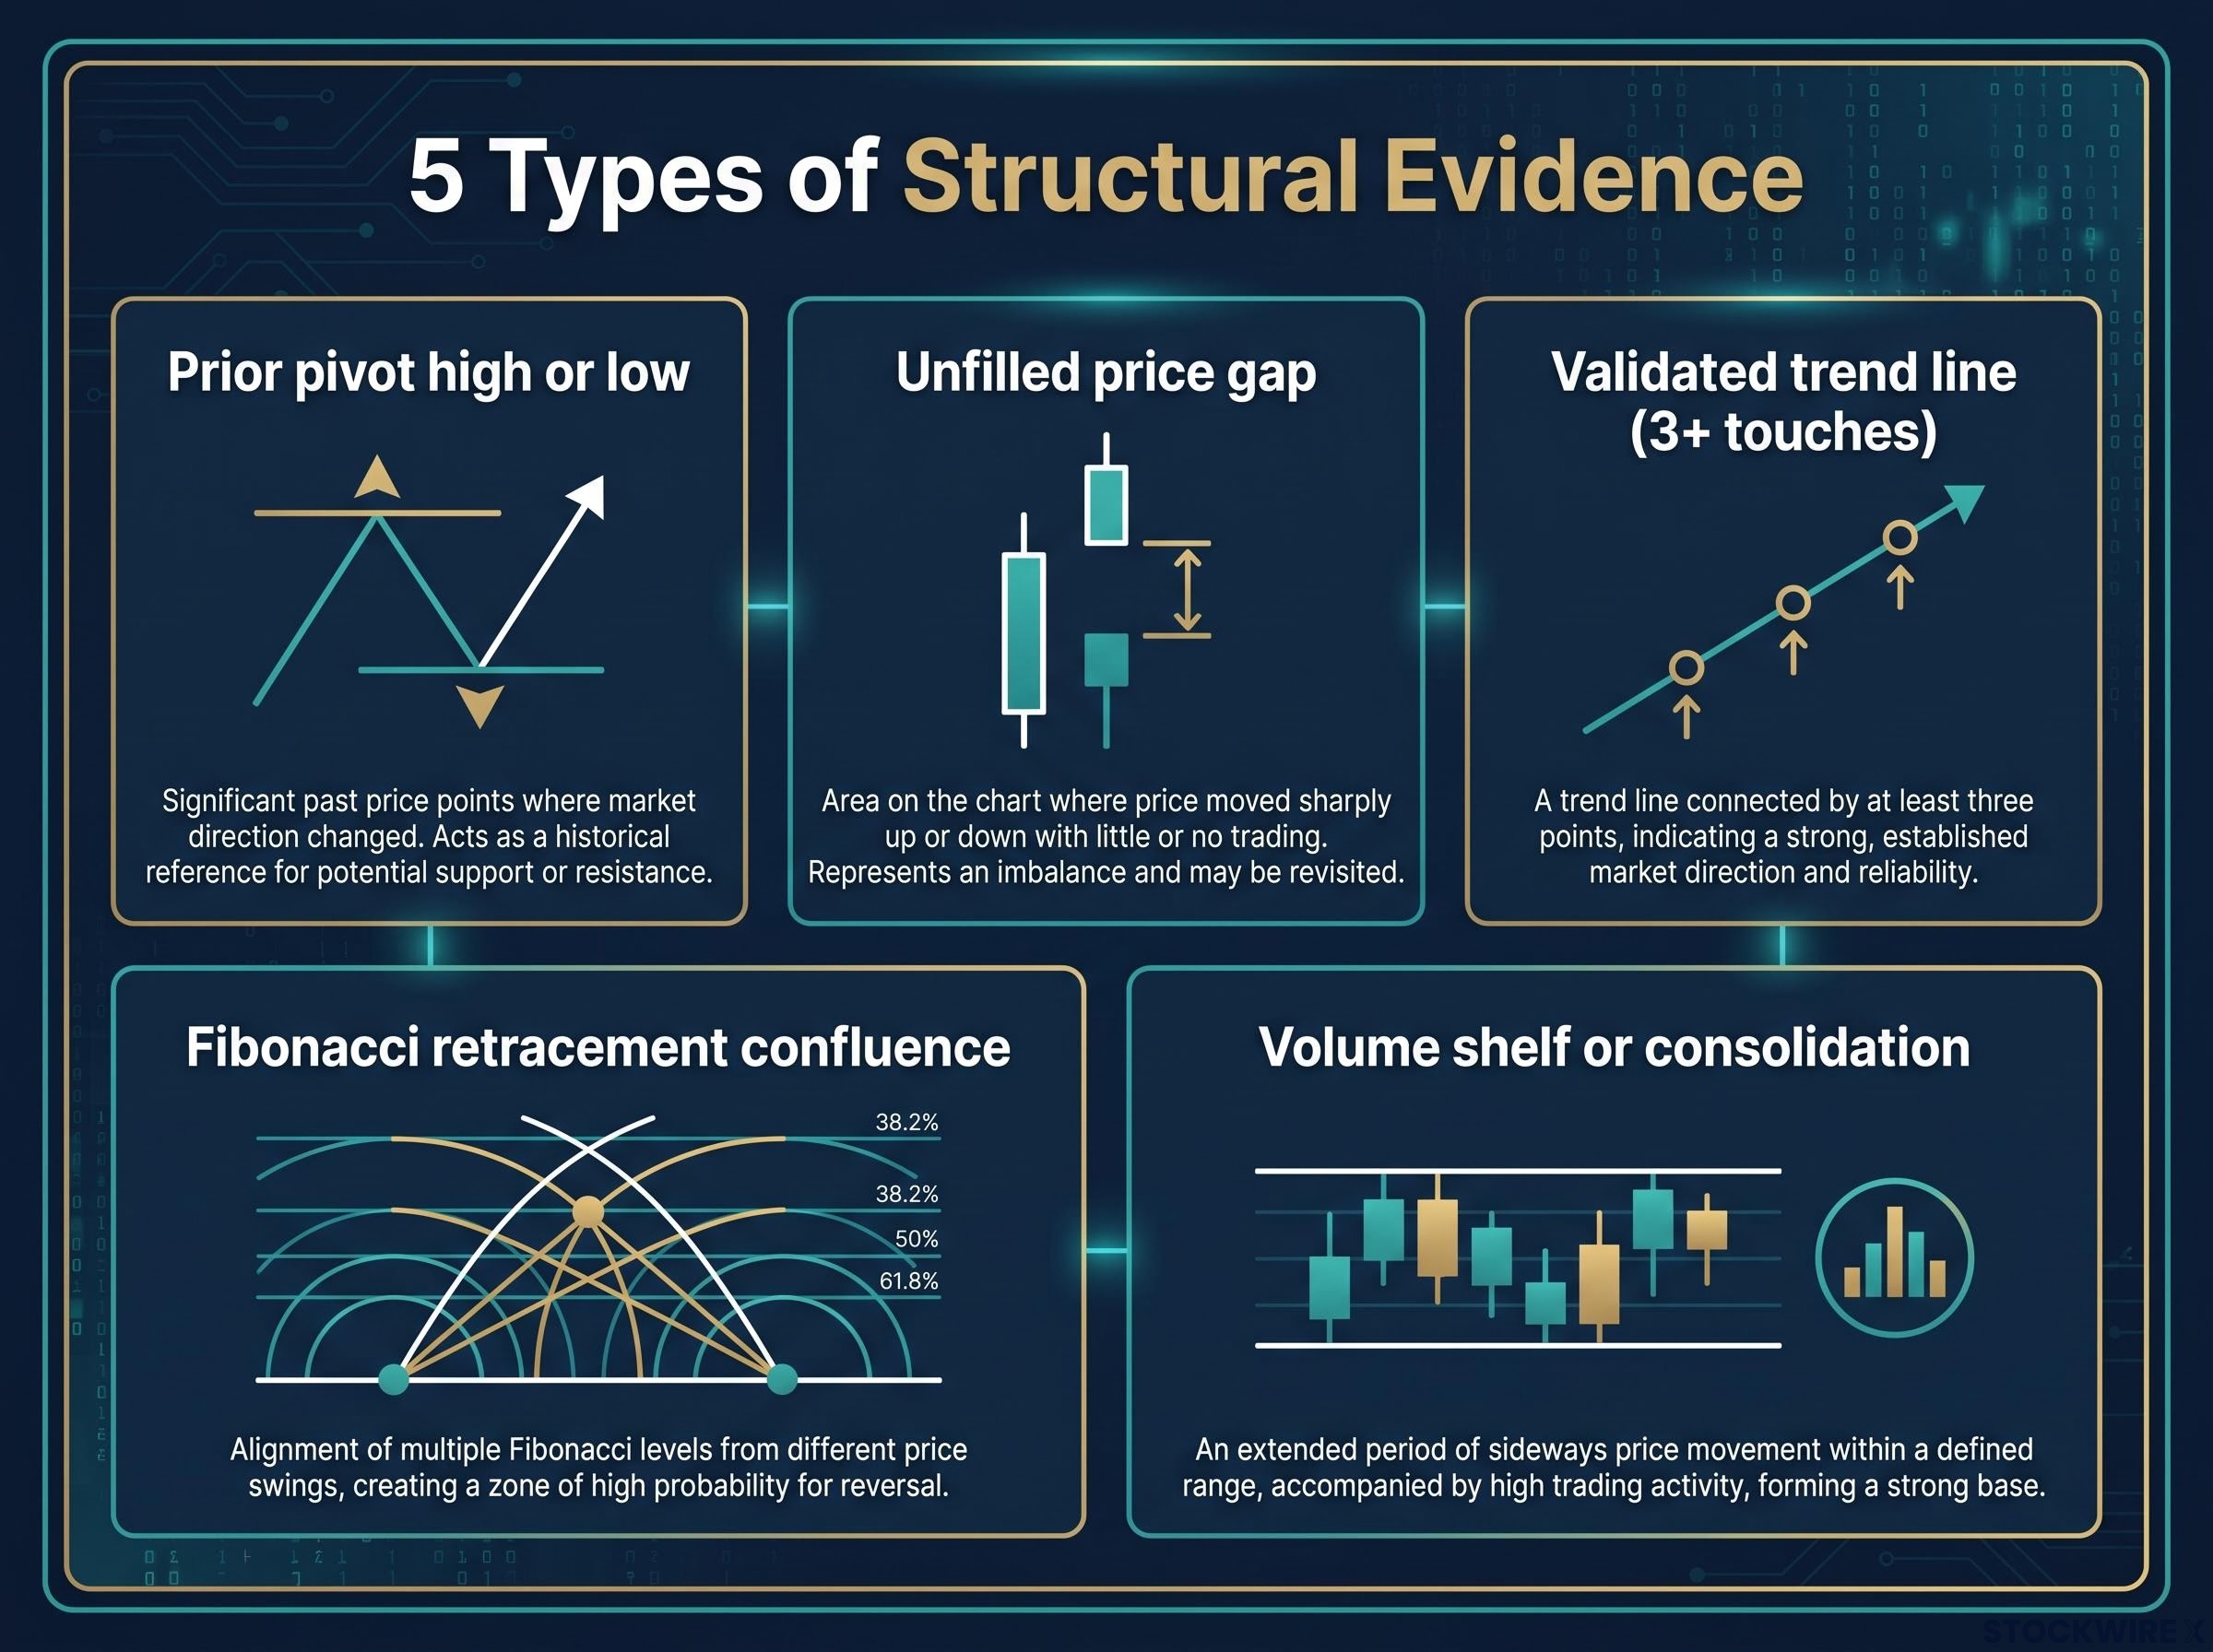
The five types of structural evidence that can back a level are worth committing to memory:
- A prior pivot high or low, where price previously reversed
- An unfilled price gap, a blank space where no shares traded
- A validated trend line with three or more touches
- A Fibonacci retracement confluence, a mathematical level derived from a prior move
- A significant volume shelf or consolidation zone, where heavy trading concentrated
The practical takeaway is blunt. If you cannot name at least two independent structural reasons why a level matters, you are not trading a setup. You are trading an opinion.
Why confluence is the professional’s edge
Confluence is the word professionals use when multiple independent tools point to the same narrow zone. Each tool that lines up multiplies the probability that the level actually holds.
Meta gives you the concrete illustration. Its 685-690 resistance zone is backed by both a swing pivot and a 61.8% Fibonacci retracement sitting in the same tight band. Two unrelated methods flagging the same price is a far stronger signal than either one alone, and that is the shift that changes how you read every chart from here.
When big ASX news breaks, our subscribers know first
How unfilled gaps become price magnets, and how to use them
Picture a candlestick chart with a visible blank space where no candle bodies overlap. That gap is a range of prices where no shares actually changed hands, created overnight by news or an extreme imbalance in buy and sell orders.
Two forces pull price back to that empty space. The first is mean reversion: once the news impulse that caused the gap fades, price tends to drift back toward what the broader market considers fair value.
The second is liquidity theory. Modern institutional order-flow models treat unfilled gaps as zones where price discovery was left incomplete, so order flow gets drawn back to fill in the missing trades and restore balance before a trend continues.
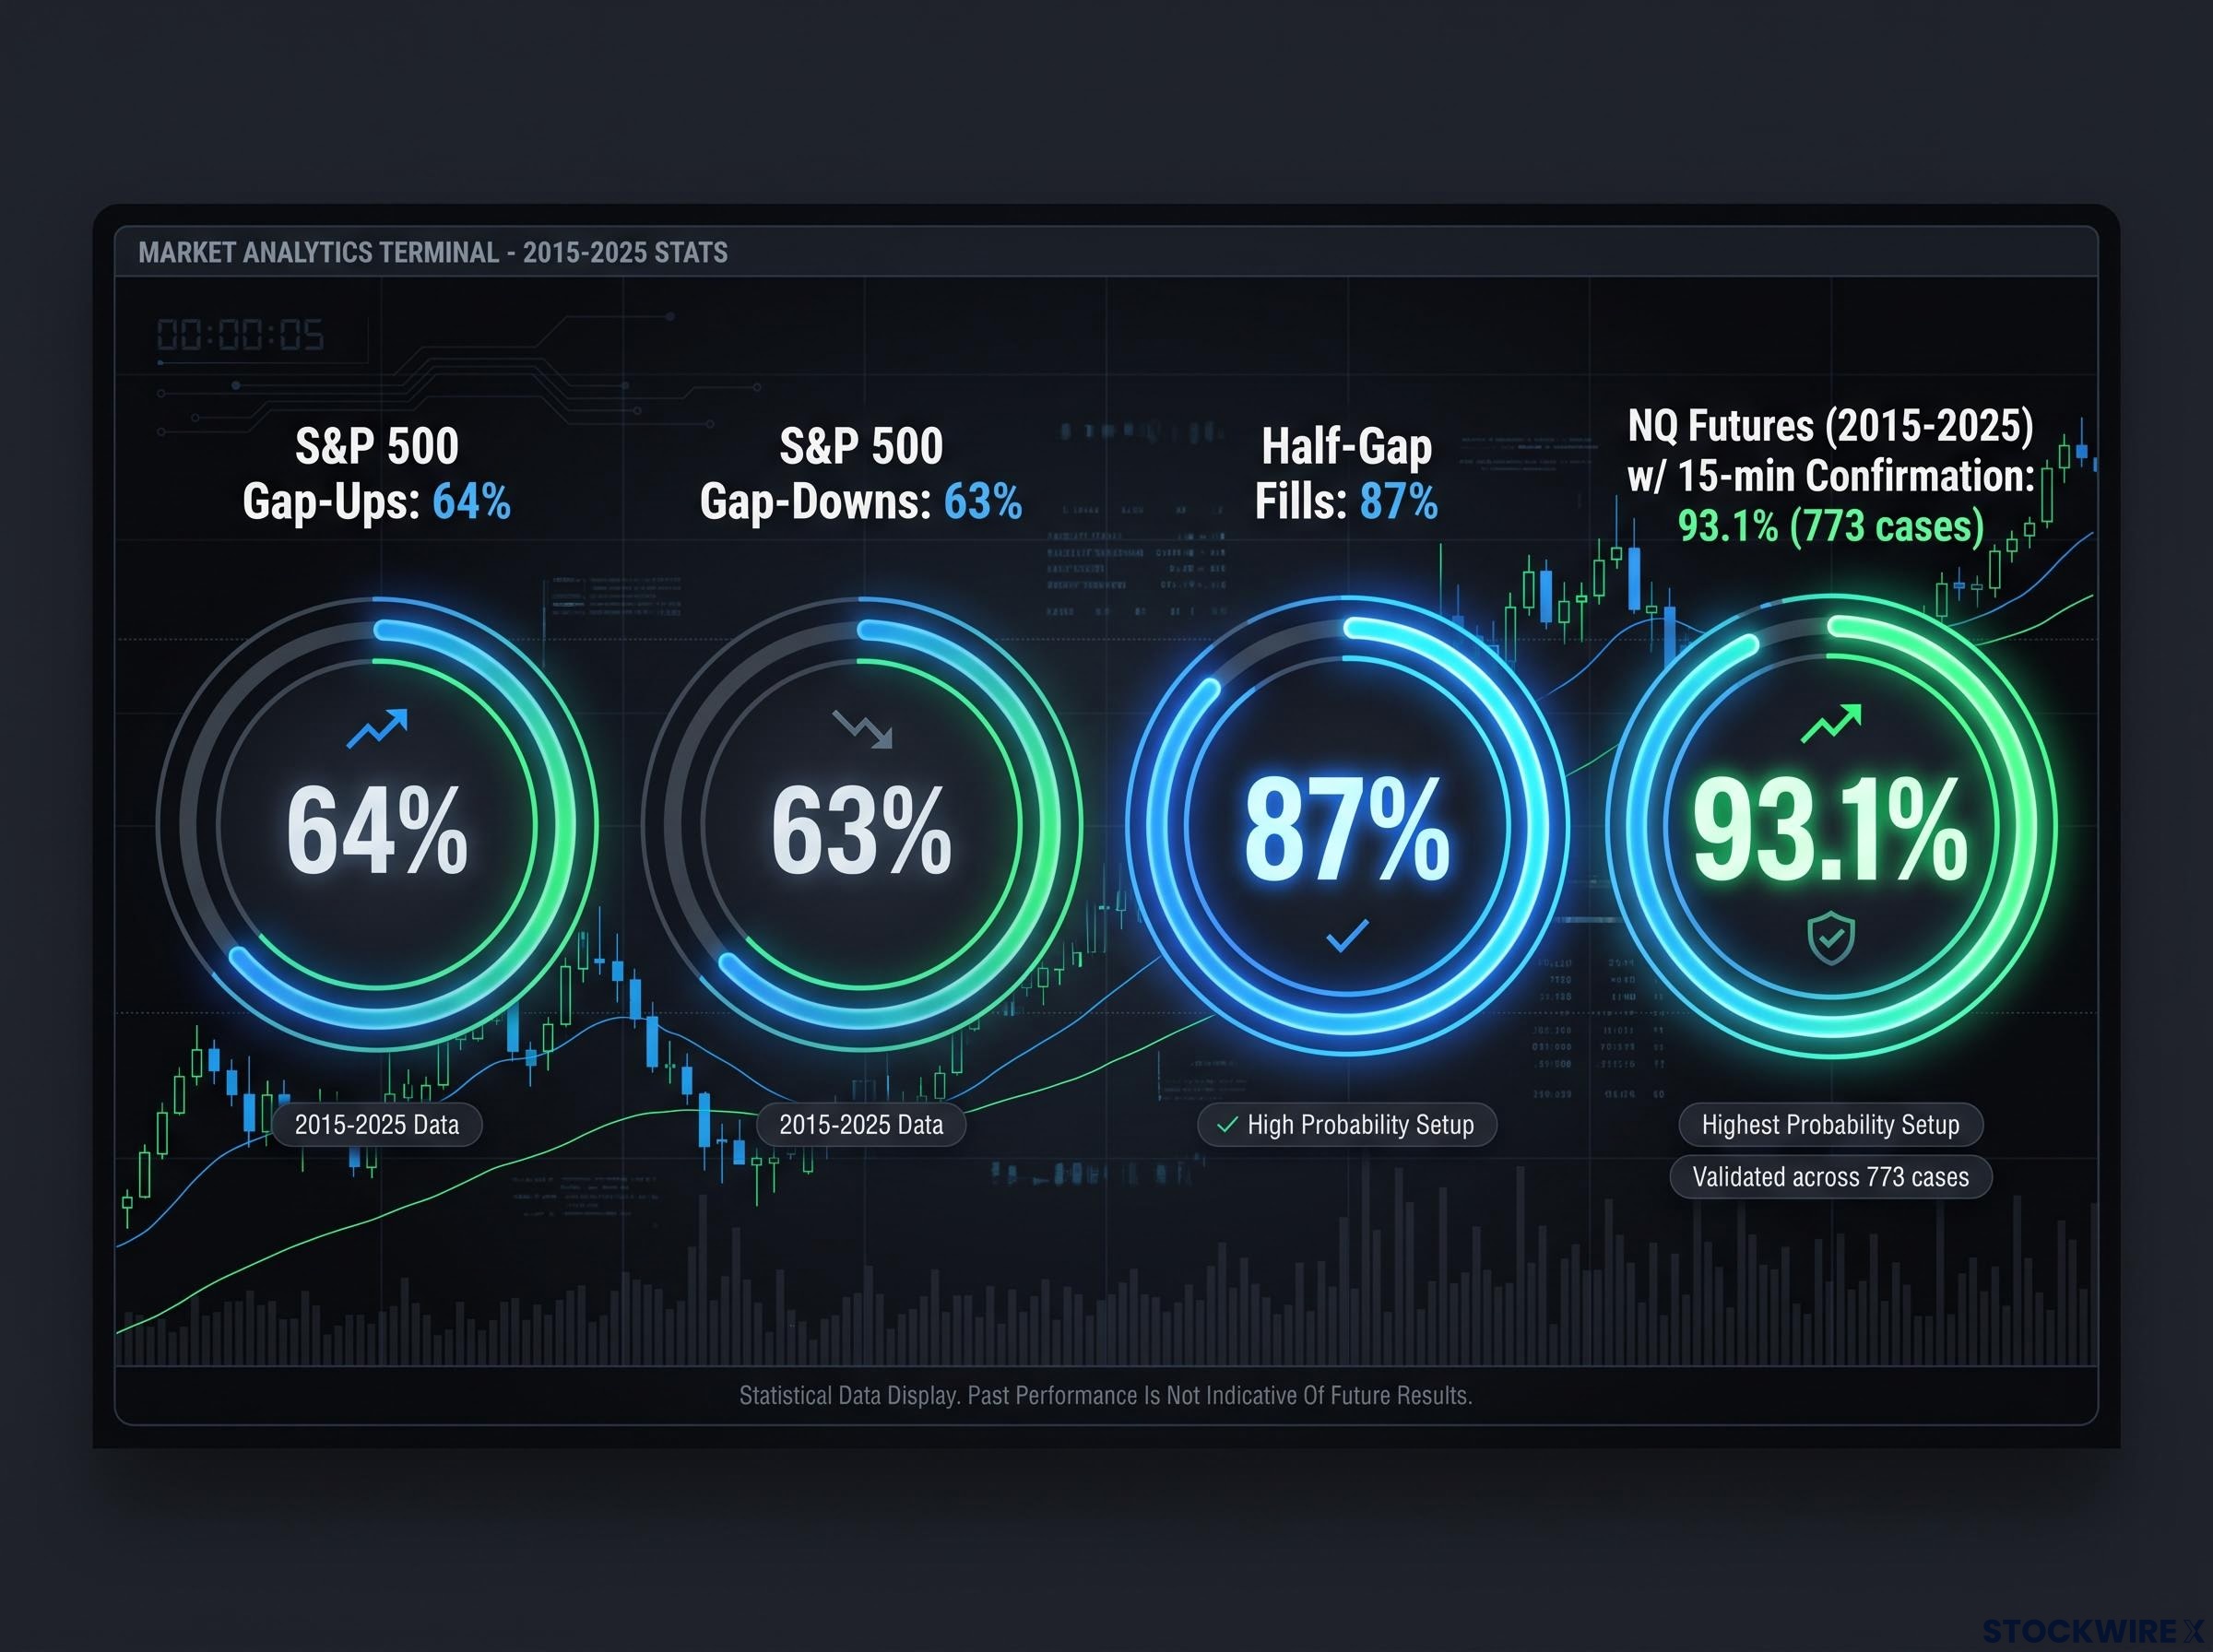
This is why the fill-rate statistics hold up. In S&P 500 futures, gap-ups fill 64% of the time and gap-downs fill roughly 63%. Half-gap fills, where price retraces 50% of the way back toward the prior close, reach an 87% fill rate in some studies.
Gap-filling analysis documents fill rates as high as 93.1% under specific conditions, with context (breakaway versus common gap, volatility regime, and first-candle direction) determining whether a void is a reliable magnet or a low-probability fade.
The most actionable figure to remember Half-gap fills reach an 87% fill rate in some studies, making the 50% retracement level one of the most reliable near-term targets you can set.
The confirmation angle sharpens this further. A multi-year study of NQ futures from 2015-2025 found that tiny gaps paired with early directional confirmation in the first 15-minute candle achieved a 93.1% fill rate across 773 cases.
Across the setups in the research, gaps show up again and again as structural destinations rather than random artefacts.
| Stock | Gap Price Level | Gap Type | Current Price Context | Setup Implication |
|---|---|---|---|---|
| Meta | ~738.31 | Resistance target | Trading near $673 | Backs the 730-740 swing short zone |
| SpaceX | ~160.42 | Resistance target | Recovering from pullback | Next primary upside target |
| KBH | ~58.59 | Resistance target | Trading near $48.67 | Anchors the swing short zone |
| SoFi | ~16.31 | Support target | Testing 16.61 pivot | Downside scalp if 16.61 breaks |
| LIT | ~927.03 | Support target | Below current price | Near-term day trade scalp target |
For you, this means the unfilled gaps on a stock you are watching are not noise. They are destinations that traders with far larger positions than yours have already built into their models, which is precisely why those zones tend to produce real reactions.
When gaps do not fill (and why the exception matters)
Gaps are a probability, not a guarantee, and the exceptions matter. Breakaway gaps, which occur when a strong fundamental trend accelerates, are far less likely to fill quickly than common or exhaustion gaps.
Price also frequently respects the edge of a gap without fully filling it, so treat the gap as a zone rather than a precise tick-level target. And gaps fade with time: older gaps carry less structural weight than recent ones, losing their magnetic pull as the market moves on.
The three-touch rule: when a trend line earns the right to be traded
Watch how a professional decides whether a trend line is real. It happens one touch at a time.
Two points create a hypothesis. Any two swing lows can be connected by a line, but that line proves nothing yet; it is just geometry.
The third touch is what confirms structural validity. When price returns to the same slope a third time and reacts, it tells you other participants are seeing and defending that line too, not just you.
SpaceX shows the accumulation cleanly. An upward-sloping trend line from the 14 July pivot has three confirmed touches, which establishes it as valid support, and a secondary ascending line has picked up three touches of its own since the recent low, building a series of higher lows.
Circle raises the bar. Its ascending trend line had four touches before it provided the bounce point after a roughly 5% pullback session. That fourth touch lifts confidence meaningfully above a bare three-touch line.
What a high-conviction structural break looks like Meta’s descending trend line had accumulated six to seven touches before price finally broke above it, which is why that breakout was a structurally significant event rather than a routine line clip.
Post-break, that same Meta line has flipped roles and now acts as reclaimed support in the 638-640 zone, the same area we mapped earlier through confluence.
Here is the validation process, reduced to three steps:
- Identify two significant swing highs or lows sitting at the same slope
- Draw the line and wait for a third touch at that slope, without nudging the line to force the fit
- Watch how price reacts at the third touch. A clean bounce or rejection confirms validity; a weak, indecisive reaction warrants caution
For you, a three-touch trend line on a name you are watching is not a drawing tool. It is evidence that order flow has repeatedly interacted with that price slope, which should change how much weight you give the level when price approaches it again.
Compare that to LIT, where a preliminary two-touch trend line anchors the swing short zone between 985 and 1,016. Two touches do not clear the bar. That makes LIT a watch-and-wait level, not a confirmed entry.
Dynamic versus static levels: why the slope matters
Static levels are fixed prices: a prior high, the edge of a gap. They sit at the same number every session.
Dynamic trend lines are different. They project a support or resistance price that moves with each passing session, so you have to recalculate where price meets the line every day.
GEV is the working example. Its long-term ascending trend line dates back to 30 July 2025 and projects support into the 844-845 range as of the analysis, a level that will keep climbing as the line advances. Two failure modes are worth flagging: lines drawn at unrealistically steep slopes break easily and throw false signals, and lines connecting intraday noise rather than genuine swing points only look valid.
Reading levels is only half the job: the execution layer that separates setups from trades
You can identify every level correctly and still lose money. Knowing where a level sits and being able to trade it are two different skills, and the gap between them is where most technically literate traders bleed out.
The most common execution error is treating a level as a precise, single-tick line rather than a zone. Place your stop exactly on that line and you hand it to the intraday wicks that routinely probe support and resistance before reversing.
The fix is structure-based stop placement. Your stop belongs where the trade thesis is invalidated, typically just beyond the far edge of the zone: a prior swing low or high, or the opposite boundary of an unfilled gap.
The professional standard adds a buffer of 0.3-0.5% beyond the structural level to absorb spread noise and minor probes, and some practitioners size that buffer using the Average True Range, a measure of a stock’s typical daily price movement.
Then comes the filter that governs whether the setup is worth taking at all: a minimum reward-to-risk ratio of 1.5:1, calculated before entry, never rationalised after it.
| Stock | Support Zone | Resistance Target | Implied Move | Stop Placement Principle |
|---|---|---|---|---|
| Circle | ~78.41 consolidation | 96-97 (gap + pivot + 78.6% retracement) | ~18 points | Below the 78.41 consolidation floor, with buffer |
| KBH | ~48.17 affinity | 57.55-58.59 (unfilled gap tops zone) | ~9-10 points | Below mid-$40s structural support, not at 48 |
Notice the KBH detail. A trader entering near 48 with a target near 57-58 has a measurable multi-point setup, but the stop belongs below the mid-$40s structural support, not exactly at the entry, because that is where the thesis actually fails.
The behavioural risk that undoes correct setups Confirmation bias is when a trader fixates on a gap fill or bounce target and ignores the disconfirming evidence: lower highs forming into a support zone, failing retests, or volume declining on the bounce.
Liquidity matters too. Deep, liquid names like Meta and GEV carry very different execution risk than smaller-float names, where bid-ask spreads widen and halt risk spikes on volatile sessions.
Volume confirmation adds a fifth independent data point to any structural level check: valid breakouts typically require at least 1.5 to 2 times the 20-day average volume on the breakout bar, and a level that holds or breaks on thin volume carries a materially higher rate of reversal than the same move with strong participation.
Run every setup through this pre-trade checklist:
- Identify the structural evidence backing the level, a minimum of two independent factors
- Define the zone boundaries rather than a single price
- Place the stop at the structural invalidation point, with a buffer
- Calculate the reward-to-risk ratio before entering, minimum 1.5:1
- Assess whether the name has enough liquidity for your intended position size
The professional edge is not finding the right level. It is defining, before you enter, exactly where the thesis fails, then sizing the position so that failure costs a predictable, limited amount.
The framework in practice: what to look for before the next trade
You now have three layers: how to identify a level, how gaps behave, and how to validate a trend line. The point is to fuse them into a single sequence you run on any chart, before you touch the buy button.
Run this before your next setup:
- Identify one primary level with at least two structural factors behind it: a prior pivot, gap, trend line, or Fibonacci confluence
- Map the next level in both directions, one as your target, one as your stop anchor
- Validate any trend line with a minimum of three touches before you give it weight
- Check for unfilled gaps within 5-10% of current price, which act as near-term magnets
- Calculate reward-to-risk before entry, and only proceed at 1.5:1 or better
No single level, gap, or trend line is a guarantee. The edge comes from stacking structural evidence and holding discipline on risk, not from predicting direction with certainty.
Macro catalysts fold into this too. The Circle setup was framed around a pending FOMC interest rate decision, and price often moves into a key zone ahead of such an announcement, then uses the technical level as the fulcrum for the reaction afterward.
The range of names covered, Meta, GEV, SpaceX, Circle, KBH, SoFi, and LIT, proves the framework is not stock-specific. It travels across market caps and volatility regimes, provided you adjust execution parameters for liquidity.
So your next move is simple. Open a chart you already watch, find one level with at least two structural factors behind it, and define the stop and target before you consider an entry. The questions matter more than the stocks: what is the structural evidence here, what are the targets in both directions, and where exactly does this thesis fail?
For readers who want a system to capture, grade, and archive setups like those in this framework before executing them live, our dedicated guide to building a professional trading playbook covers the exact journaling structure, annotated screenshot process, and pre-committed rule set that separates disciplined execution from reactive guesswork.
This article is for informational purposes only and should not be considered financial advice. Investors should conduct their own research and consult with financial professionals before making investment decisions. Past performance does not guarantee future results, and technical setups are subject to market conditions and various risk factors.