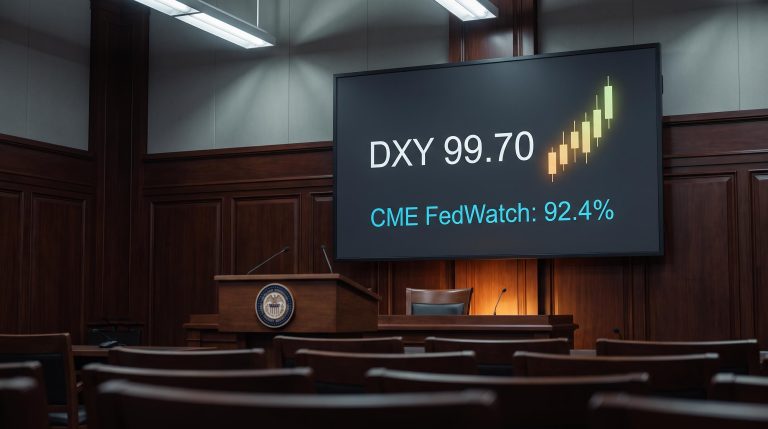
WTI crude above $100 per barrel, the S&P 500 losing grip on its support band, and Bitcoin sliding on a failed Senate vote: three assets, three distinct catalysts, and one question worth asking before the Federal Reserve makes its next move.
On the surface, these read as unconnected stories. Oil is jumping on Middle East supply fears, equities are grinding lower through their technical range, and Bitcoin just absorbed a regulatory blow the market had not fully priced. But the pattern is worth examining as more than coincidence, because all three moves share an underlying driver: investors recalibrating how much risk they want to hold as several uncertainties stack at once.
What follows breaks down each signal, how they connect through a common transmission mechanism, and what the pattern tells you about where risk appetite stands right now. You will finish with a framework for reading cross-asset moves, not just a summary of what happened.
What is pushing WTI crude past $100, and why it matters beyond the gas pump
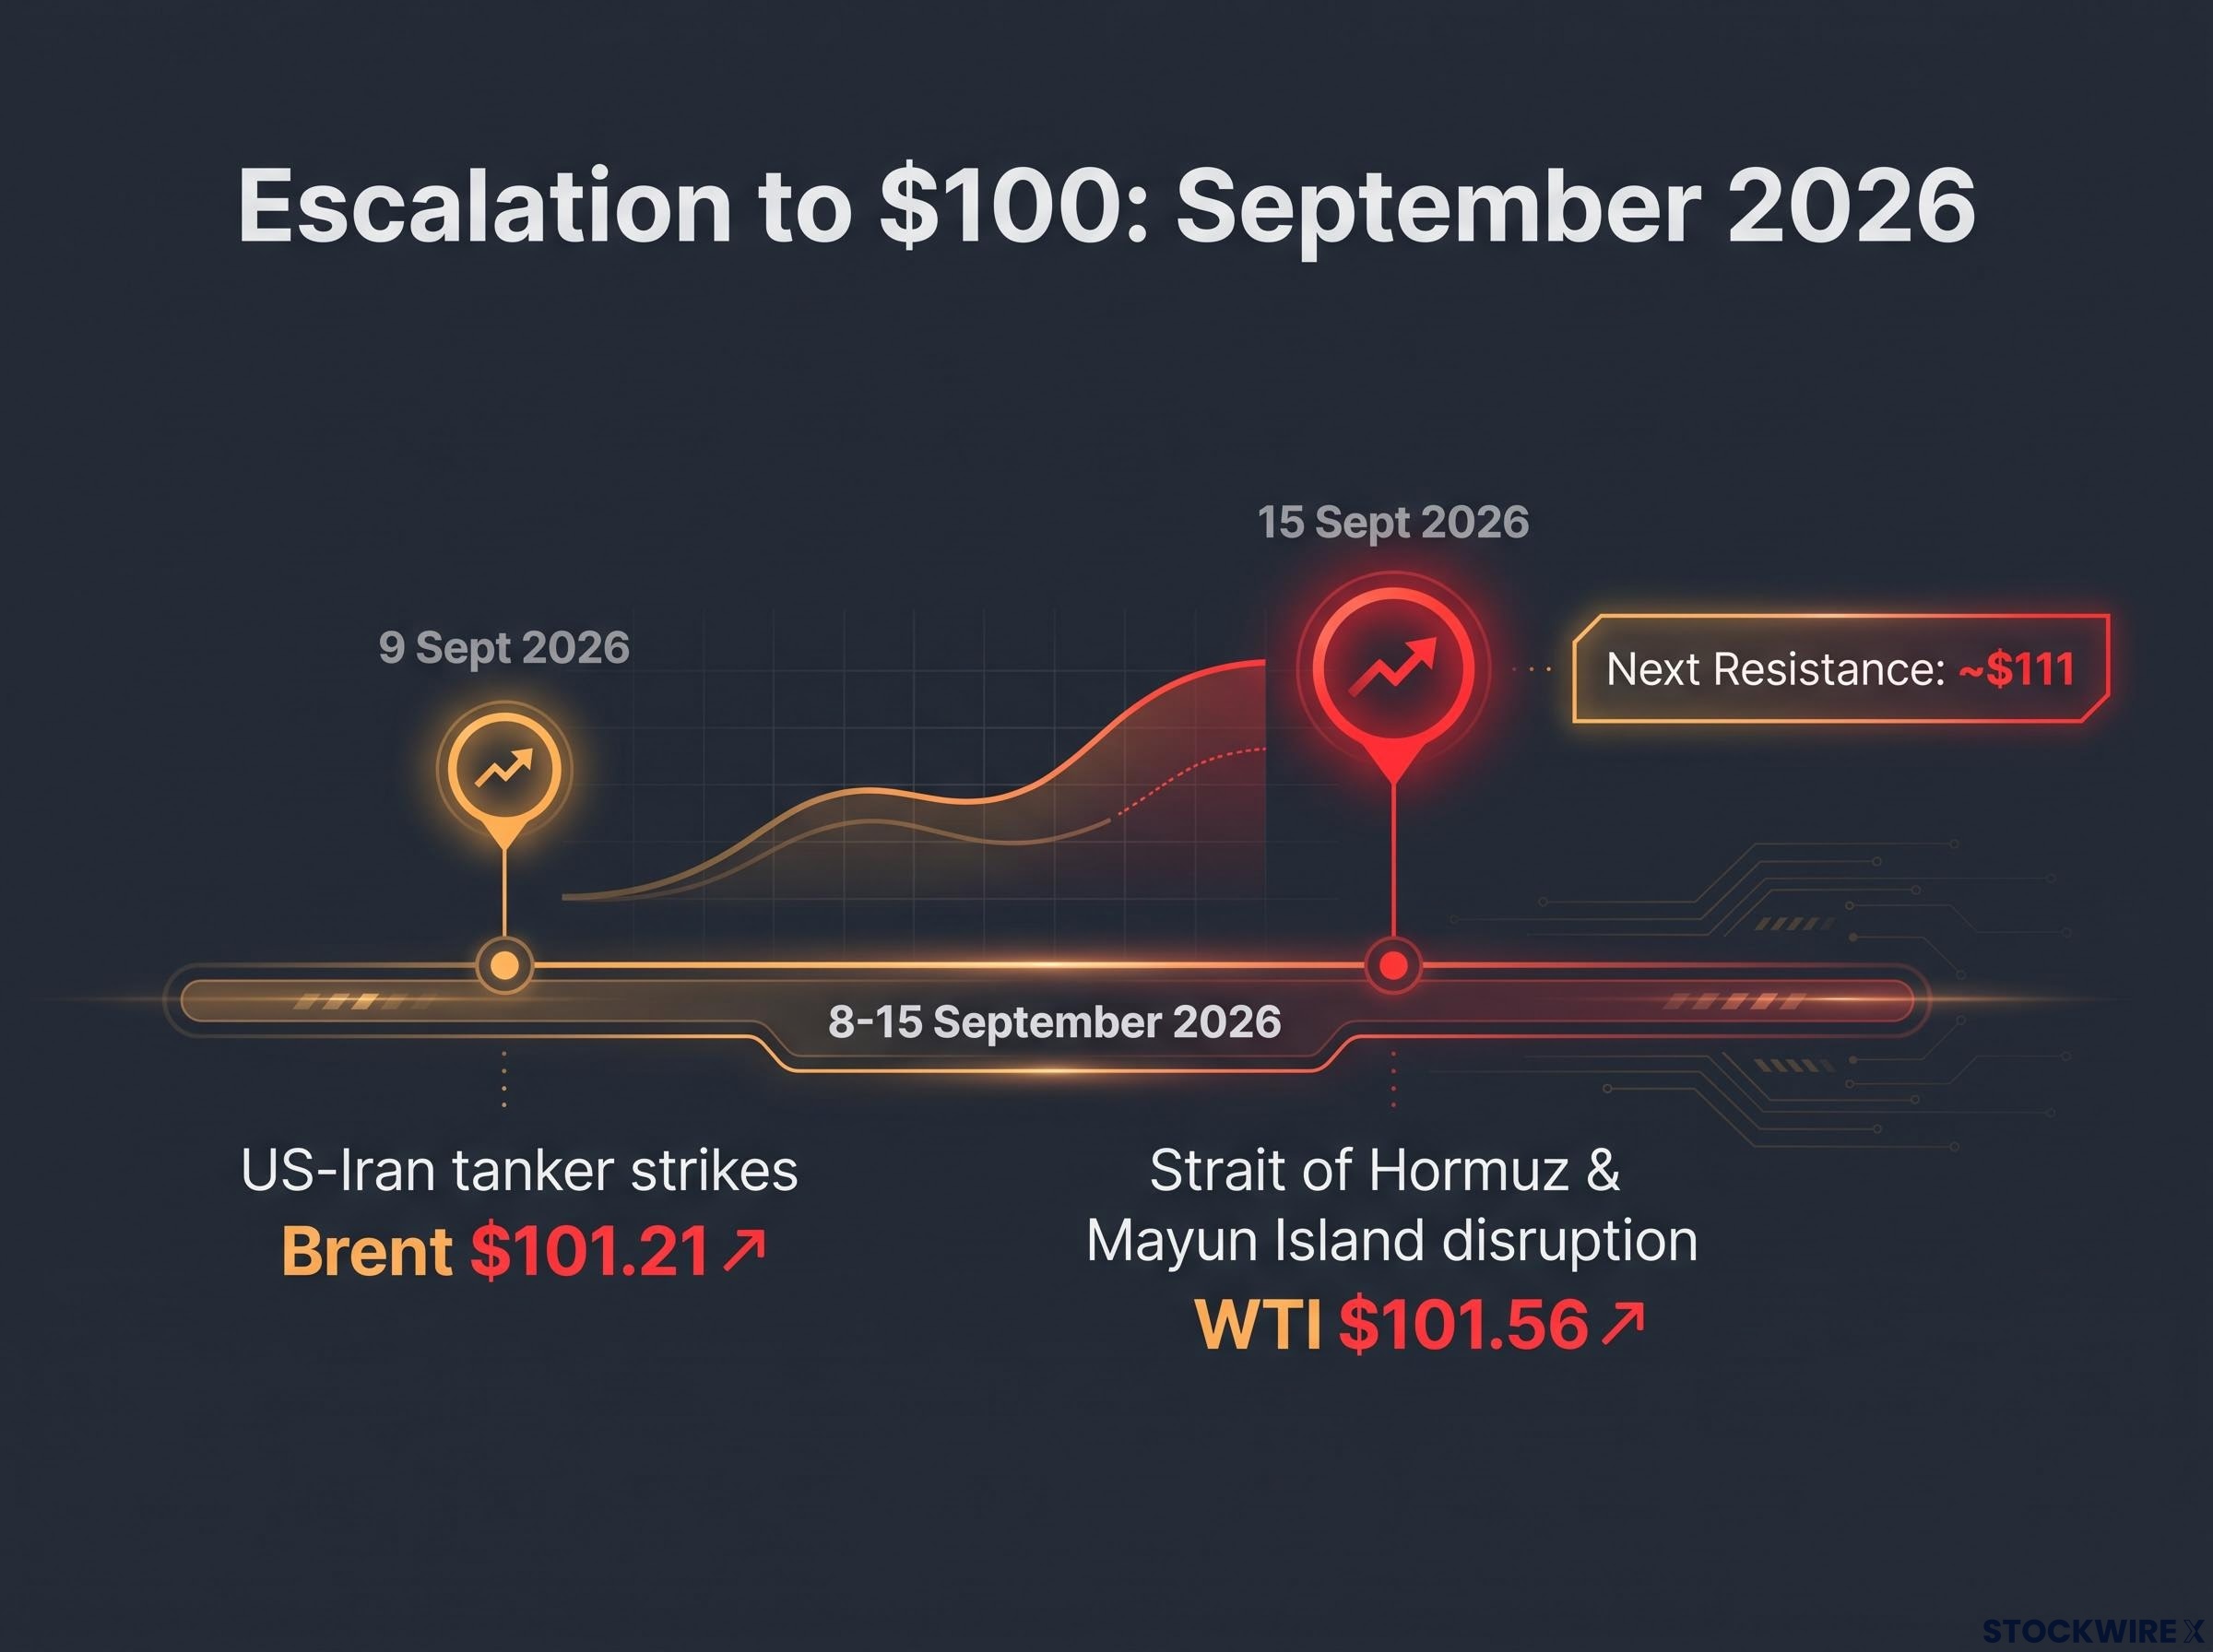
The move above $100 did not come from a single event. It built through a sequence of escalations across 8-15 September 2026, each adding an incremental supply-disruption premium to the price.
Three geopolitical catalysts drove the advance:
- US-Iran tanker strikes: Reuters reported from Houston that Brent settled at $101.21 on 9 September 2026 after Iran and the US struck tankers in the largest wave of attacks on shipping since the conflict began.
- Houthi attacks on Saudi energy infrastructure: the rally accelerated after Iran-backed Houthi strikes set Saudi installations ablaze, raising the risk of wider Gulf disruption.
- Chokepoint risk: Al Jazeera reported on 15 September 2026 that Brent held above $100 as fighting disrupted shipping through the Strait of Hormuz, with the Houthi capture of Mayun Island threatening the Bab al-Mandeb route.
Each incremental shock stacked on the last, and the cumulative effect pushed crude into territory it has rarely held since the conflict began. Prior attempts to hold these highs in March, April, and May all failed, which is what makes the current level analytically interesting rather than just a round number.
| Asset | Level | Date | Key resistance |
|---|---|---|---|
| WTI (Investing.com) | $101.56/bbl (high $104.21) | 15 September 2026 | ~$111/bbl |
| WTI (original source) | Above $105/bbl | September 2026 | ~$111/bbl |
| Brent (Reuters settlement) | $101.21/bbl | 9 September 2026 | N/A |
With WTI meaningfully above $105 by the original commentary, the next technical resistance sits near $111. But the more revealing signal is in the momentum, not the price.
The early warning to watch Prices are setting new highs, but the relative strength index (RSI), a momentum gauge measuring the speed of recent price moves, is not confirming them. This negative divergence suggests upward pressure is fading. It does not trigger a reversal on its own, but it is the first sign that the advance may be running out of fuel.
Here is what oil above $100 means for you. This is not just a commodity story. It is the market pricing in a sustained supply disruption, which means every macro input you care about, from the next inflation print to rate expectations to corporate margins, is now being recalculated with a higher energy floor baked in. That is why understanding the geopolitical cause matters before the next CPI reading lands.
When big ASX news breaks, our subscribers know first
How oil above $100 travels through the economy and into equity prices
The chain from a tanker strike in the Strait of Hormuz to your S&P 500 position runs through four distinct links, and each one explains why a commodity shock ends up mattering to equities rather than staying contained in energy markets.
The transmission works like this:
- Consumer tax effect: elevated oil squeezes real disposable income, acting as a tax on households.
- Corporate margin compression: energy-intensive sectors absorb higher input costs, which eats into earnings.
- Inflation persistence: the risk of second-round inflation effects rises, raising the odds of higher rates for longer.
- Discount-rate deterioration: earnings expectations and real yields move in the wrong direction at the same time, making risk assets less attractive on two fronts at once.
Reuters explicitly linked the September oil move to inflationary pressure, while The Guardian framed the Iran-driven surge as a complication for central banks weighing how long to hold rates elevated. One caveat complicates the clean story: energy stocks can benefit from higher crude, creating sector-level divergence within the index even as the headline number slips. A falling S&P 500 with rising energy names is not a contradiction; it is the transmission mechanism working unevenly.
The cross-asset repricing that follows a sustained Hormuz disruption runs through distinct transmission channels: ECB and Fed policy signals shift first, then equity sector valuations reprice, and finally credit spreads widen as higher energy costs compound the earnings risk already building in the index.
Where the S&P 500 stands technically heading into the Fed decision
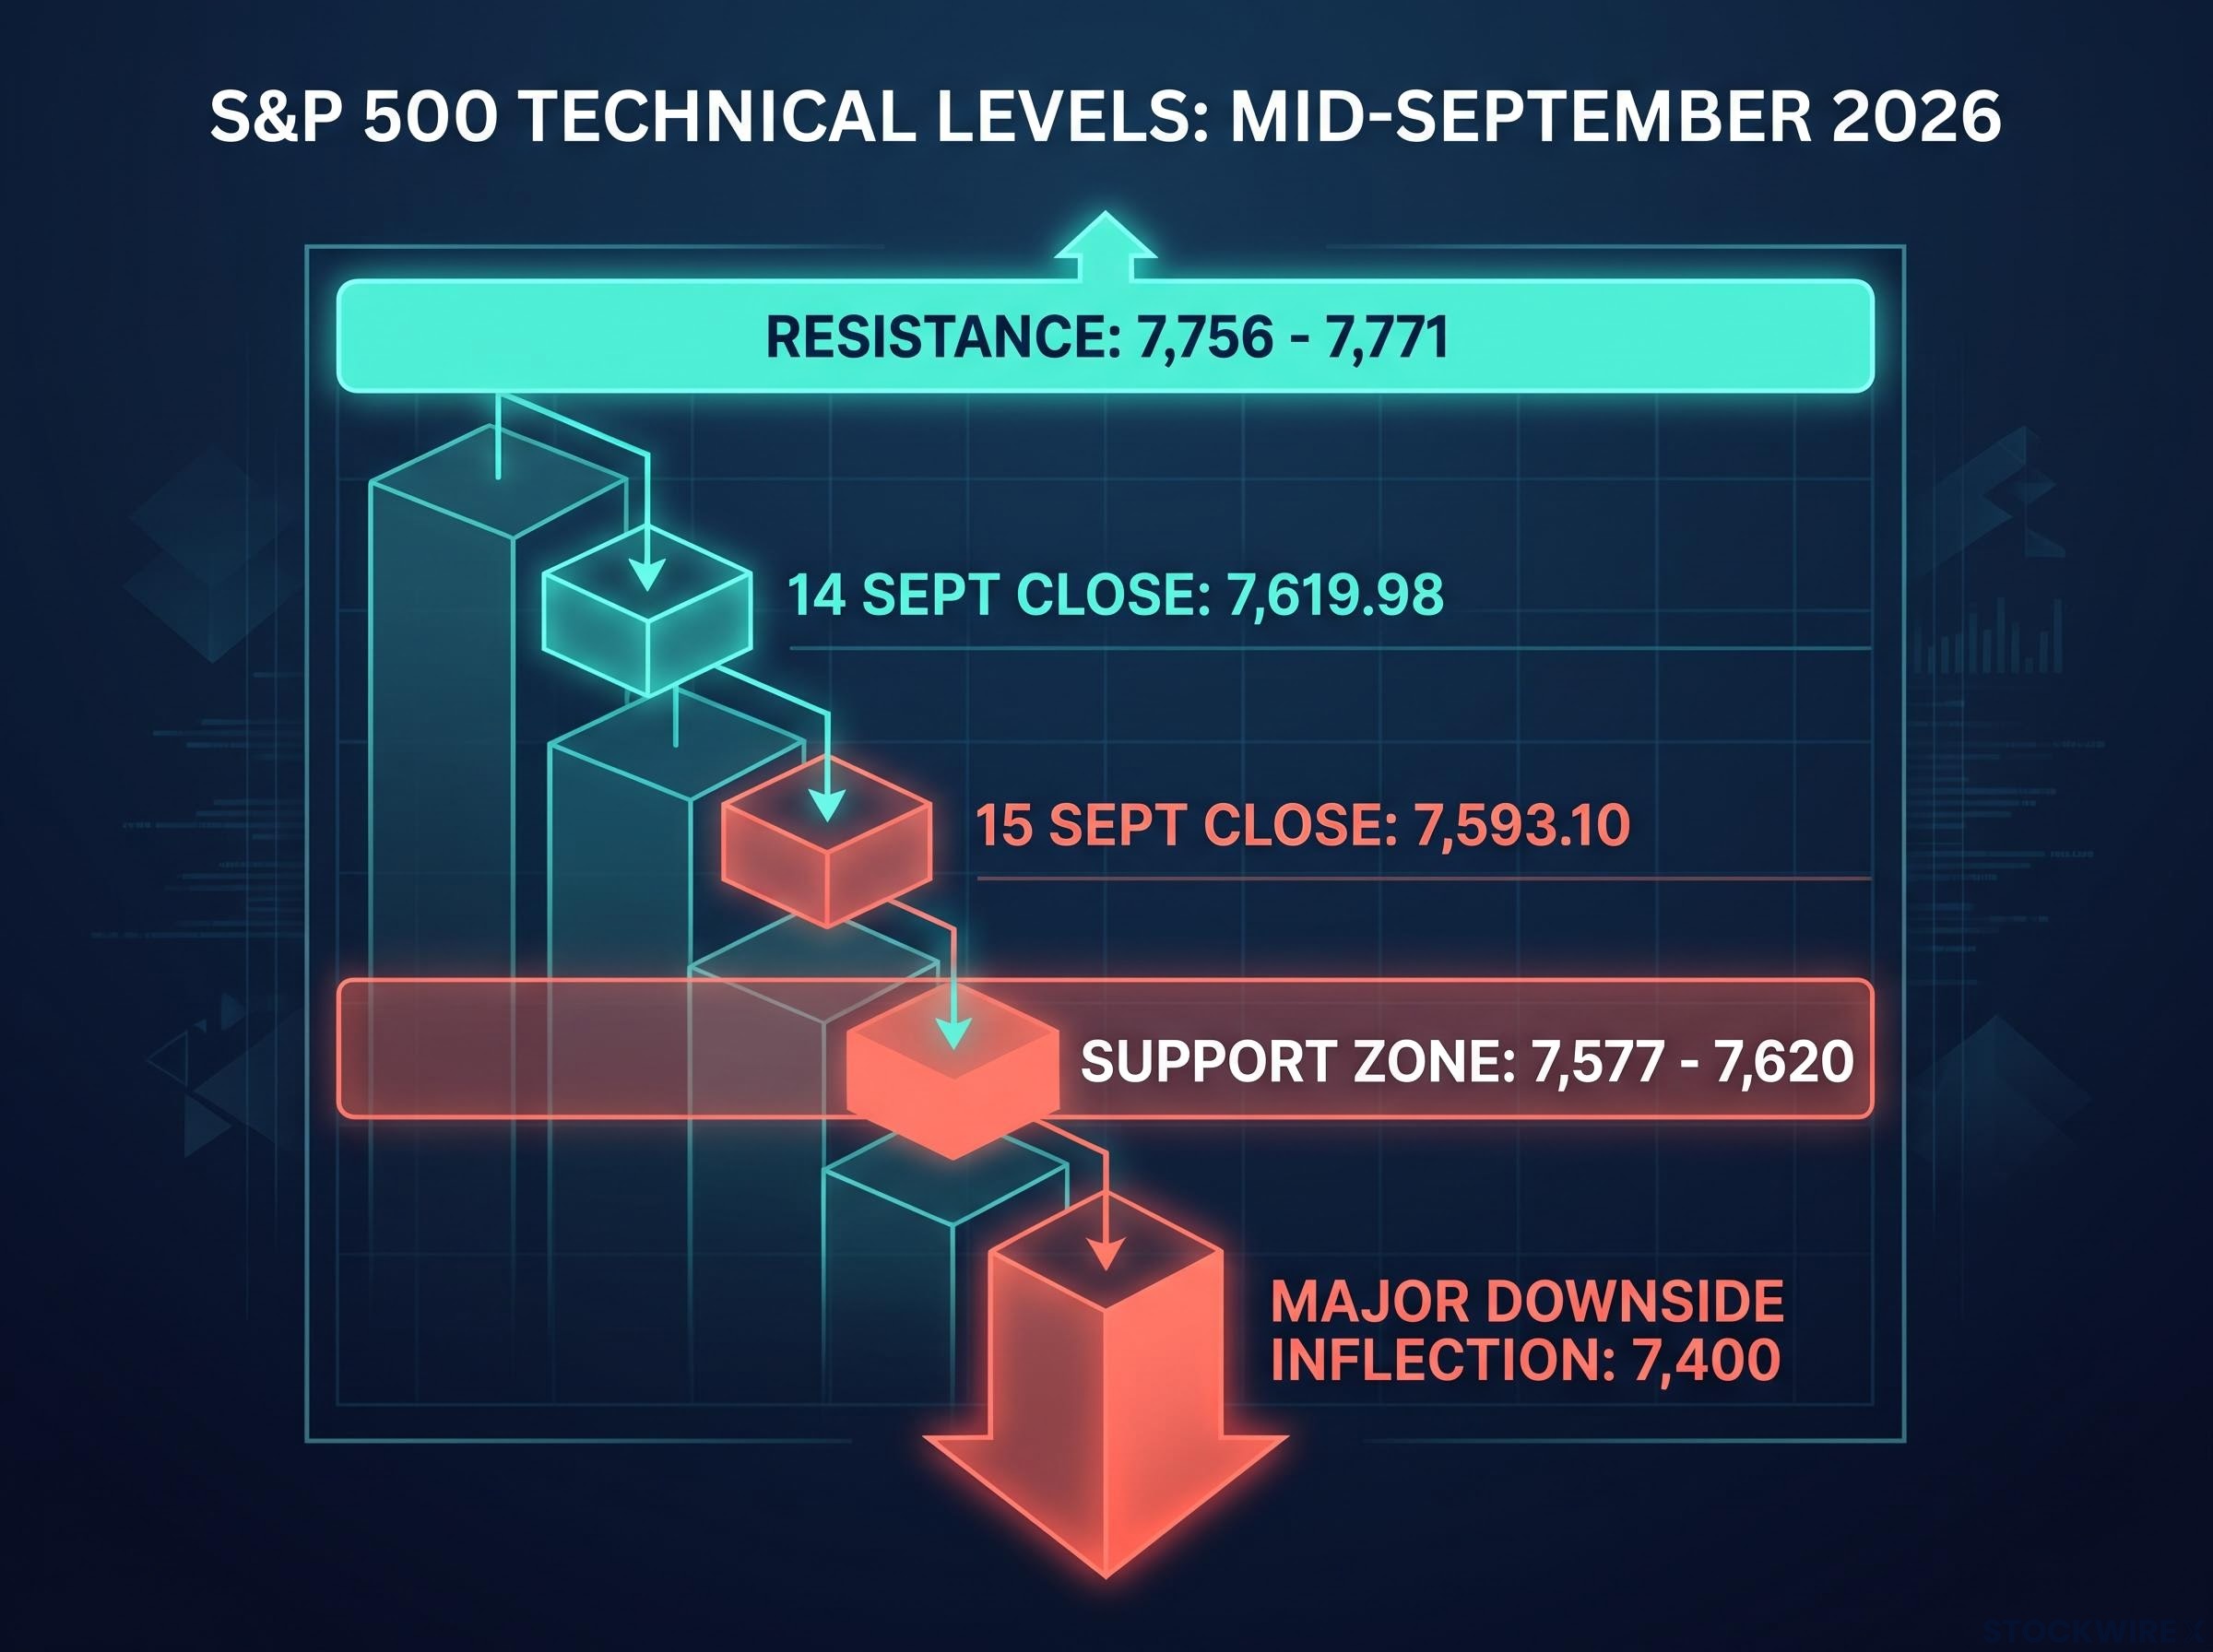
The index closed at 7,593.10 on 15 September 2026, down from the prior close of 7,619.98 on 14 September 2026 (Investing.com; Yahoo Finance). A Reuters technical note on 10 September 2026 placed the significant near-term support zone between 7,577 and 7,620, with resistance near 7,756-7,771.
The original source characterises the descent as a grinding, choppy move through the middle of the range rather than a sharp break, though a rapid breakdown cannot be ruled out. It also identifies 7,400 as the next major downside inflection point if the decline accelerates after the Fed decision, with the NASDAQ’s next significant level sitting below 28,000 and the Russell 2000 approaching technically meaningful territory.
That 7,400 level is not just a chart number. It represents the threshold at which the current move shifts from a technical consolidation within a longer uptrend to something that warrants a more defensive portfolio posture. A breach of the 7,577-7,620 cluster would be the first step toward it.
Retail sales add another layer of ambiguity. The upcoming release is forecast at +0.9% month-on-month, a sharp swing from the prior -0.6%. But the headline number can mislead.
The U.S. Census Bureau retail trade survey is the official source for the monthly retail sales data, and it does not adjust figures for inflation, meaning a nominal headline beat in a high-energy-price environment can mask flat or negative real demand growth.
The caveat most readers miss Retail sales figures are not adjusted for inflation. A nominal beat can simply reflect higher prices paid for the same volume of goods, not stronger demand. In an environment with oil above $100, a headline retail sales beat does not automatically mean the consumer is healthy.
The read for you is this: if you watch index levels without understanding the oil-to-earnings-to-discount-rate chain, you risk mistaking a sector-specific energy tailwind for a broad market recovery. The two look similar on a headline ticker and mean very different things for your exposure.
The CLARITY Act’s Senate failure and what it actually tells you about Bitcoin’s drivers
Bitcoin dropped roughly 4.6-4.7%, falling below $75,000, after the US Senate’s procedural vote on the CLARITY Act fell short of the 60-vote cloture threshold on or around 15 September 2026 (TradingView; InvestingLive). The token had been trading near $79,500 before the multi-day slide.
The legislative path had looked promising until it stalled:
- The House passed the Digital Asset Market Clarity Act (CLARITY Act) by a bipartisan vote of 294-134 on 17-18 July 2025.
- The bill moved to the Senate but was set aside in late July 2026 ahead of the August recess without a floor vote.
- The September procedural vote failed to reach the 60 votes needed for cloture, and the bill did not advance.
The CLARITY Act’s Senate defeat leaves US digital asset exchanges without a statutory registration pathway, preserving the existing patchwork of SEC enforcement actions and CFTC derivatives oversight that has kept institutional capital concentrated in ETF wrappers rather than spot markets.
The market reporting framed this as a clean cause and effect: regulatory disappointment, then a sell-off. But the more analytically interesting question is whether the CLARITY Act was ever really the thing driving Bitcoin higher in the first place. Two competing frameworks explain the prior rally.
Bitcoin’s correlation with risk assets has strengthened as institutional flows dominate price action, which is precisely why a regulatory disappointment like the CLARITY Act vote and a broad de-risking episode can produce indistinguishable sell-off patterns even when the fundamental drivers differ.
| Framework | Key driver identified | Implication for next move |
|---|---|---|
| Risk-asset view | Bitcoin sold off with other high-beta assets on regulatory disappointment and de-risking | Direction tracks equities, yields, and broad risk appetite |
| Monetary-policy-channel view | Treasury yield guidance, not legislation, drove the prior advance | Direction tracks Fed and Treasury yield signals far more than crypto legislation |
The original source leans firmly toward the second framework, and its reasoning is the most distinctive finding in the whole picture.
The counterintuitive read The CLARITY Act’s passage had not been widely anticipated as the primary catalyst for Bitcoin’s rally. Prior yield-related commentary from Treasury Secretary Scott Bessent aligned far more closely in timing with the advance, an alignment the original source describes as too direct to be coincidental.
The research layer documents the severity of the drop, roughly $771 million in liquidations (a figure not independently verified), and frames it as a mix of regulatory shock and broad risk-off positioning. The original source, by contrast, calls the decline more modest, with key support intact.
Here is why the distinction matters for you. If Treasury yield guidance, not crypto legislation, was the real engine of Bitcoin’s prior rally, then the Senate failure is a smaller catalyst than the headlines imply. It means you should be watching the Fed’s rate signal far more closely than any procedural vote in Congress, because that is where Bitcoin’s next direction is more likely to be decided.
Why these three signals may not be telling the same story (and when they would)
Step back, and the honest analytical caveat becomes clear: these three moves look unified from a distance, but they run on different clocks and answer to different investors.
Risk-on and risk-off regimes do not announce themselves cleanly: capital rotations into Treasuries, yen, and gold tend to lead equity declines by days rather than coincide with them, which is why watching cross-asset flows alongside index levels provides earlier confirmation than any single price signal.
Oil reacts almost instantly to physical supply shocks on a near-real-time geopolitical clock. Equities respond to earnings, macro data, and policy expectations on a slower cycle, and energy stocks can rise even as the index falls. Crypto can move on microstructure factors like liquidations and funding-rate resets, which means Bitcoin can swing hard even when oil and equities sit still.
The Reuters technical note on 10 September 2026 reinforces the sceptical case. It framed recent equity moves through Gann lines and support-resistance clusters, not macro panic, which suggests chart-driven positioning may explain moves that look macro-driven from the outside. The Bitcoin drop, meanwhile, had a specific regulatory catalyst that would have mattered even in a calm macro backdrop.
So when should you treat divergent moves as a genuine unified risk-off signal rather than three parallel stories? The interpretation gains credibility under three conditions:
- Broad-based equity declines across sectors, not just a technical consolidation within a longer uptrend.
- Crypto selling in tandem with equities and credit across multiple episodes, without a regulatory-specific catalyst to explain it.
- Retail sales data showing demand clearly weaker from energy pass-through, confirming higher oil is reaching the real economy.
Until the retail sales print confirms that higher energy costs are genuinely cutting into demand rather than just inflating nominal spending, you do not yet have the full picture needed to call this a unified risk-off regime.
What history suggests when these pressures overlap
There is no exact precedent for the 2026 configuration of oil above $100, the S&P 500 near current levels, and a major crypto market-structure bill failing in the Senate. But partial analogues rhyme.
In 2007-2008 and 2011, oil above $100 coincided with equity stress and heightened policy uncertainty, and defensive sentiment tended to emerge whenever energy costs threatened growth and inflation at the same time. The closest recent analogue is 2021-2022, when elevated oil, monetary tightening, crypto drawdowns, and intensifying regulatory debate overlapped to produce fragile sentiment and correlation spikes.
None of these maps exactly onto today. But the pattern is consistent: when energy shocks, policy uncertainty, and tightening financial conditions stack, cross-asset volatility and episodic correlation spikes tend to follow. That is the fragility to watch for, even if the trigger is new each time.
What the next 48 hours could confirm or overturn
The ambiguity this article has built resolves through two near-term catalysts, not a prediction. Each one tests a specific hypothesis raised earlier, and together they will tell you whether a single macro force is doing the damage or whether these are three manageable, distinct stories.
Watch these two data points in order:
- The retail sales print: a nominal beat that reflects higher energy prices rather than real demand growth does not change the risk picture. A genuine demand beat would suggest the consumer is absorbing higher oil without flinching, which reduces one transmission risk.
- The Fed rate signal and its interaction with the 7,400 S&P 500 threshold: a hawkish signal combined with oil above $100 is the scenario most likely to push the index toward that inflection point.
The question is not whether oil, equities, and Bitcoin are all falling. It is whether the retail sales data and the Fed’s tone confirm that energy-driven inflation is doing the damage across all three, because that confirmation is what would shift the appropriate response from watchful to defensive.
The most differentiated takeaway For Bitcoin, watch yield guidance from the Fed and Treasury, the Bessent channel, rather than the legislative calendar. In the current environment, the original source’s analysis suggests that is the more reliable indicator of where the token heads next.
Wait for a fully unified risk-off confirmation and you will always be a step behind. Act on ambiguous multi-asset signals without the confirming data and you risk overreacting to what may be three separate, manageable stories. The retail sales print and the Fed’s next signal are the two pieces of evidence that decide which reading is correct.
This article is for informational purposes only and should not be considered financial advice. Investors should conduct their own research and consult with financial professionals before making investment decisions. Past performance does not guarantee future results, and these statements are speculative and subject to change based on market developments.