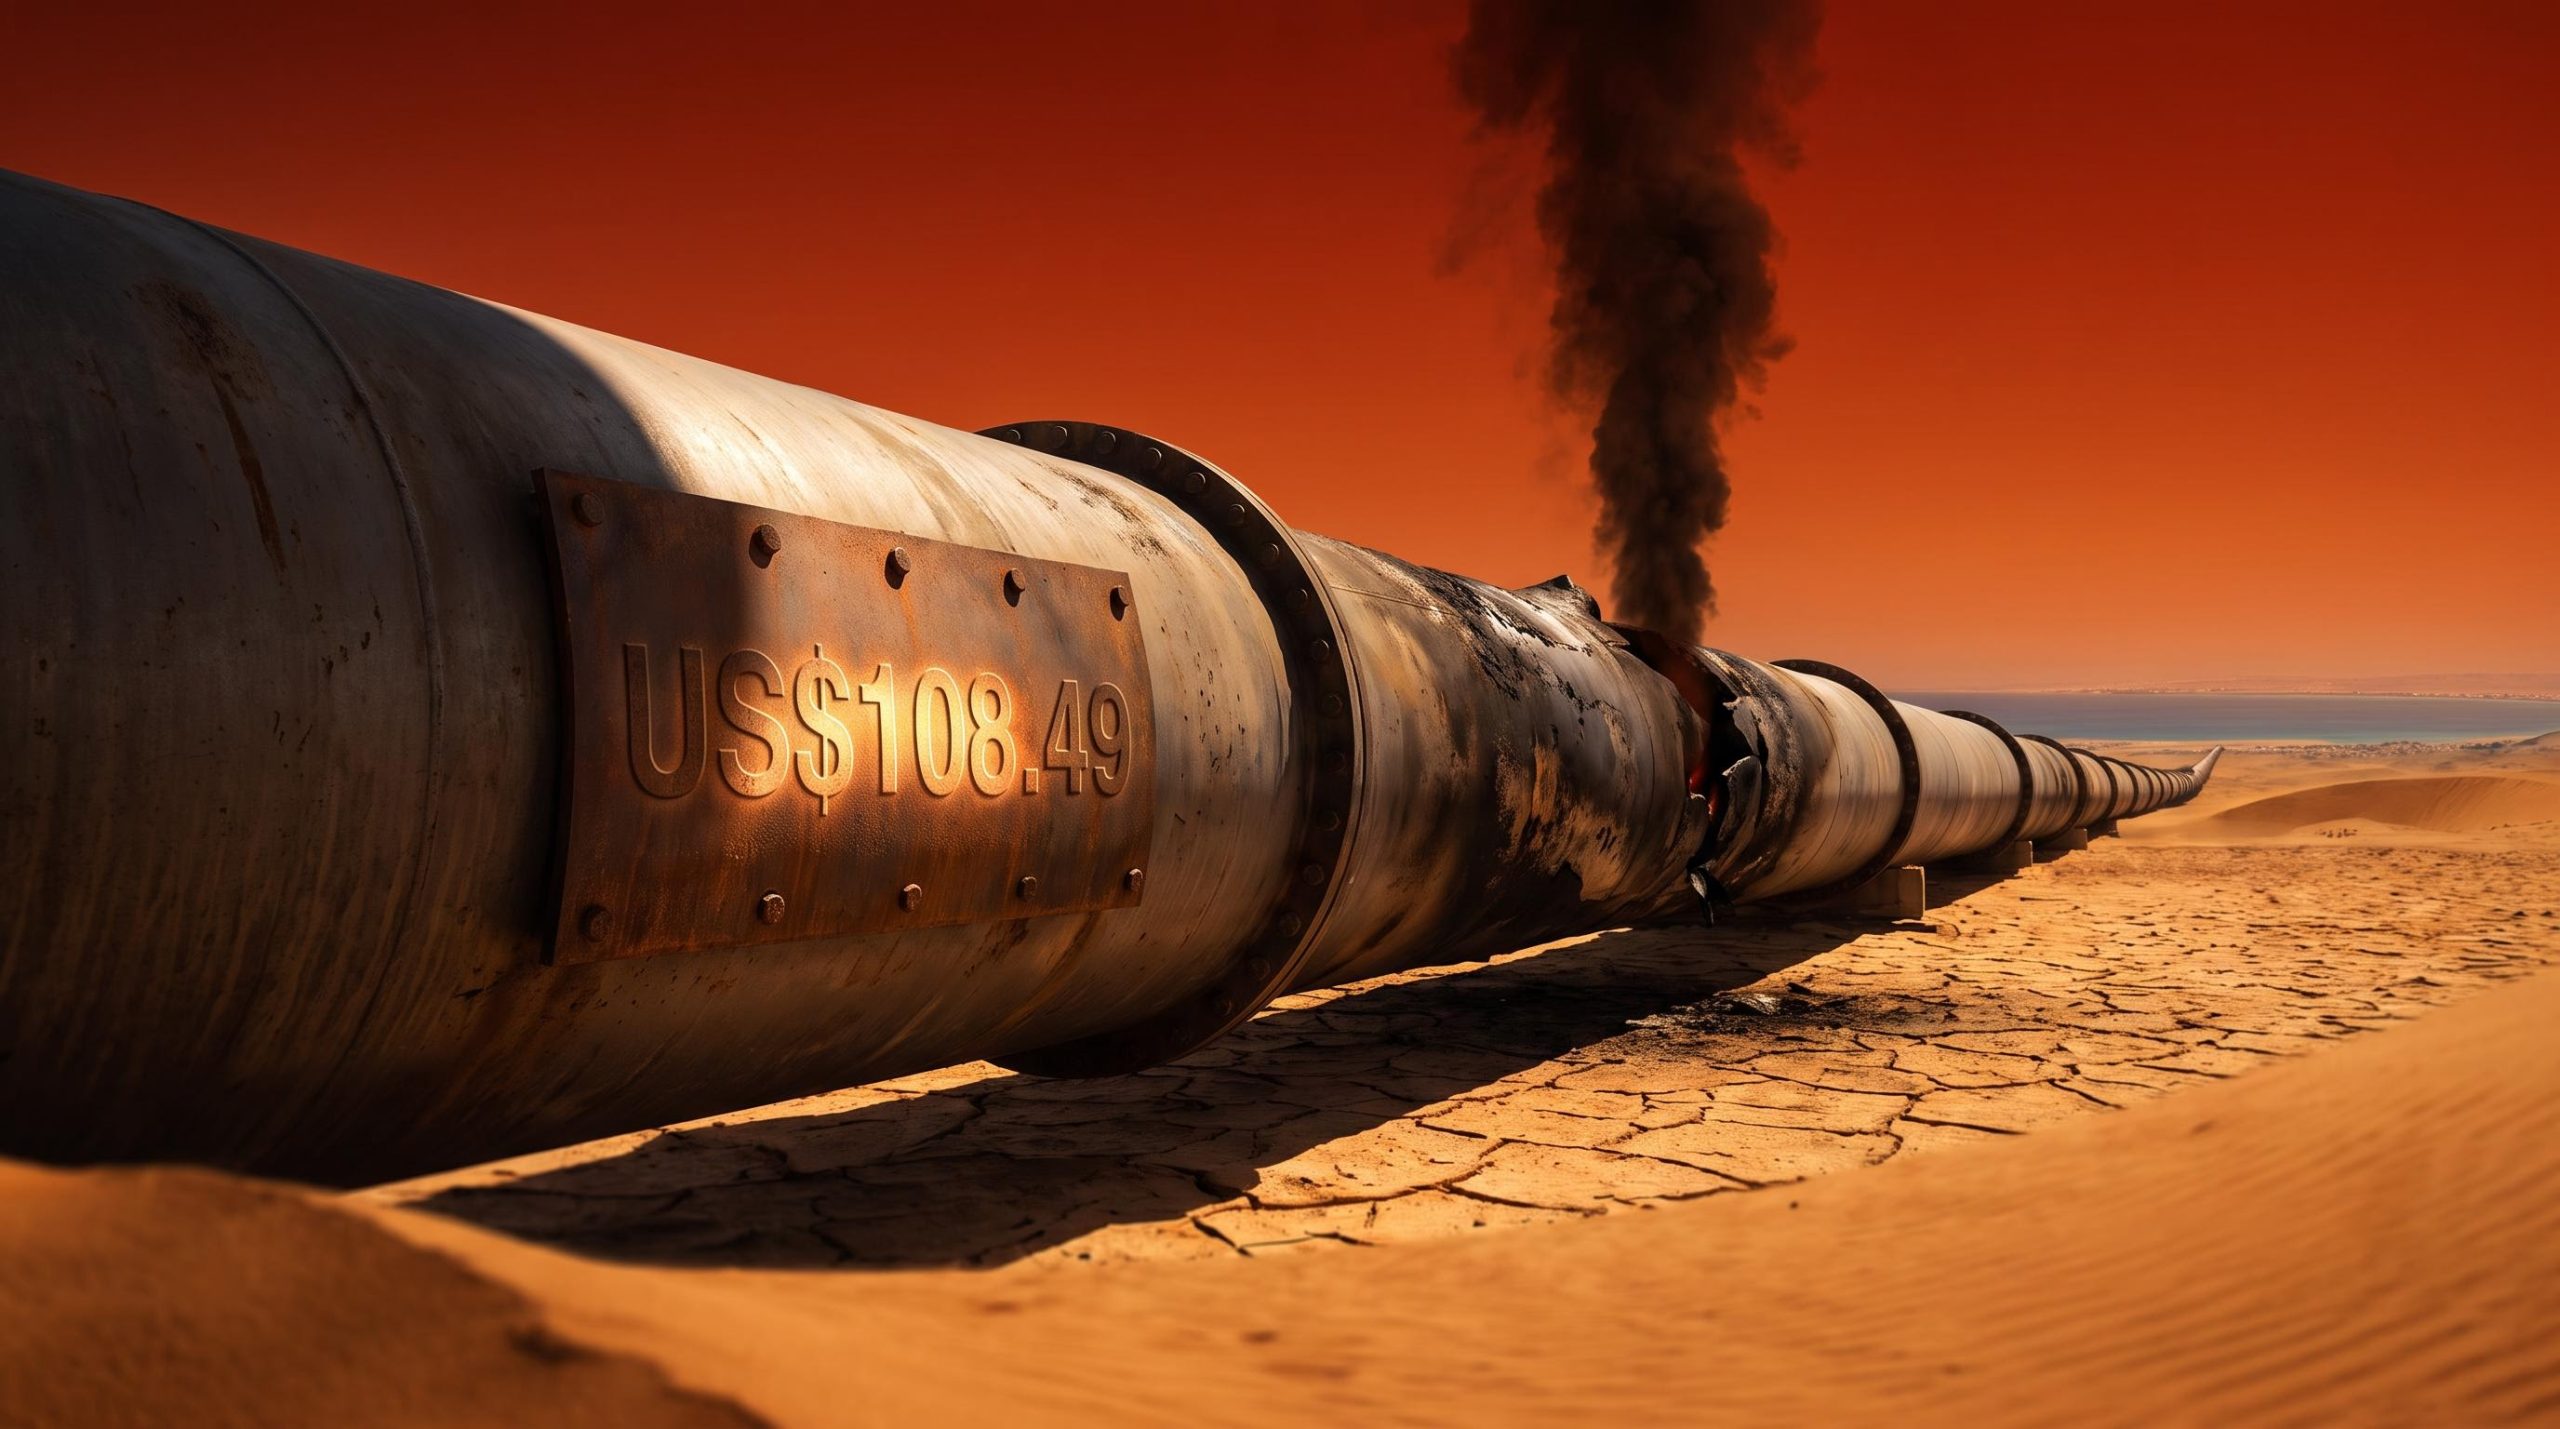
There is a clock running under Saudi Arabia’s oil exports, and it is measured in days, not weeks. The Yanbu export terminal on the Red Sea is drawing down storage that covers only five to seven days of crude shipments, and the pipeline meant to refill those tanks has been offline since 10 September 2026.
That pipeline, the East-West line, is not a convenient alternative. It has become a structural necessity. Since the US-Iran war shut the Strait of Hormuz to most Saudi barrels, it is effectively the only export channel Saudi Arabia can use without Iranian permission. Houthi strikes on 10 September 2026 knocked it out, pushing Brent crude to US$108.49 on 16 September 2026 and putting roughly 4% of global crude supply at risk.
What follows here separates what the oil market is currently pricing from what it may not yet be pricing. The aim is to give a clear framework for judging whether the present level of alarm is calibrated to the physical reality, or still running behind it.
Why the East-West pipeline is the last line Saudi Arabia has left
To understand why this outage is different, start with what the pipeline actually does. The 1,200-kilometre Petroline was built to carry crude from the eastern fields around Abqaiq to Yanbu on the Red Sea, routing Saudi exports around the Strait of Hormuz entirely. Its design capacity runs to 7 million barrels per day (bpd), with typical operational throughput closer to 4-5 million bpd.
That routing choice used to be an option. Now it is the only one.
What the bypass network looks like today
Before the war, Saudi crude reached global buyers by three main paths: through Hormuz by tanker, overland via the East-West pipeline to Yanbu, and via the UAE’s Abu Dhabi Crude Oil Pipeline (ADCOP) as a secondary bypass. Here is where each stands now.
- Hormuz: Largely closed to Saudi barrels without Iranian Revolutionary Guard permission. Effectively gated.
- East-West to Yanbu: Offline since 10 September 2026 following the Houthi strikes.
- UAE ADCOP: The only major overland bypass still operational.
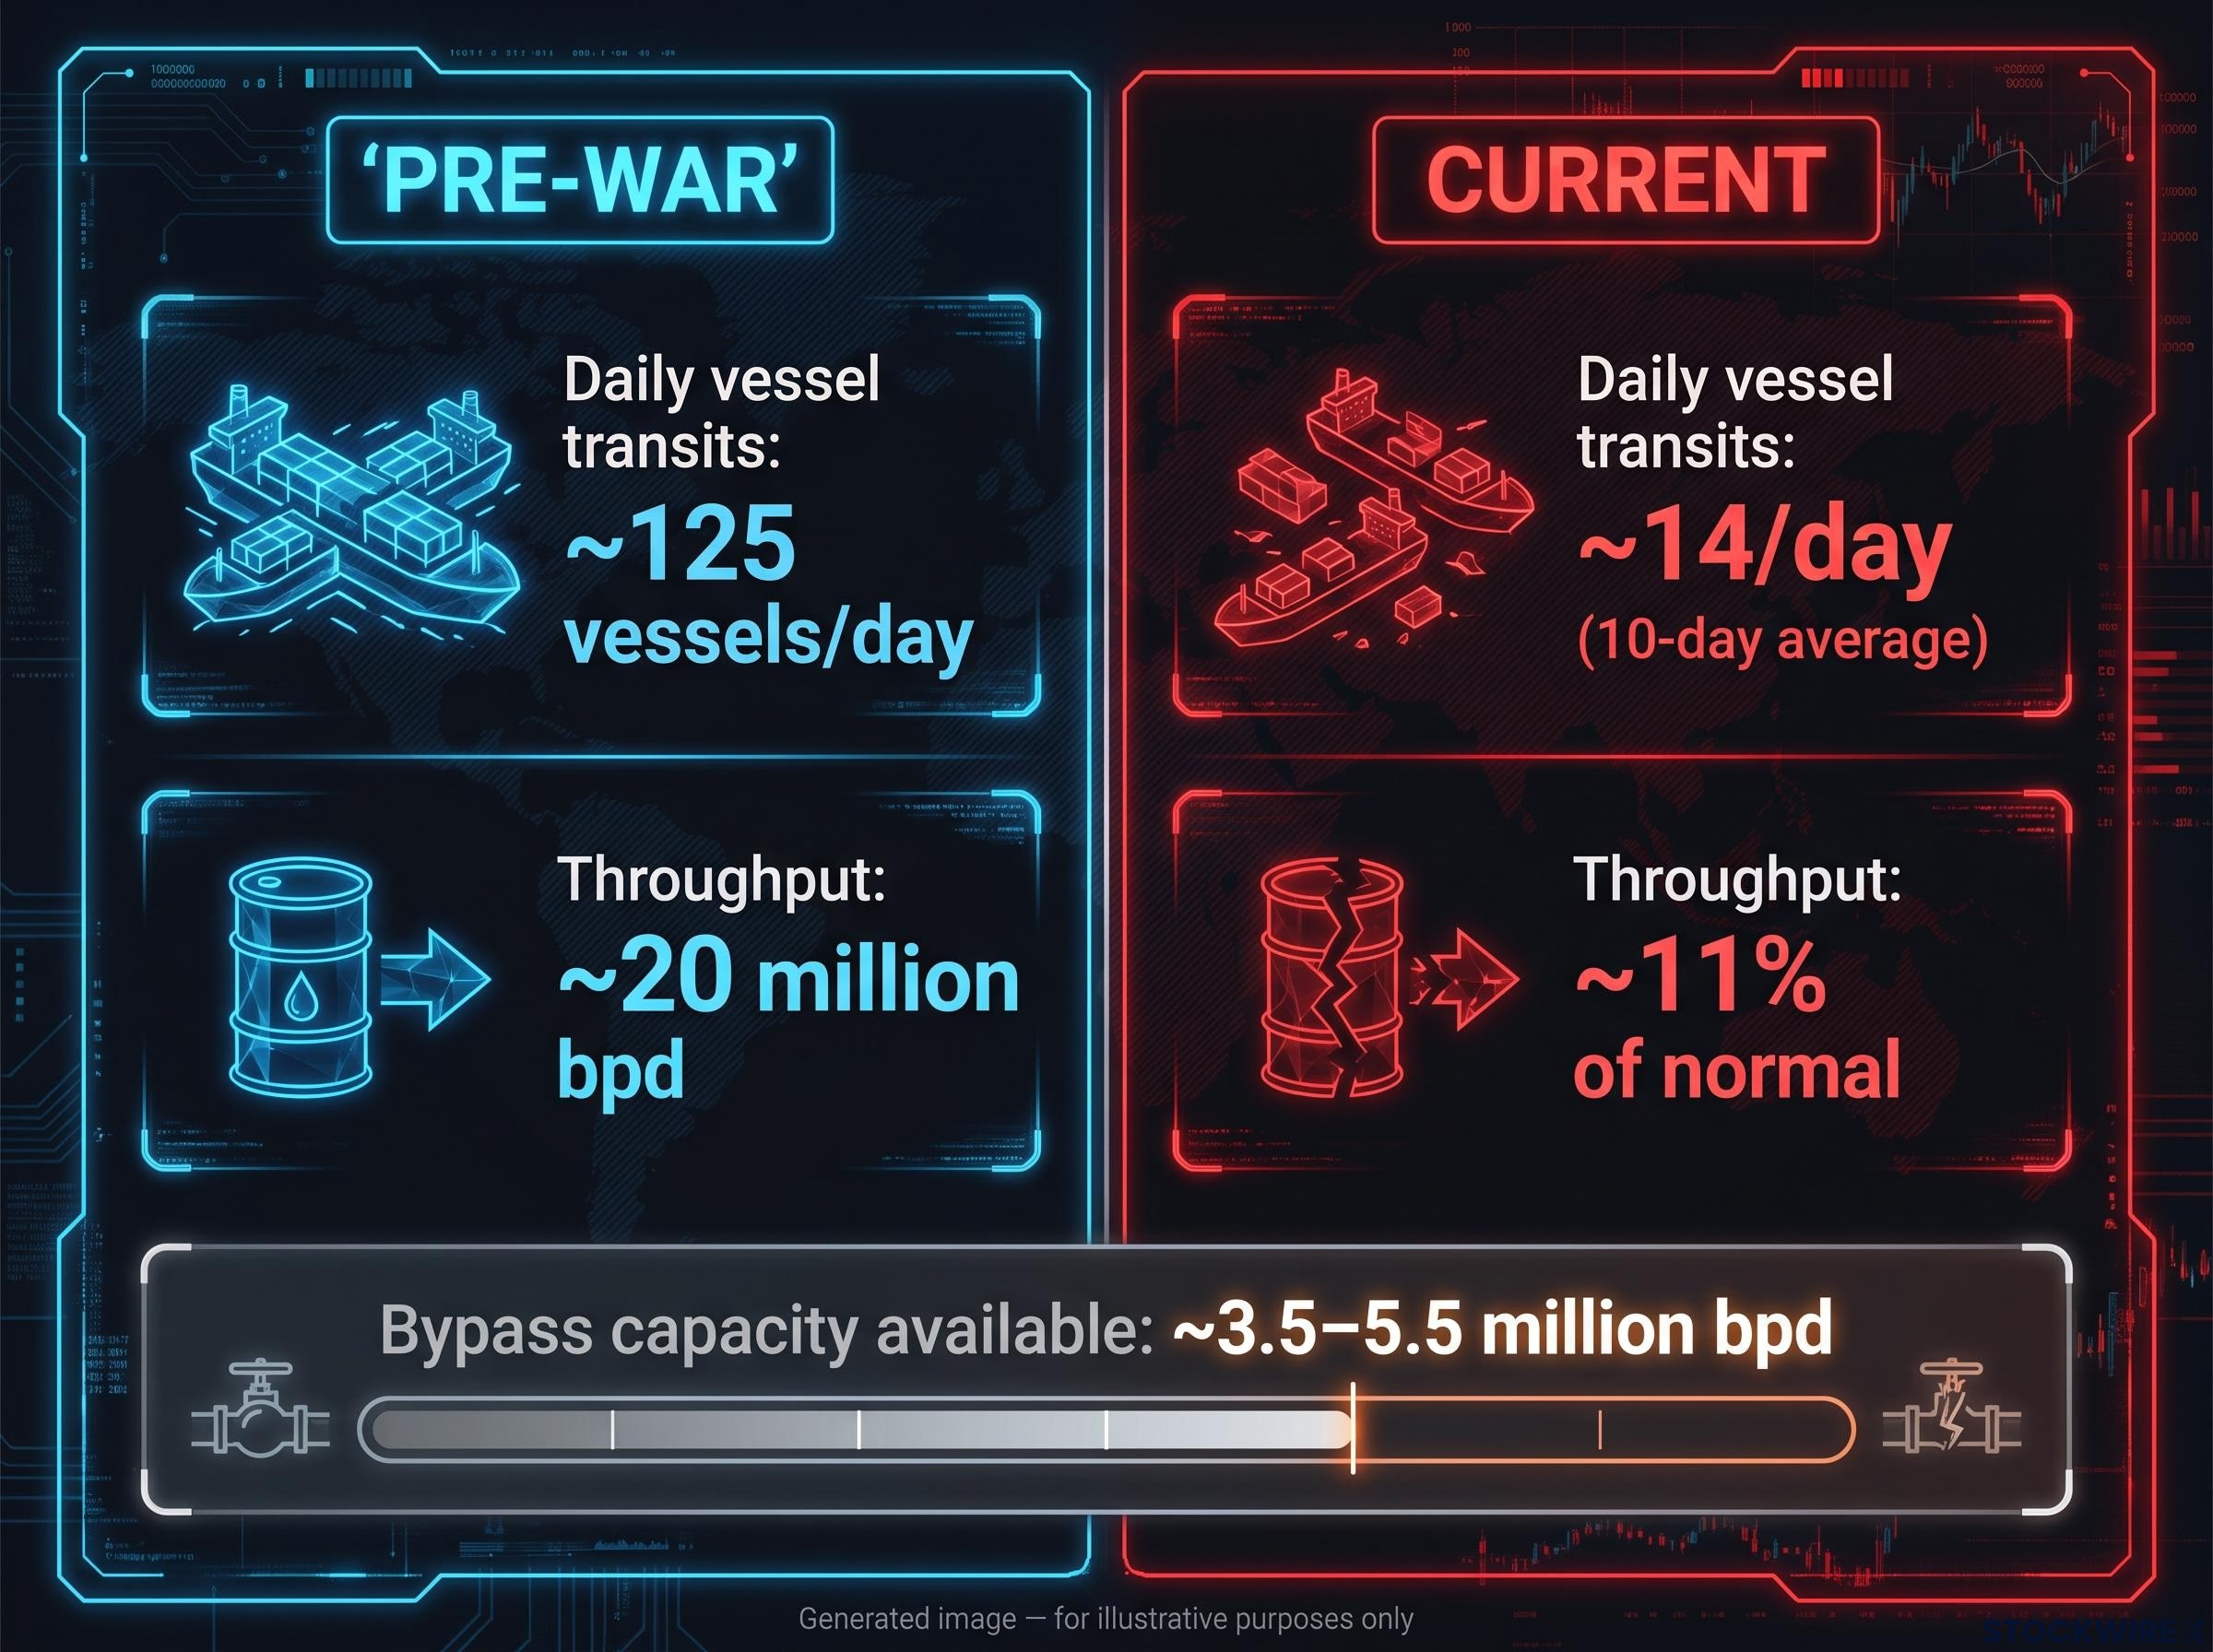
Combined Gulf bypass capacity, Saudi East-West plus UAE ADCOP, runs to roughly 3.5-5.5 million bpd, according to August 2026 commentary from advisory firm Stout. That represents only about one-quarter of the 20 million bpd that transited Hormuz before the war. With the Saudi line down, ADCOP alone cannot come close to replacing the lost volume.
Why losing it now is different
House of Saud war analysis describes the East-West pipeline as the kingdom’s only working connection between its producing fields and a functioning export terminal, warning that sustained strikes on its five major pumping stations could sever that link.
“Saudi Arabia’s last functioning export artery”
The distinction matters for how you frame the risk. In a normal supply shock, the question is how fast Aramco can repair a pipe. Here, losing this pipeline does not just remove barrels; it removes the one routing option that let Saudi Arabia export at all without Iranian cooperation. That means the relevant timescale is not engineering. It is diplomacy, and the two are measured very differently.
When big ASX news breaks, our subscribers know first
What happened to Hormuz, and why 14 ships a day is already a crisis
The pipeline attack did not land on a healthy system. It landed on one that was already gasping.
Before the war, roughly 125 commodity vessels a day moved through the Strait of Hormuz, carrying about 20 million bpd of crude. That was the artery of Gulf oil.
The Hormuz transit collapse has been building for months: commercial crossings fell from a pre-war baseline of 120-140 vessels per day to as few as 3-14 per day even before the pipeline strikes, with war-risk insurance premiums running at approximately 30 times normal rates and maritime unions classifying the strait as an active war zone.
Now look at the current numbers. Reuters recorded single-digit daily transits over the weekend of 14 September 2026, with the 10-day average sitting near 14 ships per day. On multiple days in early September, only three to five commodity vessels crossed at all. Al Jazeera reports traffic falling from more than 100 vessels a day to as few as five in some periods.
| Hormuz metric | Pre-war | Current |
|---|---|---|
| Daily vessel transits | ~125 vessels/day | ~14/day (3-5 on some days) |
| Throughput | ~20 million bpd | Sharply reduced |
| Bypass capacity available | Not required | ~3.5-5.5 million bpd (both pipelines) |
A 10-day average of 14 ships against a baseline of 125 means the strait is running at roughly 11% of its normal commercial throughput. That is the environment the pipeline outage dropped into. Even the oil that could physically move through Hormuz now needs Iranian Revolutionary Guard clearance, so a political gate sits on top of the physical one.
The read for anyone watching oil risk is straightforward. Markets were already fragile before the strikes. The Houthi attack did not create a crisis from a stable base; it pulled the last major safety valve off a system already running on almost no redundancy. Which is why some physical traders find the market’s calm odd.
Andrew Lipow of Lipow Oil Associates called it “surprising the oil market remains down in light of reporting that Houthi rebels attacked the East-West pipeline, which would impact 7 million barrels of crude”
How the 2019 Abqaiq attack clarifies what makes this disruption different
The obvious historical comparison is the September 2019 assault on Saudi oil infrastructure. The comparison is useful precisely because it breaks down.
The 2019 benchmark
House of Saud’s analysis calls the 2019 Abqaiq-Khurais attack the single most disruptive assault on oil infrastructure in history by immediate barrels lost. Eighteen drones and seven cruise missiles struck the Abqaiq processing facility and Khurais field, temporarily removing 5.7 million bpd, about 5% of global production, for roughly two weeks.
That number is more than four times the daily loss currently disclosed from the East-West pipeline outage. On barrels alone, 2019 was the bigger event.
The recovery path then and now
Barrels are not the whole story. In 2019, Aramco owned the entire recovery. The damage was on infrastructure it controlled, so its own engineering teams restored capacity in roughly two weeks with a defined timeline.
The 2026 situation removes about 2-2.5 million bpd of daily production, with a further 700,000 bpd of Yanbu throughput offline, according to House of Saud. Smaller in barrels, but open-ended in duration.
| Dimension | 2019 Abqaiq | 2026 pipeline outage |
|---|---|---|
| Daily barrels lost | ~5.7 million bpd (~5%) | ~2-2.5 million bpd |
| Recovery path | Aramco engineering, ~2 weeks | Geopolitical settlement, open-ended |
| Export routing | Intact throughout | Compromised |
| Price trajectory | Sharp spike, quick recovery | Sustained elevation modelled |
The structural difference is the whole point. In 2019, barrels were lost but the export routing system stayed intact. In 2026, the routing itself is compromised, so even if production is restored, it cannot reach markets without a geopolitical resolution that is not visible on any current timeline. Sustained strikes on the pipeline’s pumping stations only lengthen that open-ended window.
That inversion, larger in barrels but smaller in structural consequence in 2019, and the reverse now, is why the analytical community is modelling a sustained price floor rather than a brief spike. For anyone exposed to energy costs, equity markets, or inflation expectations, that is the difference between waiting out a spike and adjusting to a new level.
What Goldman Sachs and the broader analyst consensus say about where Brent goes next
So where does Brent go from here? The interesting part of the analyst debate is not the direction. It is the spread between how far and how long.
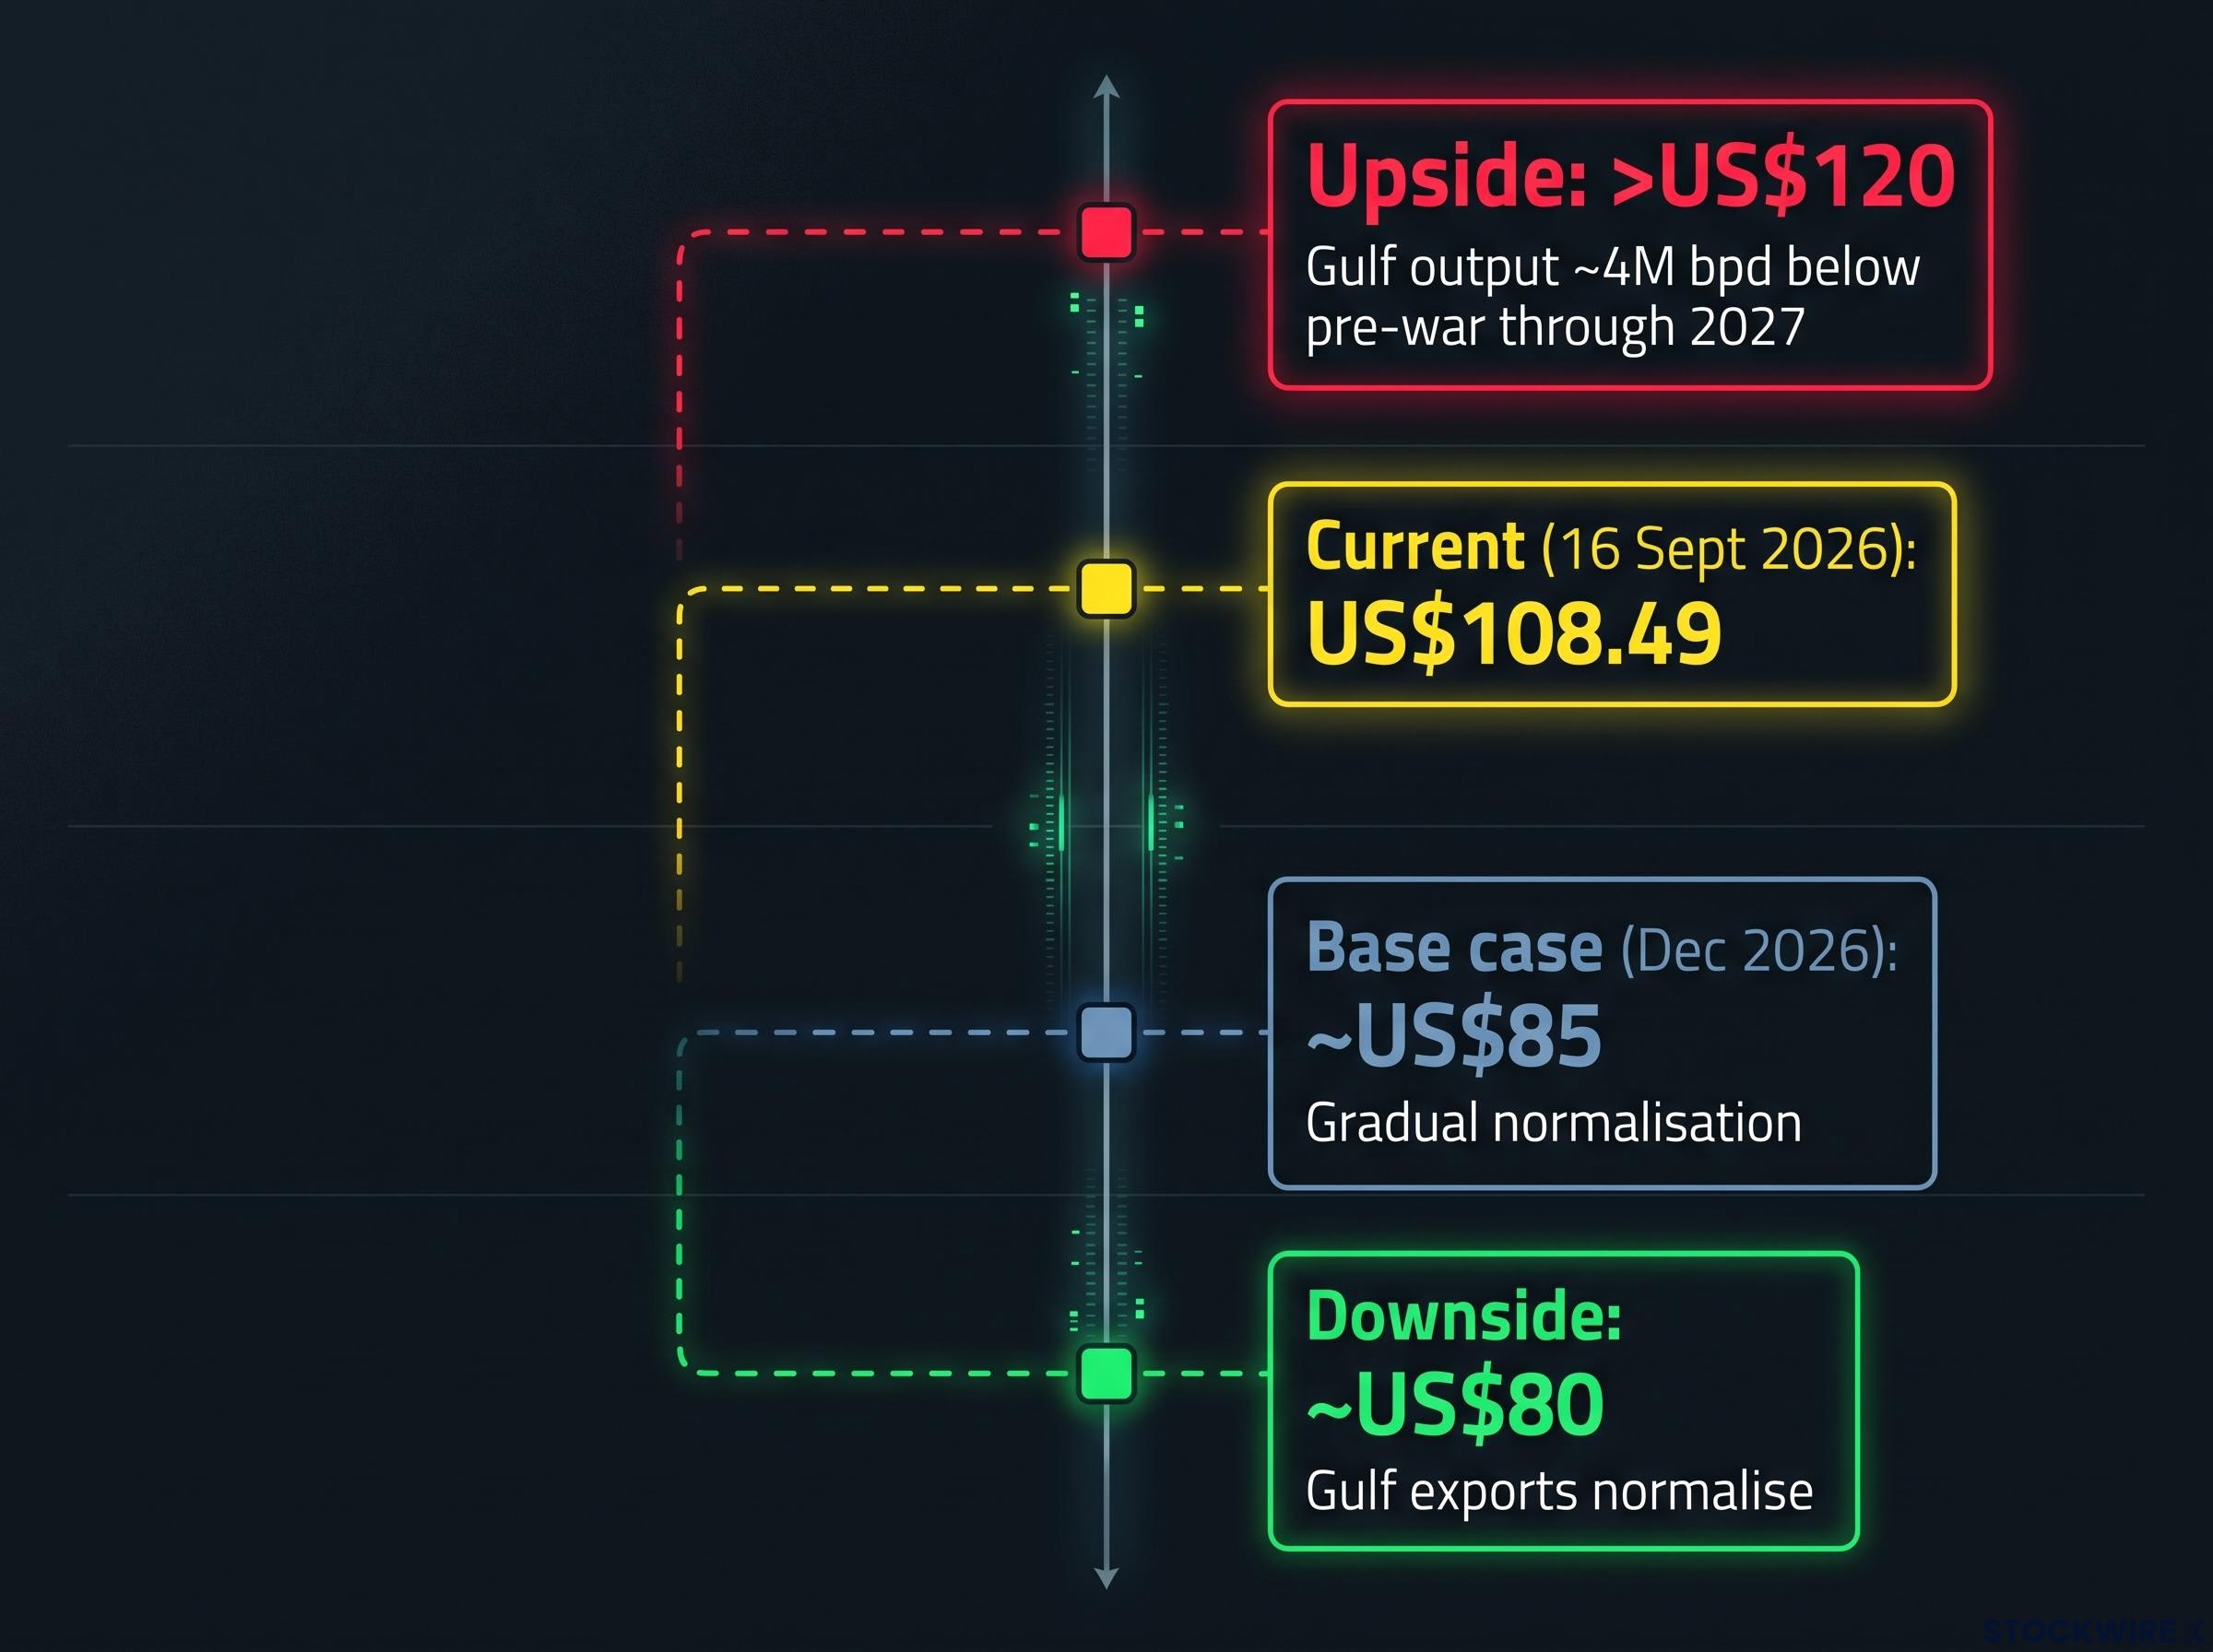
Goldman Sachs has raised the probability of a scenario where Brent pushes above US$120 per barrel, conditioned on Middle East shipping disruptions persisting and Gulf output staying roughly 4 million bpd below pre-war levels through 2027. The bank’s own base case is more restrained: Brent around US$85 and WTI near US$80 by December 2026, with a downside of about US$80 if Gulf exports normalise.
The geopolitical risk premium embedded in Brent has a measurable architecture: Goldman Sachs estimated approximately $14 per barrel of the September price reflected geopolitical risk that could collapse within 24 hours of a credible de-escalation signal, which is why the diplomatic track, not the infrastructure damage report, is the controlling variable for where prices go from here.
| Goldman scenario | Brent | Conditions |
|---|---|---|
| Base case (Dec 2026) | ~US$85 | Gradual normalisation |
| Upside | >US$120 | Gulf output ~4M bpd below pre-war through 2027 |
| Downside | ~US$80 | Gulf exports normalise |
Goldman’s own framing of the balance is the key line.
Goldman Sachs Global Commodities Research described the risks as “significantly tilted to the upside”
Capital Economics comes at it from the other end. Its working assumption is Brent around US$100 for the rest of 2026, which is less a forecast than an acceptance that the worst-case combination of persistent Hormuz disruption and regional attacks has already become the baseline rather than a tail risk. ING analysts, meanwhile, say prices are unlikely to ease until buyers have a firmer read on how badly the infrastructure was hit and how long repairs will take.
Now place the current price against all of that. Brent at US$108.49 already sits well above Goldman’s December base case of US$85. That tells you the market is pricing something much closer to the disruption scenario than to normalisation, and the gap to the US$120 upside threshold is far narrower than the base case alone would suggest. The scenario range sets the boundaries of your risk: resolution points toward a correction to US$80-85, sustained disruption points toward US$120 or above.
The downside risk in a resolution is as real as the upside risk from escalation: with spot Brent already above the Reuters full-year consensus of $85.08, a ceasefire headline could trigger a sharp reversal with no established technical support below the September trend-line breakout, a dynamic that makes the current price level structurally unstable in both directions.
The compounding factors that stop this from being a simple pipeline story
A single-point failure is a headline. This is not that. The pipeline outage is landing on top of several other pressures, and it is the convergence that makes it dangerous.
- Russian refinery curtailments: Drone strike damage pushed roughly half of Russia’s six largest diesel-producing refineries into sharply reduced or halted production during September 2026, according to the original source citing BNN Bloomberg, tightening refined product supply just as crude tightens.
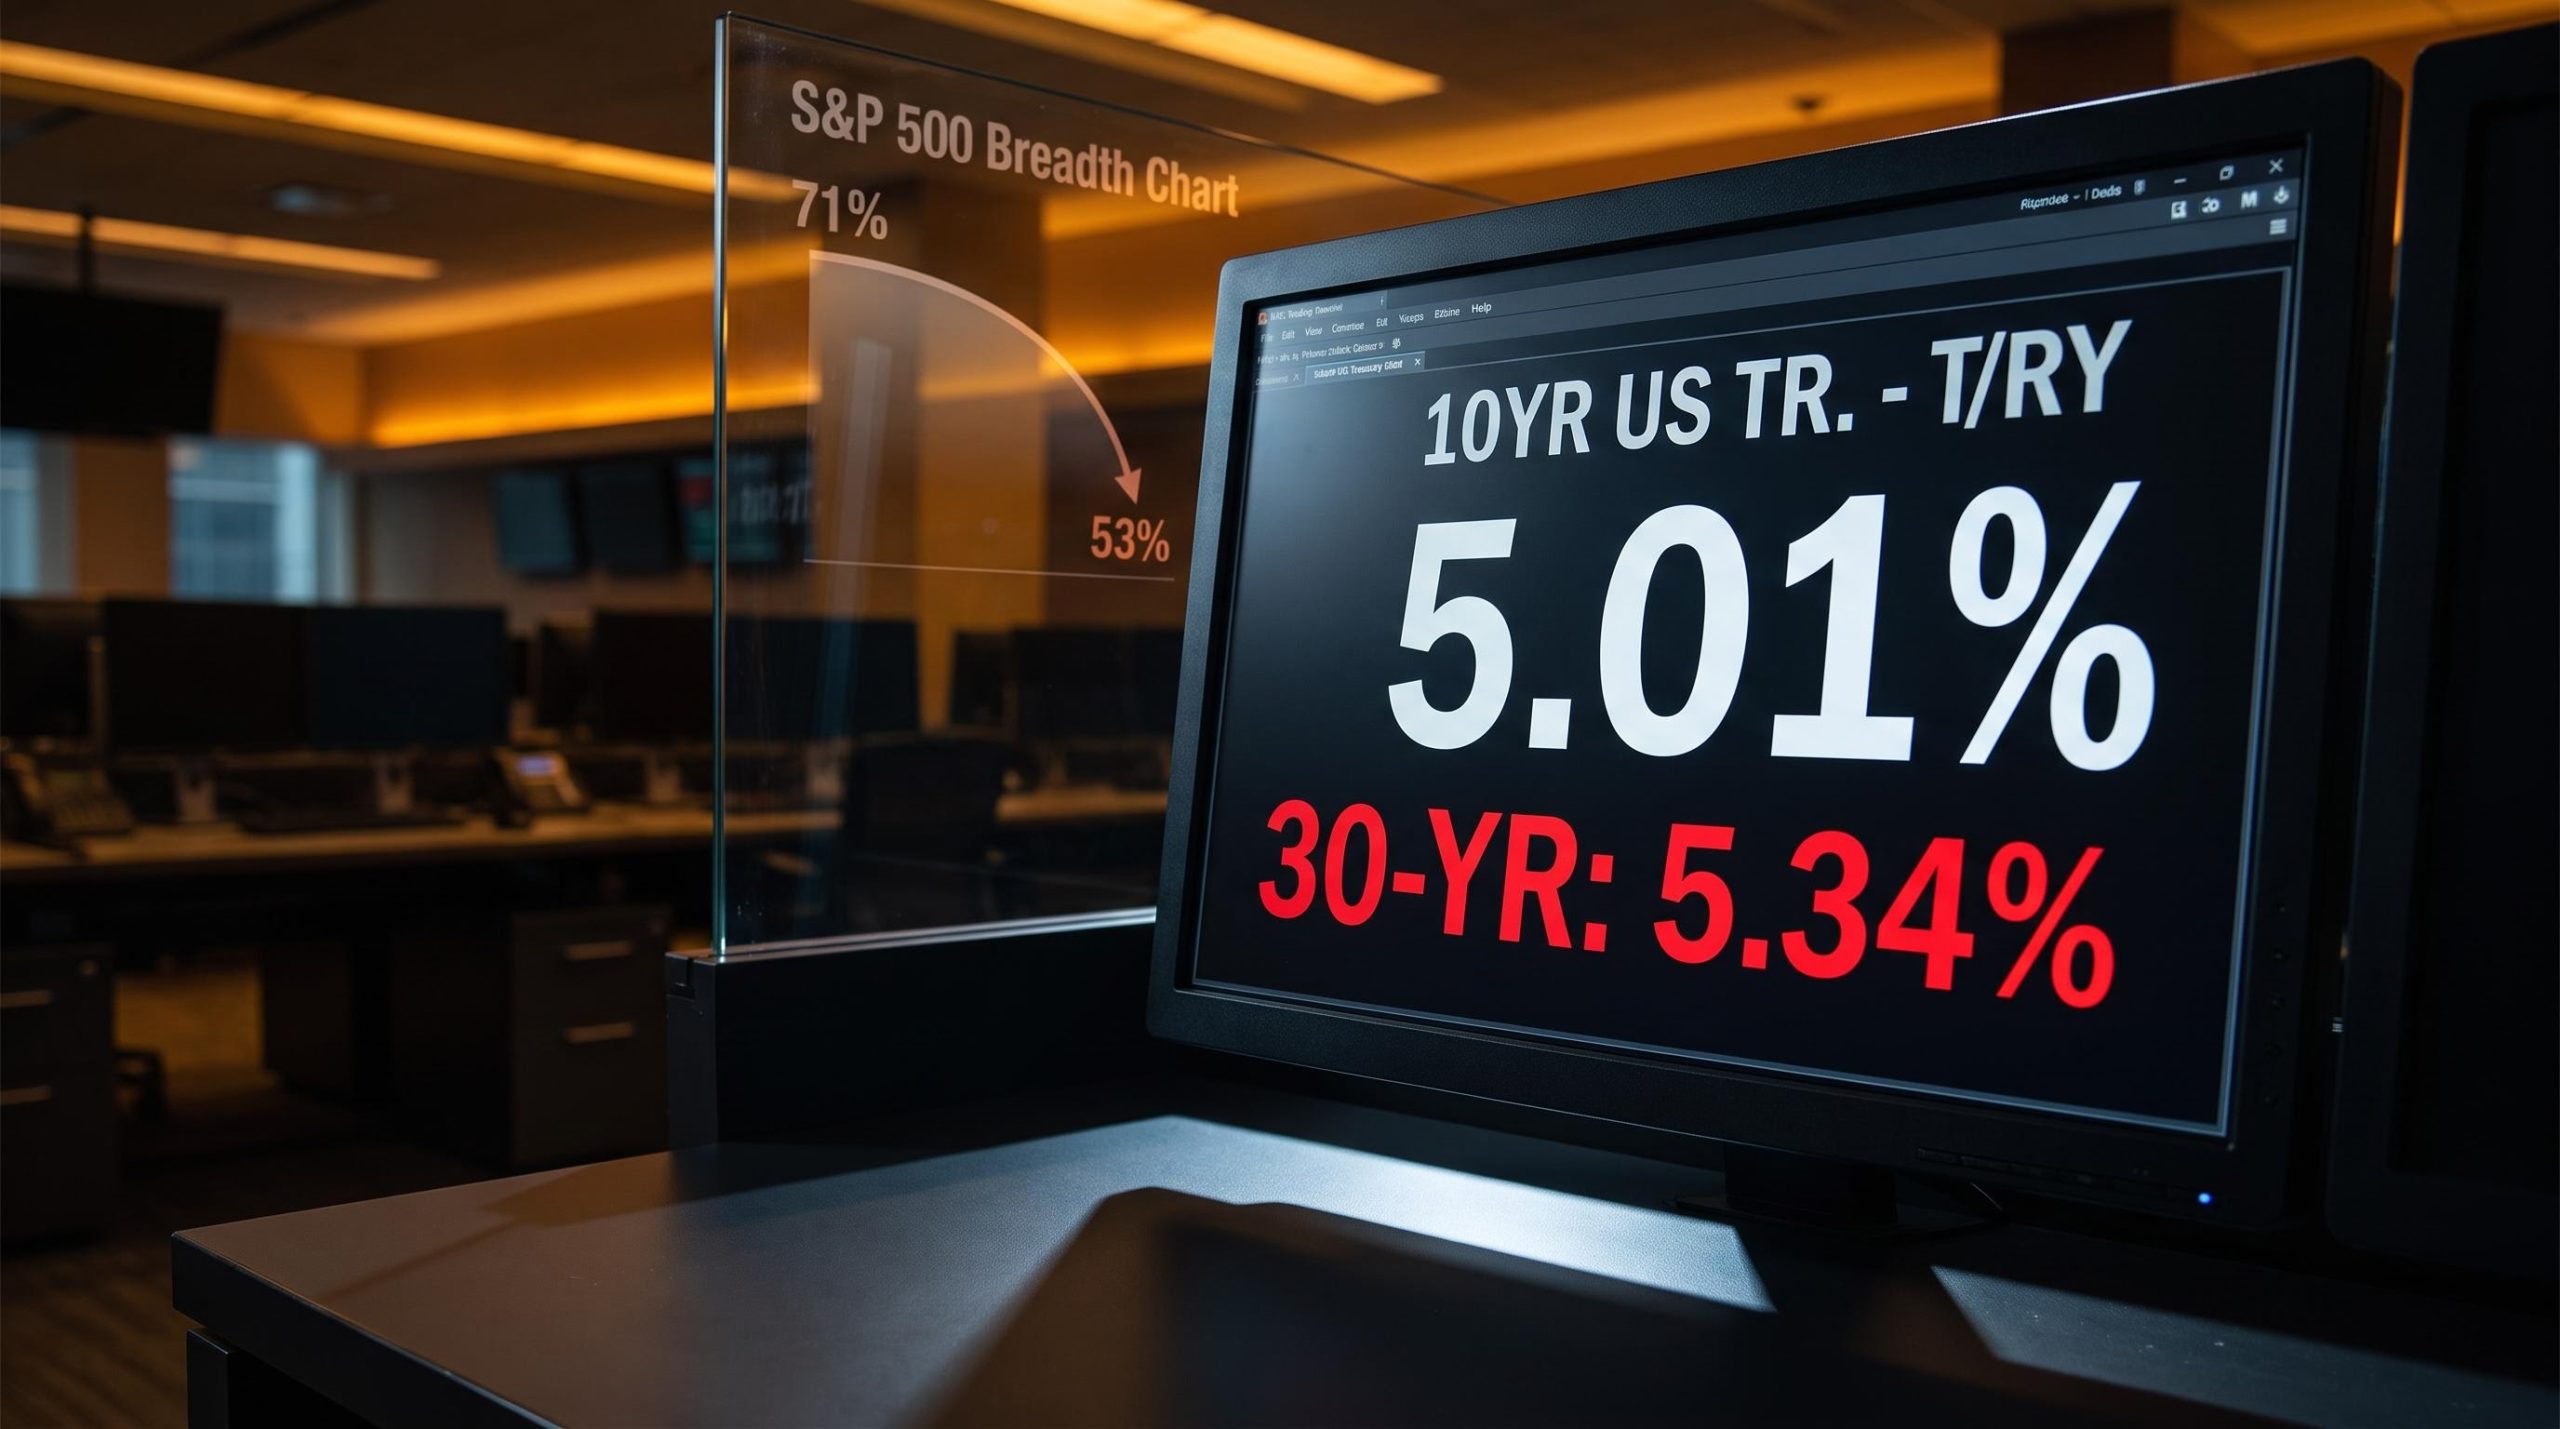
- US bond market repricing: US borrowing costs rose to roughly 5% for the first time since 2023 as the oil spike revived inflation fears, according to The Guardian.
- Emerging market import exposure: Import-dependent economies cannot offset higher oil bills through currency strength or domestic production, leaving them disproportionately exposed to prolonged elevation.
That second point is the one that travels furthest.
The inflation pass-through mechanisms are more pervasive than headline CPI captures: US diesel prices surged approximately 50% since February 2026 against a 26% rise in crude futures, because damaged Gulf refining infrastructure generated a separate scarcity premium in refined products that crude benchmarks do not measure, and energy costs embedded in imported goods appear in CPI as goods price increases rather than as the war-driven fuel costs they actually are.
US borrowing costs rose to “approximately 5% for the first time since 2023”
What this means for markets beyond crude
The bond market reaction is the tell. When fixed income starts repricing rate expectations off an oil shock, energy traders are no longer the only ones taking it seriously. The roughly US$10 per barrel rise in Brent over the prior week is expected to feed through into refined product prices and freight costs, and the 700,000 bpd of lost Yanbu throughput specifically hits European and Mediterranean refiners who sourced those barrels via the Red Sea.
There is a longer-horizon risk too. AGBI analysts warn that sustained attacks on oil infrastructure and airports threaten the credibility and financing of large-scale Saudi Vision 2030 projects, undermining the very investment environment the kingdom is trying to build.
If you hold exposure beyond energy equities, this is the takeaway: a sustained disruption shows up in inflation prints, rate decisions, freight costs, and emerging market debt dynamics. It has already stopped being a sector-specific story.
What changes the calculus, and what does not
Strip away the noise and three variables actually determine whether this deepens or eases. Each is a distinct watch item.
- Pipeline repair timeline. Argus Media puts repairs at several weeks, but that assumes no further strikes on the pumping stations. Renewed attacks push the outage back toward open-ended, and prices with it.
- Hormuz transit normalisation. Getting from the current ~14 ships per day back toward the 125 pre-war baseline requires Iranian cooperation, which no current diplomatic track guarantees. Until it recovers, the routing bottleneck holds.
- Houthi strike frequency. Escalation needs only one additional strike on the remaining infrastructure; de-escalation needs a sustained pause. The bar for things getting worse is lower than the bar for relief.
Some things do not shift the near-term calculus much:
- OPEC spare capacity can add barrels, but it cannot rebuild the routing flexibility the East-West pipeline provided or reopen Hormuz.
- Strategic reserve releases cushion price but do not solve the export-channel problem at the heart of this.
Here is the asymmetry to carry forward. Normalisation requires a cluster of conditions, a ceasefire, a pipeline repair, and a Hormuz reopening, to occur more or less together. Escalation requires just one more strike. With Brent at US$108.49, already above Goldman’s December base case, waiting for clarity is not cost-free; elevated prices are already transmitting into inflation and supply chains. Andrew Lipow’s word for the market’s muted reaction, “surprising,” captures the gap between the physical risk and the price.
The practical framework is simple: track pipeline repair progress, watch Hormuz transit data from Reuters, and read Goldman’s quarterly commodity updates. Those three sources will tell you how this is actually resolving, well before the headlines catch up.
This article is for informational purposes only and should not be considered financial advice. Investors should conduct their own research and consult with financial professionals before making investment decisions.
Past performance does not guarantee future results. Financial projections are subject to market conditions and various risk factors. These statements are speculative and subject to change based on market developments.