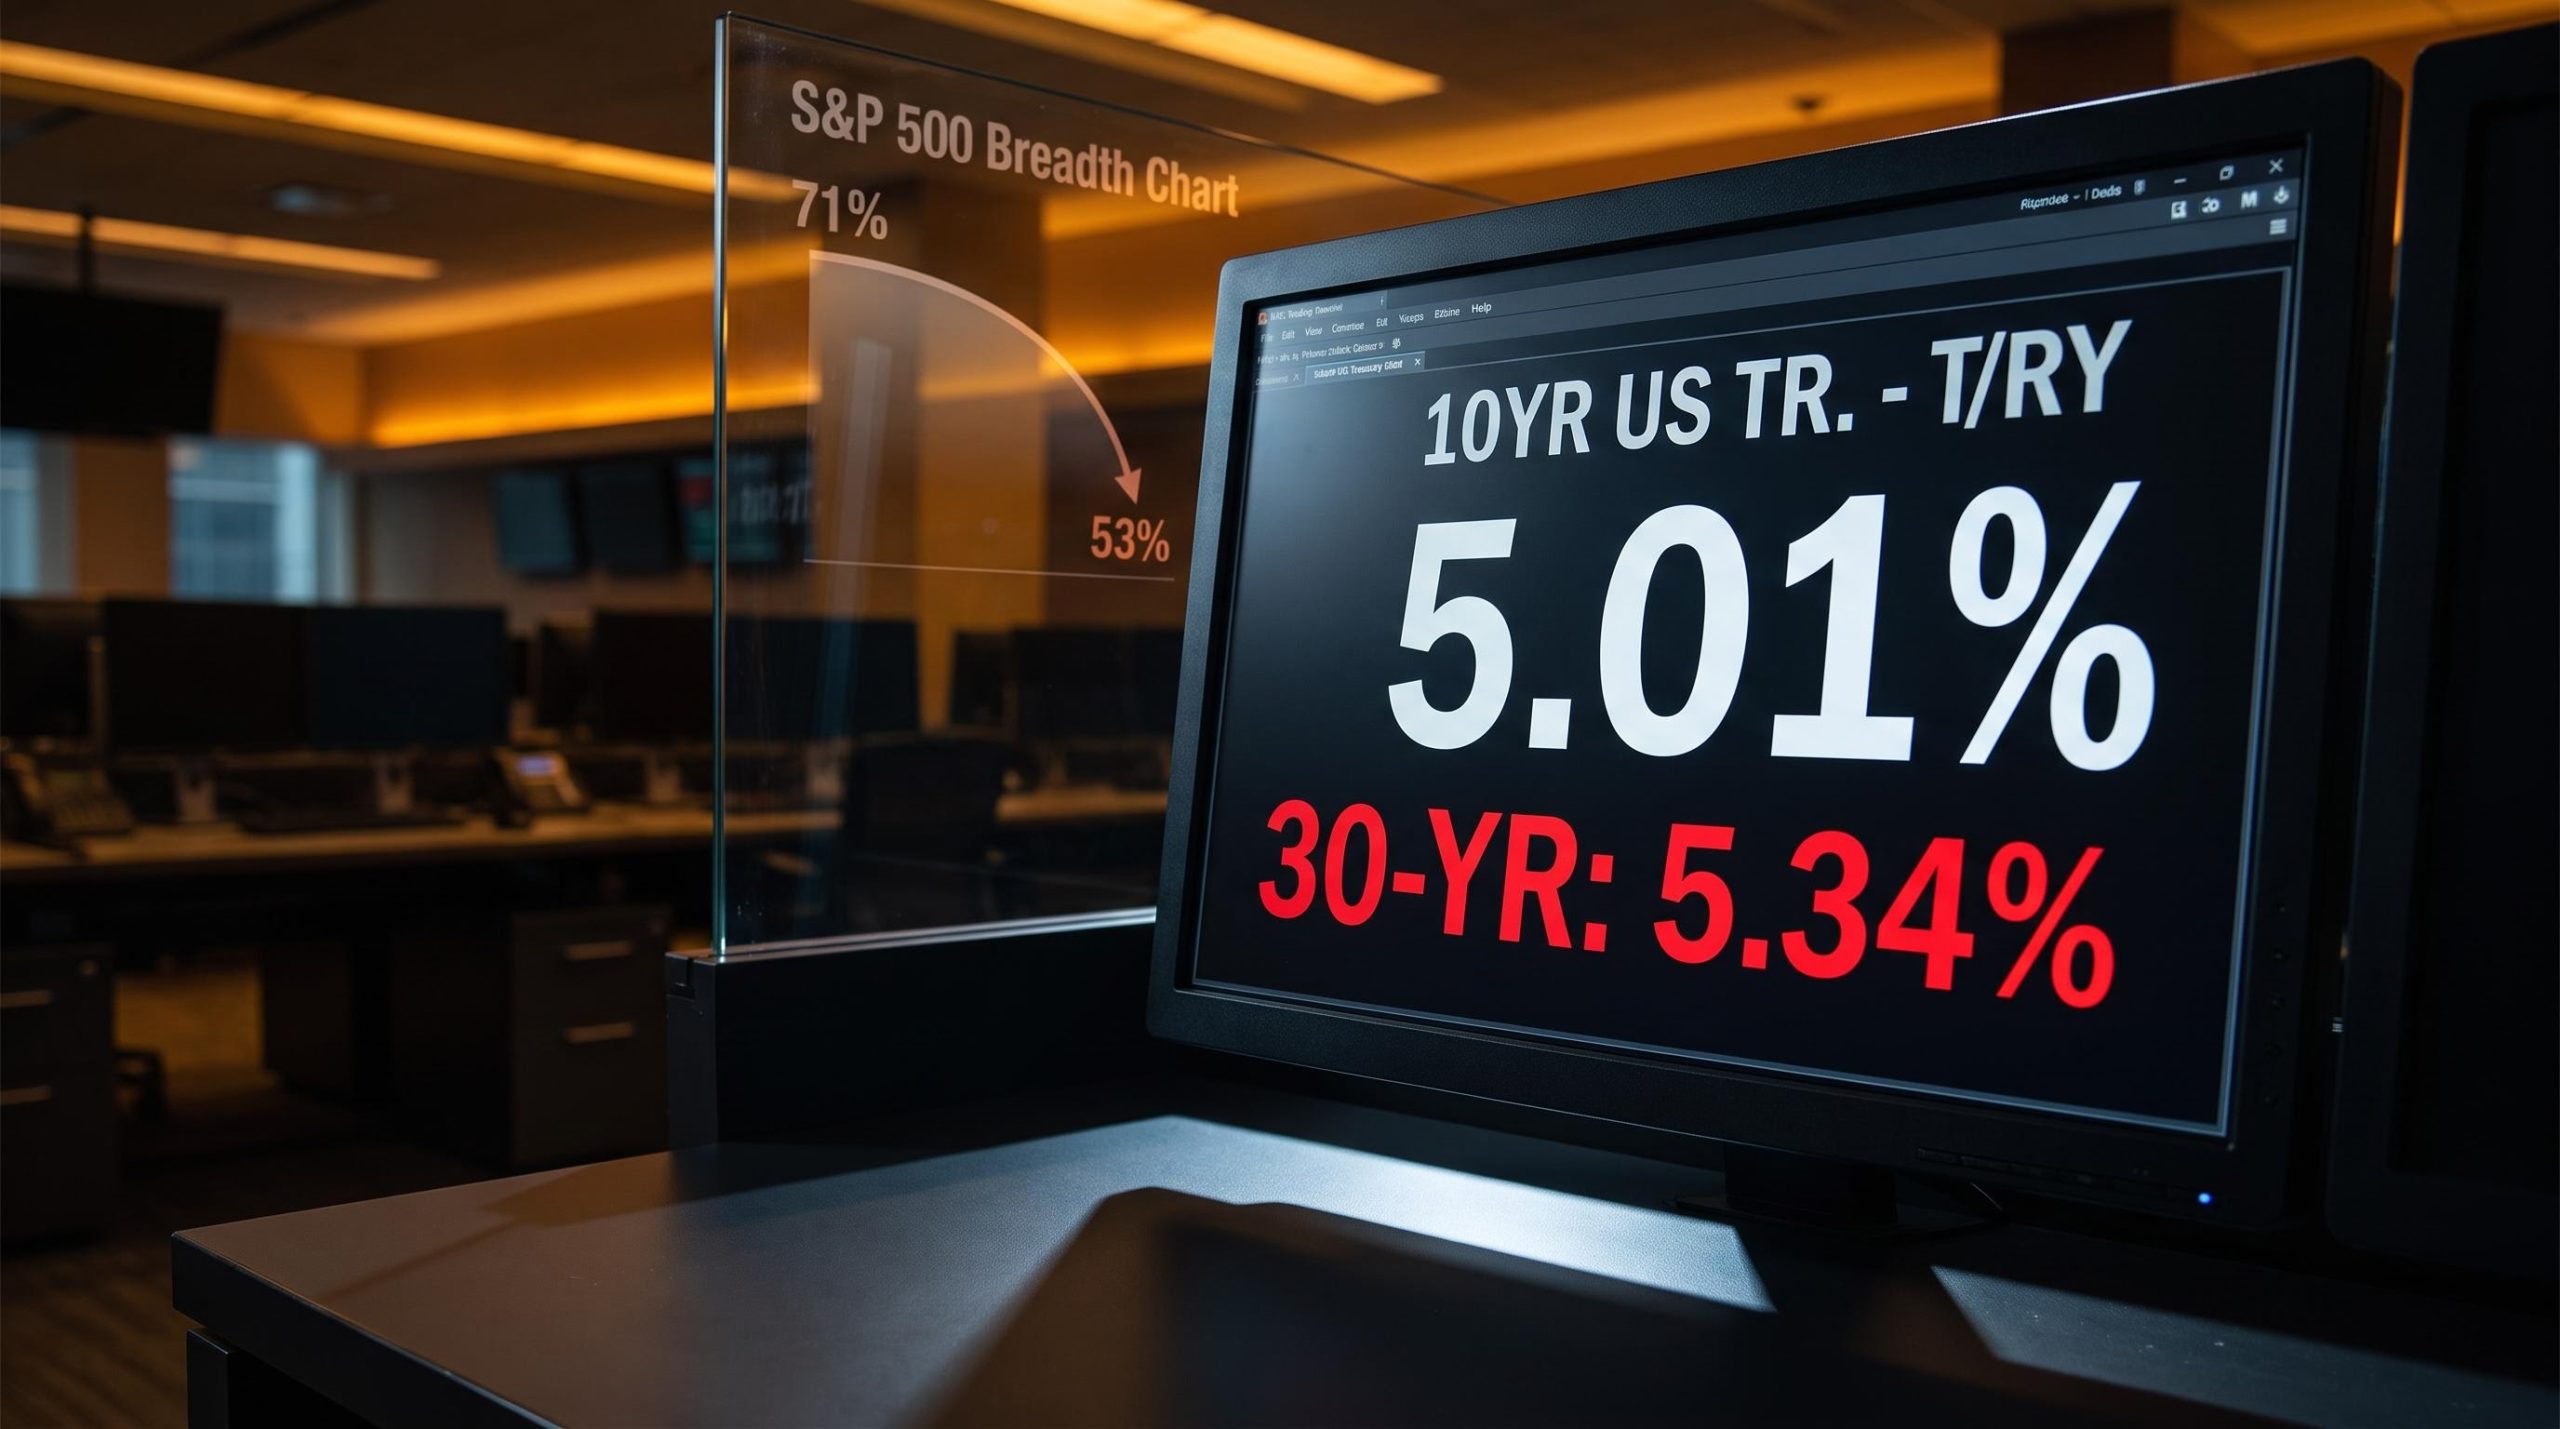
The 10-year Treasury yield has crossed 5% and the 30-year sits at 5.34%, and three separate policy interventions by Treasury Secretary Scott Bessent have not slowed the climb. Beneath index prices that still look resilient, the structure holding the market up is quietly changing.
Three warning signs are converging at once, each unremarkable on its own. Long-end yields are rising on term premium expansion rather than growth optimism. Equity breadth has shrunk from 71% to 53% of S&P 500 stocks above their 200-day moving average since late July, while realised volatility sits at levels that historically precede regime breaks rather than sustained calm.
For investors watching only index levels, the deterioration is easy to miss. This piece lays out what each signal measures, how the three interact to create a specific type of risk, and what the bullish counter-case requires to stay valid. After reading, you will know which variables to watch through Q4 and why the current setup demands more attention than headline index numbers suggest.
What is driving Treasury yields higher, and why policy cannot stop it
The most telling data point in the bond market right now is not a yield level. It is the fact that three deliberate attempts to hold yields down have failed.
Treasury Secretary Scott Bessent has tried three distinct interventions, each with a stated goal, and each followed by yields climbing anyway:
- A duration-shortening twist, aimed at pulling issuance toward shorter maturities to relieve pressure on the long end. Long-end yields kept rising.
- A bond buyback that fell short of its previously stated targets, which pushed the 30-year yield to surge rather than settle.
- A yen-purchase signalling move around 30 July 2026, using euros to buy yen in a relatively modest transaction meant to steady conditions. The climb continued.
By 11 September 2026, the 10-year constant-maturity yield stood at 4.96% according to FRED data (DGS10), breaching 5.01% around 14-15 September as reported by Bloomberg. The 30-year reached 5.34% on 14 September per FRED’s DGS30 series.
What this tells you is that the price of long-term money is not being set by the administration. It is being set by the people who actually hold the debt.
Term premium expansion measures the extra compensation bondholders demand for locking into long-dated debt rather than rolling short-term paper, and the mechanics of why that premium rises independently of growth expectations are central to reading the current yield environment correctly.
Why the private-sector-dominated market limits policy reach
The structural anchor The US Treasury market totals roughly $35 trillion, and approximately 75% is held by private sector investors, including hedge funds, rather than foreign governments.
When three-quarters of a market answers to private risk appetite, administrative signalling has limited traction. Bondholders are demanding higher compensation for inflation risk, and that demand is what term premium expansion measures: the extra yield investors want for holding long-dated debt rather than rolling short-term paper.
Berkshire Hathaway currently ranks among the top five holders of US Treasuries, a concrete illustration of who is genuinely setting the price. These are not entities that adjust behaviour because the administration calls for lower rates.
The clearest evidence that yields are rising for structural rather than energy-driven reasons sits in the divergence from oil. Crude reached close to $120 per barrel around March before retreating to roughly $65, yet long-end yields climbed steadily throughout. The two have decoupled, which points to term premium, not commodity inflation, as the driver.
The New York Fed term premium model, which decomposes long-end yields into expectations of future short rates and the pure compensation investors demand for duration risk, shows term premium expansion as the dominant force behind the current climb, separating it cleanly from any growth-optimism narrative.
There is a historical rhyme worth noting. Former Treasury Secretary Janet Yellen shifted issuance toward shorter maturities beginning 1 November 2023, a move that coincided with the Federal Reserve’s final rate-hike pause and a significant equity rally. The lesson bulls draw from that is that issuance strategy can work; the lesson the current data suggests is that it does not always.
For your positioning, the read is direct. When bondholders rather than central banks or administrations are setting the price of long-term money, you are in a rate environment that policy cannot reliably cap. That removes the safety-net assumption that intervention eventually succeeds, and it changes the calculation on how much you should pay for equity duration.
When big ASX news breaks, our subscribers know first
How rising yields compress the equity risk premium to a dangerous threshold
The mechanism connecting bond yields to stock prices is a discount rate. As long-term risk-free yields rise, the present value of earnings expected years from now falls. Expensive growth stocks, whose value depends most on distant cash flows, feel this first and hardest.
The question is how much cushion remains. The equity risk premium, the excess return investors demand for holding stocks over risk-free Treasuries, is the number that quantifies it. Right now that cushion is remarkably thin.
State Street Global Advisors quantified the equity risk premium at just 0.19% in June 2026.
An equity risk premium of 0.19% means the market is offering you almost no extra reward for holding stocks instead of government bonds. With yields still rising, that buffer is more likely to compress further than to widen, which makes the entry price for new equity exposure hard to justify on a risk-adjusted basis.
The threshold at which this becomes a cross-asset problem is where the analysis stops being theoretical. Here is how the leading estimates stack up.
| Strategist / Firm | ERP Estimate | Date | Key Threshold | Stated Implication |
|---|---|---|---|---|
| State Street Global Advisors | 0.19% | June 2026 | Rising yields | Almost no excess return over Treasuries |
| Societe Generale | ~3.5% | 2026 | 10-year above 4.5%-4.8% | Equity-bond correlation turns strongly negative |
| Matt Maley, Miller Tabak | Not stated | 2026 | Sustained break above 4.5%-4.8% | Meaningful problems across asset classes |
| Jonathan Krinsky, BTIG | Not stated | 2026 | 30-year nearing 6% | Market unprepared for a swift upward shock |
The Societe Generale figure is the structural switch to watch. When 10-year yields rise above 4.5%-4.8%, the correlation between equities and bonds turns strongly negative, meaning bonds stop cushioning equity drawdowns. For multi-asset investors, that changes how a portfolio behaves under stress, and the 10-year has now crossed that band.
Not everything cuts one way. FactSet reported on 8 May 2026 that analysts projected full-year 2026 S&P 500 earnings growth of 21.0% year-over-year. That is the fundamental offset the bulls lean on, and it is genuine. The tension is that strong earnings growth must be weighed against a valuation cushion that has nearly vanished. Rising earnings can carry a market; a 0.19% risk premium with yields still climbing tests how far that carrying capacity extends.
A negative equity risk premium, where the S&P 500 earnings yield falls below the 30-year Treasury yield, marks the most extreme version of the compression described here, and National Bank of Canada strategists have identified 5.5% on the 30-year as the threshold where equity market conditions become materially more difficult, a level the current reading of 5.34% is rapidly approaching.
What suppressed volatility and deteriorating breadth are actually measuring
Realised volatility is at historically low levels. On the surface, that looks reassuring. Calm markets, small daily moves, no drama. The problem is that market-structure analysts read this calm as a warning rather than a comfort.
The current suppression is comparable to conditions observed in 2007, before the global financial crisis, and to the period before the COVID-19 downturn. Both were quiet right up until they were not.
The reason quiet becomes dangerous is what it encourages beneath the surface. Long stretches of low volatility invite leverage and volatility-selling, which build up quietly and then unwind violently when a shock arrives.
Approximately $1.5 trillion in short-volatility exposure from systematic strategies and structured product issuers is mechanically suppressing measured volatility without reducing the underlying risk, which is the precise structural condition that makes the current calm historically comparable to the pre-2007 and pre-COVID regimes rather than genuine stability.
Breadth tells the same story from a different angle. Breadth measures how many stocks are actually participating in a rally, and the internal deterioration since summer has been sharp.
In late July 2026, roughly 71% of S&P 500 stocks traded above their 200-day moving average. By 15 September, that had fallen to 53%, or 262 of 498 members.
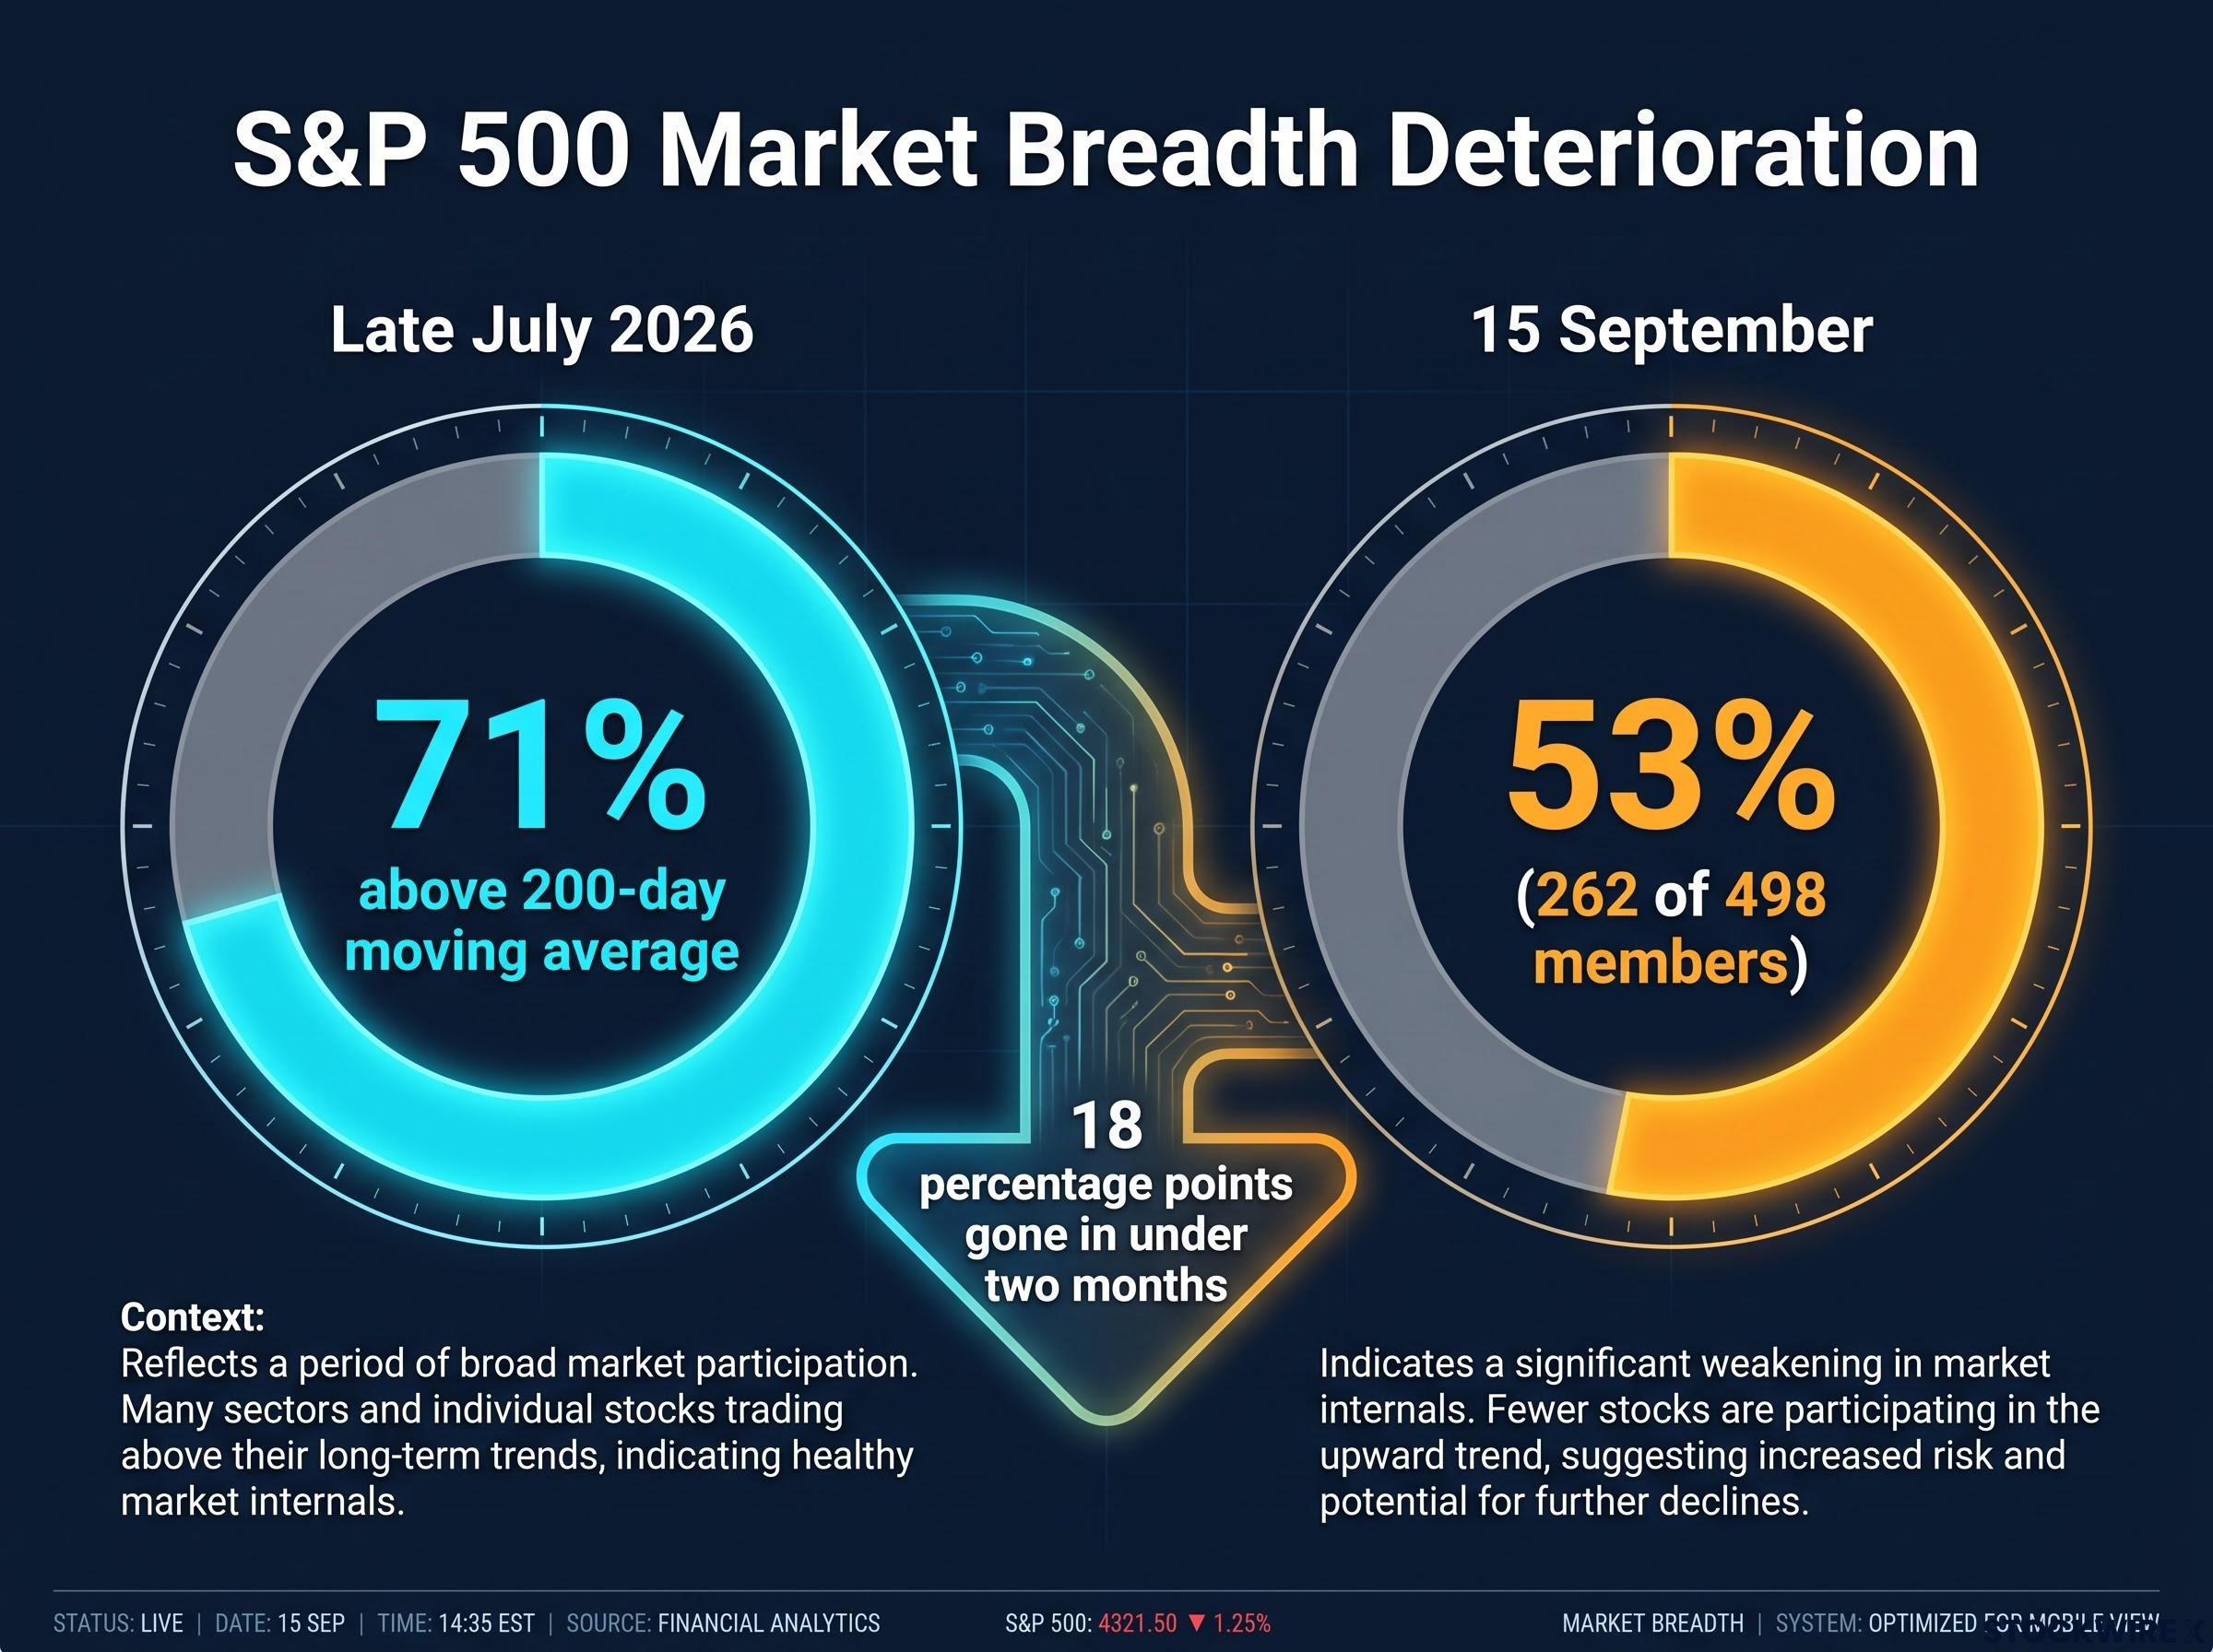
That is 18 percentage points of breadth gone in under two months, while index prices held near record levels. If you benchmark to the index, you are getting a false read on how much of the market is genuinely climbing. The index is masking a market that is quietly narrowing.
Momentum has faded almost everywhere outside energy, one of the few sectors still showing positive performance. Near-daily rotation between hardware and software names has become a volatility precursor: semiconductor stocks posted an approximate 100% price gain in Q2 before pulling back in Q3. That kind of whipsaw rotation is what a market looks like when leadership is thinning.
The mechanics of a volatility regime shift
Low volatility does not stay benign because systematic strategies respond to it mechanically. When calm persists, these strategies add exposure. When it breaks, they are forced to sell into the same falling market, each accelerating the one before it.
Here are the four amplifiers, ordered from slower-moving to faster:
- Volatility-targeting strategies increase equity exposure while volatility is low, then cut it rapidly the moment volatility spikes, mechanically selling into weakness.
- Risk-parity strategies allocate by risk contribution, so a volatility jump forces them to reduce equity holdings alongside the volatility-targeters, deepening the selling.
- CTA long unwinds hit next. Commodity Trading Advisors build large trend-following long positions during calm uptrends that must be dumped once negative momentum triggers are breached.
- Dealer short-gamma feedback loops are the fastest. When dealers are short gamma, a volatility spike forces them to trade in the direction of price moves, amplifying every swing intraday.
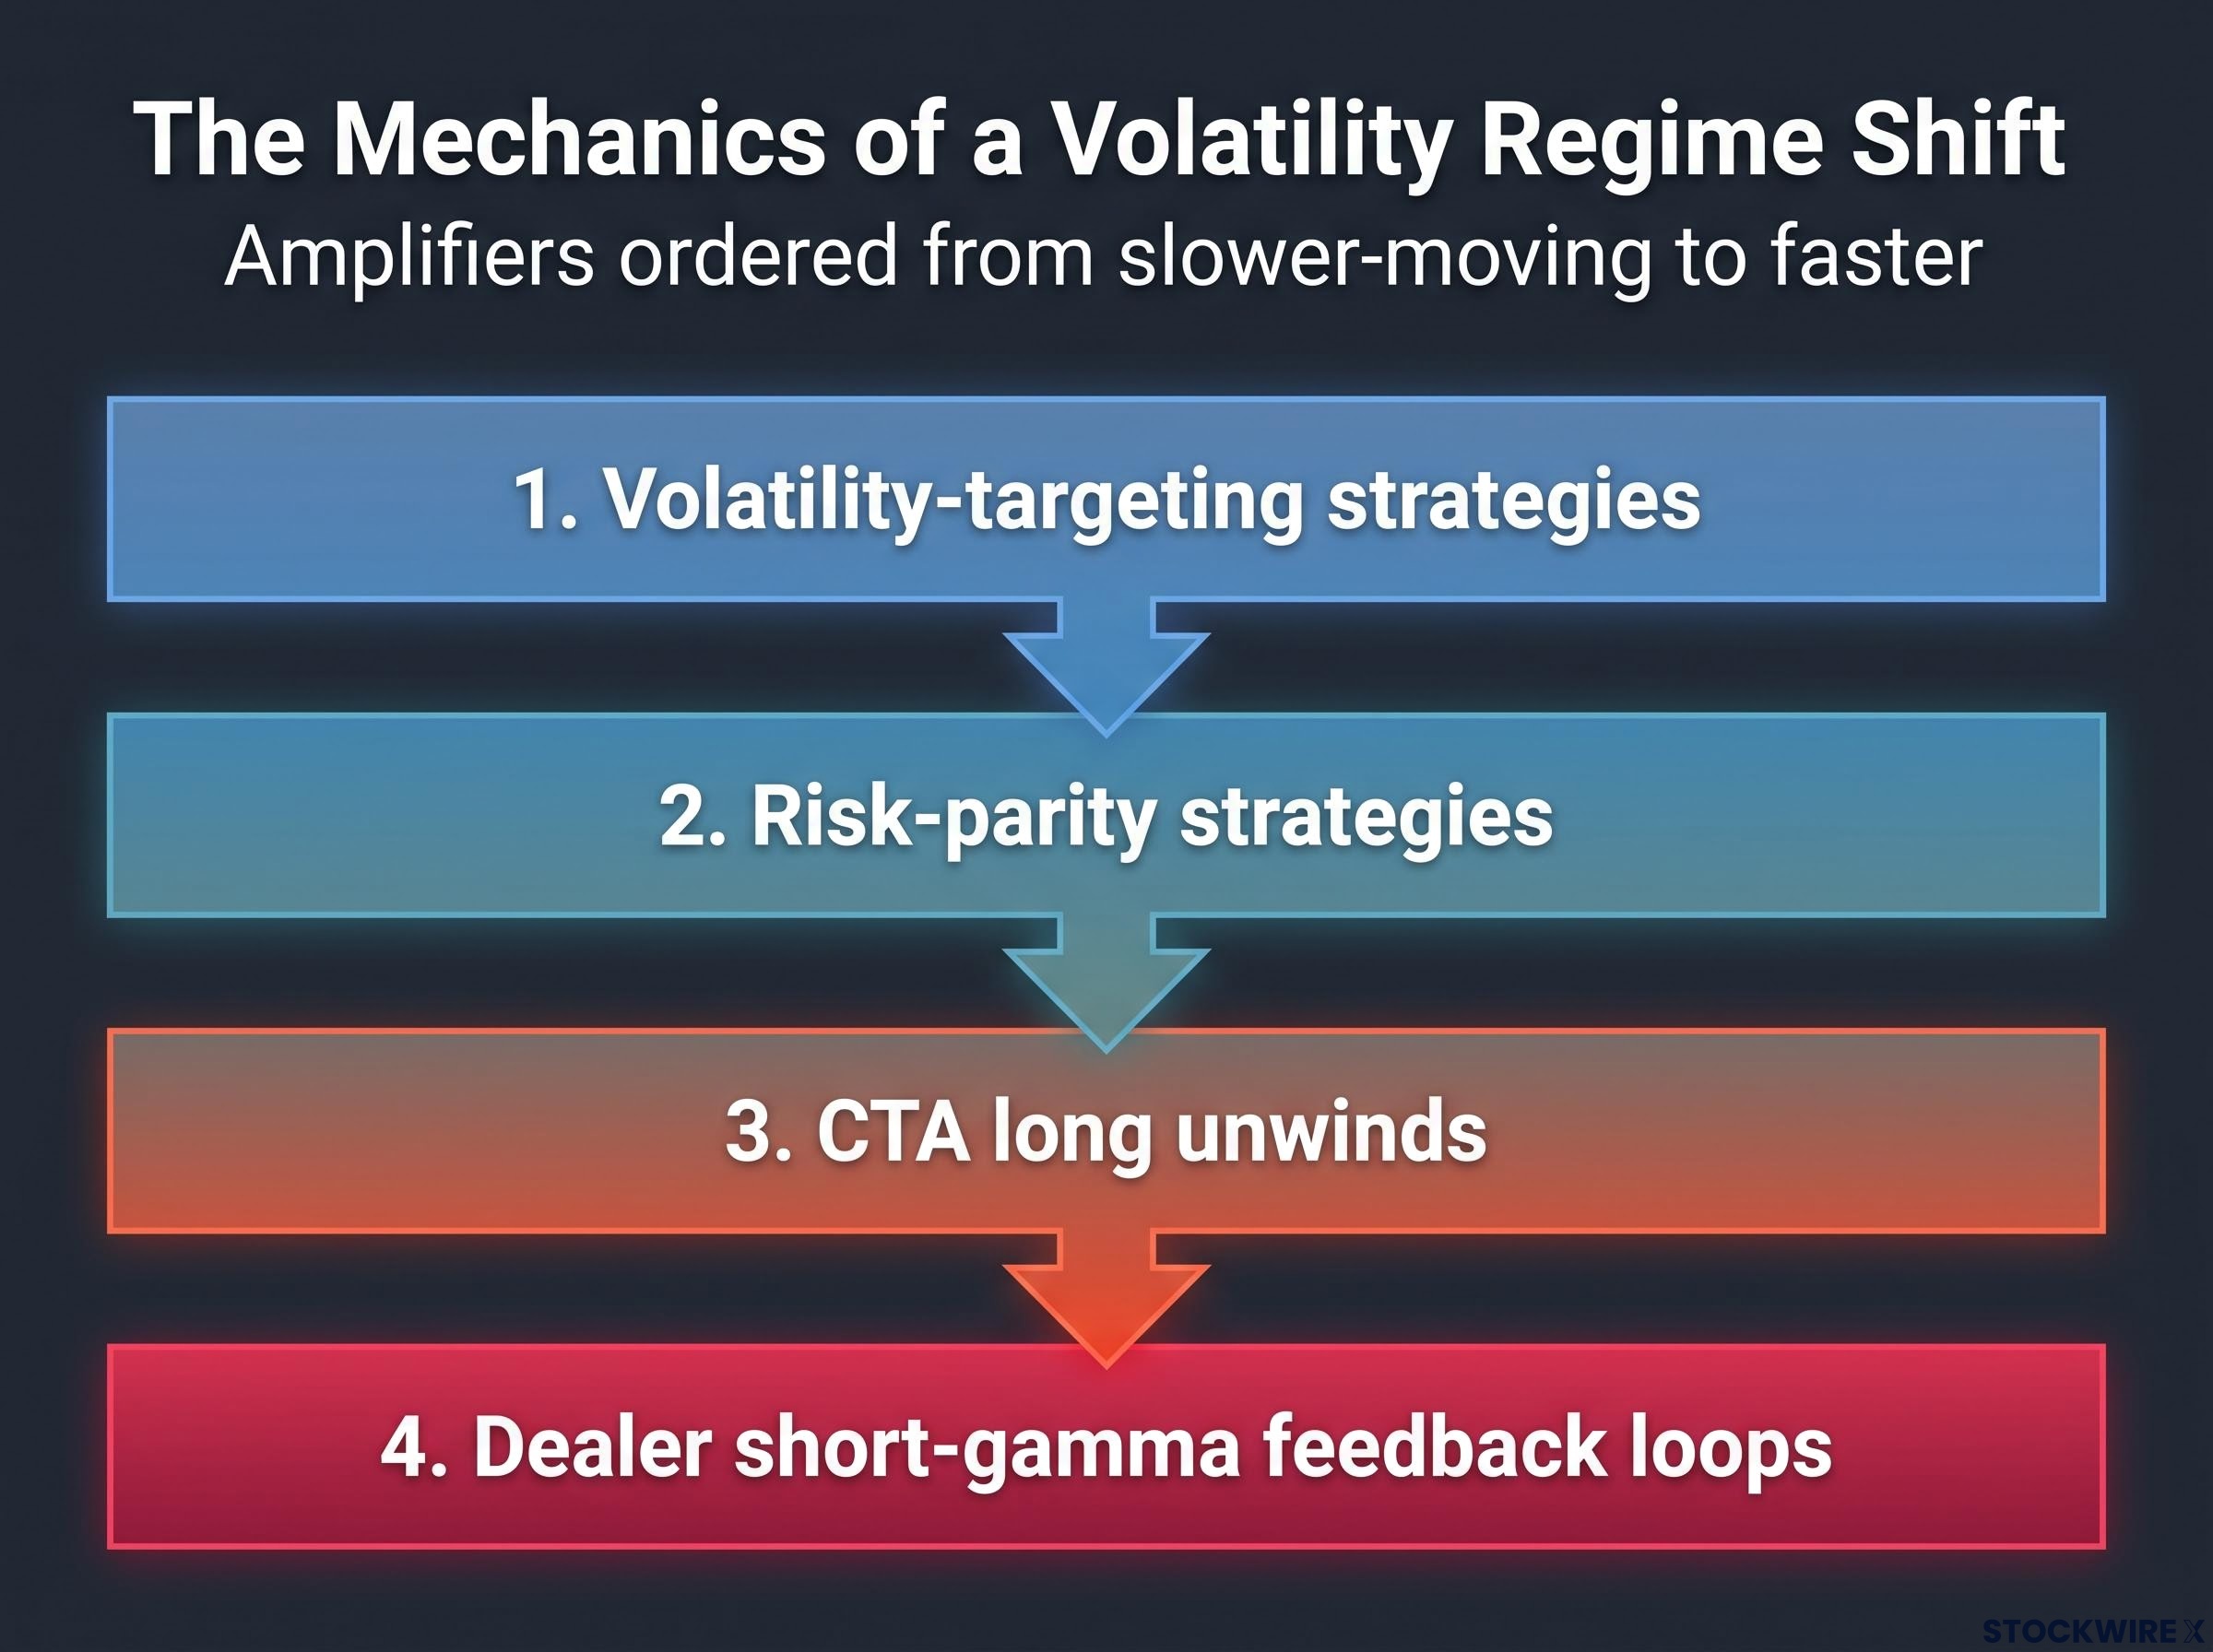
That sequence is why a volatility regime shift tends to be self-reinforcing rather than self-correcting. Each layer of forced selling triggers the next, and there is little on the way down to interrupt it.
The seasonal timing sharpens the point. Historically, the highest volatility levels of the year arrive between the current period and the end of October, coinciding with midterm election cycle patterns. A short-covering rally in April 2026 gave way to distribution over the summer, a recent reminder that stability can be false. The calm, in other words, is the signal, not the comfort.
The bullish counter-case and what it requires to hold
The bearish structural read is not the only credible view, and the bullish arguments deserve genuine weight rather than dismissal. The stronger question is not whether they are right but what each one needs to stay right.
The first pillar is earnings, specifically AI and mega-cap technology. Max Kettner, chief multi-asset strategist at HSBC, argues that strong technology and AI-linked earnings have helped US equities weather higher yields. JPMorgan Asset Management and Capital Economics similarly point to robust AI-related results supporting broad risk appetite.
The second is the nature of the yield rise itself. UBS and Franklin Templeton emphasise that higher yields raise the hurdle for equities but are not automatically negative. When yields reflect solid nominal growth rather than fiscal stress or runaway inflation, stocks can still perform.
The third is breadth of fundamentals beyond the mega-caps. PNC stresses earnings strength in financials and industrials, supporting a grind-higher environment that does not depend solely on a handful of AI names.
Each argument is testable. Here is what each requires to hold.
| Bullish Argument | Supporting Firm / Strategist | Required Condition to Hold | Key Risk if Condition Fails |
|---|---|---|---|
| AI and mega-cap earnings strength | HSBC (Max Kettner), JPMorgan AM, Capital Economics | Q4 mega-cap tech guidance stays strong on capex and revenue | Removes the one factor letting equities tolerate current yields |
| Healthy rather than destructive yields | UBS, Franklin Templeton | Yields reflect nominal growth, not fiscal stress or inflation | Term premium driven by fiscal risk breaks the “healthy” framing |
| Broad fundamental resilience | PNC | Financials and industrials sustain earnings beyond AI | Narrowing breadth leaves the index dependent on a few names |
The load-bearing pillar is AI earnings. If mega-cap technology guidance decelerates in Q4, it removes the one factor that has allowed equities to tolerate yields at these levels, which makes the coming earnings season close to a binary event for the thesis.
History offers cases on both sides. These four setups mirrored current conditions and resolved differently:
- 2006-2007: Suppressed volatility and rising long-end yields resolved in crisis once credit stress broke the equilibrium.
- 1999-2000: Narrow, large-cap-led breadth and compressed risk premia gave way to a sharp correction.
- 2017-early 2018: Extremely low volatility and popular volatility-selling ended in an abrupt spike, Volmageddon, that exposed the fragility.
- 2020-2022: A narrow mega-cap AI-adjacent rally with deteriorating breadth eventually rolled into the 2022 bear market.
Counter-examples exist too, where accommodating policy and strong earnings let markets grind higher safely. That is precisely why this is a watchlist, not a verdict.
For investors wanting to stress-test the bullish case in full before forming a view, our deep-dive into the Q4 rally thesis examines the institutional positioning data, the historical frequency of year-end gains when markets enter September up more than 5%, and the three specific downside risks that could prevent the seasonal tailwind from materialising.
What to watch through Q4 before repositioning
You do not need to predict which way this resolves. You need a set of conditions to monitor, which is a more disciplined and less reactive way to manage the risk than trying to call the top.
The four analytical threads above collapse into four observable variables, each with a threshold that tips it from “bullish intact” to “regime shift”.
| Signal Category | Current Level | Watch Threshold | Implication if Breached |
|---|---|---|---|
| 10-year Treasury yield | ~5.01% (14-15 Sept) | Sustained hold above 5%, climb toward 5.3%-5.5% | Stress escalation, further valuation compression |
| 30-year Treasury yield | 5.34% (14 Sept) | Nearing 6% (BTIG’s Krinsky level) | Major structural risk, market unprepared for shock |
| Equity breadth | 53% above 200-day (15 Sept) | Deterioration below 50% | Rally increasingly dependent on a few names |
| Q4 mega-cap tech guidance | Awaiting earnings season | Any AI capex or revenue deceleration | Removes the pillar letting equities tolerate yields |
Seasonal note: the period from now through the end of October has historically produced the year’s highest volatility, a pattern linked to the midterm election cycle. That places this monitoring window at the point of maximum seasonal fragility.
One backstop is worth keeping in view. The Treasury General Account holds roughly $950 billion available for liquidity deployment if financial stress escalates, a buffer that could soften a disorderly move without changing the structural drivers behind it.
This article is for informational purposes only and should not be considered financial advice. Investors should conduct their own research and consult with financial professionals before making investment decisions. Past performance does not guarantee future results, and financial projections are subject to market conditions and various risk factors. These statements are speculative and subject to change based on market developments.
Monitoring these four variables through Q4 puts you in a position to act on evidence rather than sentiment. That is the practical difference between informed positioning and reactive decision-making, and in a seasonal window this fragile, it is the difference that matters most.