Here is a puzzle that should trouble anyone who treats the VIX as a straightforward fear gauge. The single most-watched volatility number in global markets has meant opposite things at different moments over the past decade. A spike that once flashed “buy” later flashed “danger,” and now appears to be flashing “buy” again.
That is not a market curiosity. If you have been trained to treat a jumping VIX as a contrarian entry point, you may be following a rulebook that expired years ago, or one that has only recently been reinstated. The relationship between the VIX and the returns that follow it has passed through at least three structurally distinct phases, and the same reading implies very different forward prospects depending on which phase is active.
As of September 2026, recent analysis suggests the classical contrarian signal has returned after an interruption of roughly eight years. This piece gives you a more conditional interpretive lens for the VIX forward market indicator, one that accounts for which regime you are operating in and what structural forces are shaping the signal today. After reading it, you will know what questions to ask before acting on the next spike.
What the VIX actually measures, and why “fear gauge” undersells it
Pull up the VIX on any screen and you see a single number, usually somewhere between 12 and 40, occasionally exploding past 80. It looks like a thermometer for panic. The reality beneath it is more specific, and more contestable, than the popular label suggests.
The VIX is a forward-looking measure of implied volatility, meaning it captures how much price movement traders expect over the coming month, not how much has already happened. It is derived from the prices of options on the S&P 500 (SPX). Crucially, it uses options with 23-37 days to expiry.
The VIX is a forward-looking measure of implied volatility, meaning it captures how much price movement traders expect over the coming month, not how much has already happened.
Hold on to that calculation window, because it matters throughout the rest of this article. It is the structural reason the headline VIX can be technically elevated or suppressed by derivative flows that have little to do with genuine macro fear.
The “fear gauge” nickname captures one real component: demand for protection. When investors rush to buy insurance against a fall, option prices rise and the VIX climbs. What the label obscures is that structural hedging flows and the plumbing of the options market can move the number independently of whether anyone is actually afraid.
For most of market history, a VIX spike connected to positive forward returns through a three-phase mechanism:
- Risk-aversion and forced deleveraging: Intense demand for protection and forced selling by leveraged investors push valuations below fundamental value.
- Risk-premium widening: The extra return investors demand for holding equities becomes unusually high, rewarding those who supply risk capital once stress peaks.
- Mean reversion in volatility and prices: As panic fades, implied volatility falls and prices recover, delivering above-average returns from compressed entry points.
The cleanest modern illustration is the COVID crash. According to unverified sourcing, the VIX reached its highest recorded level during that episode.
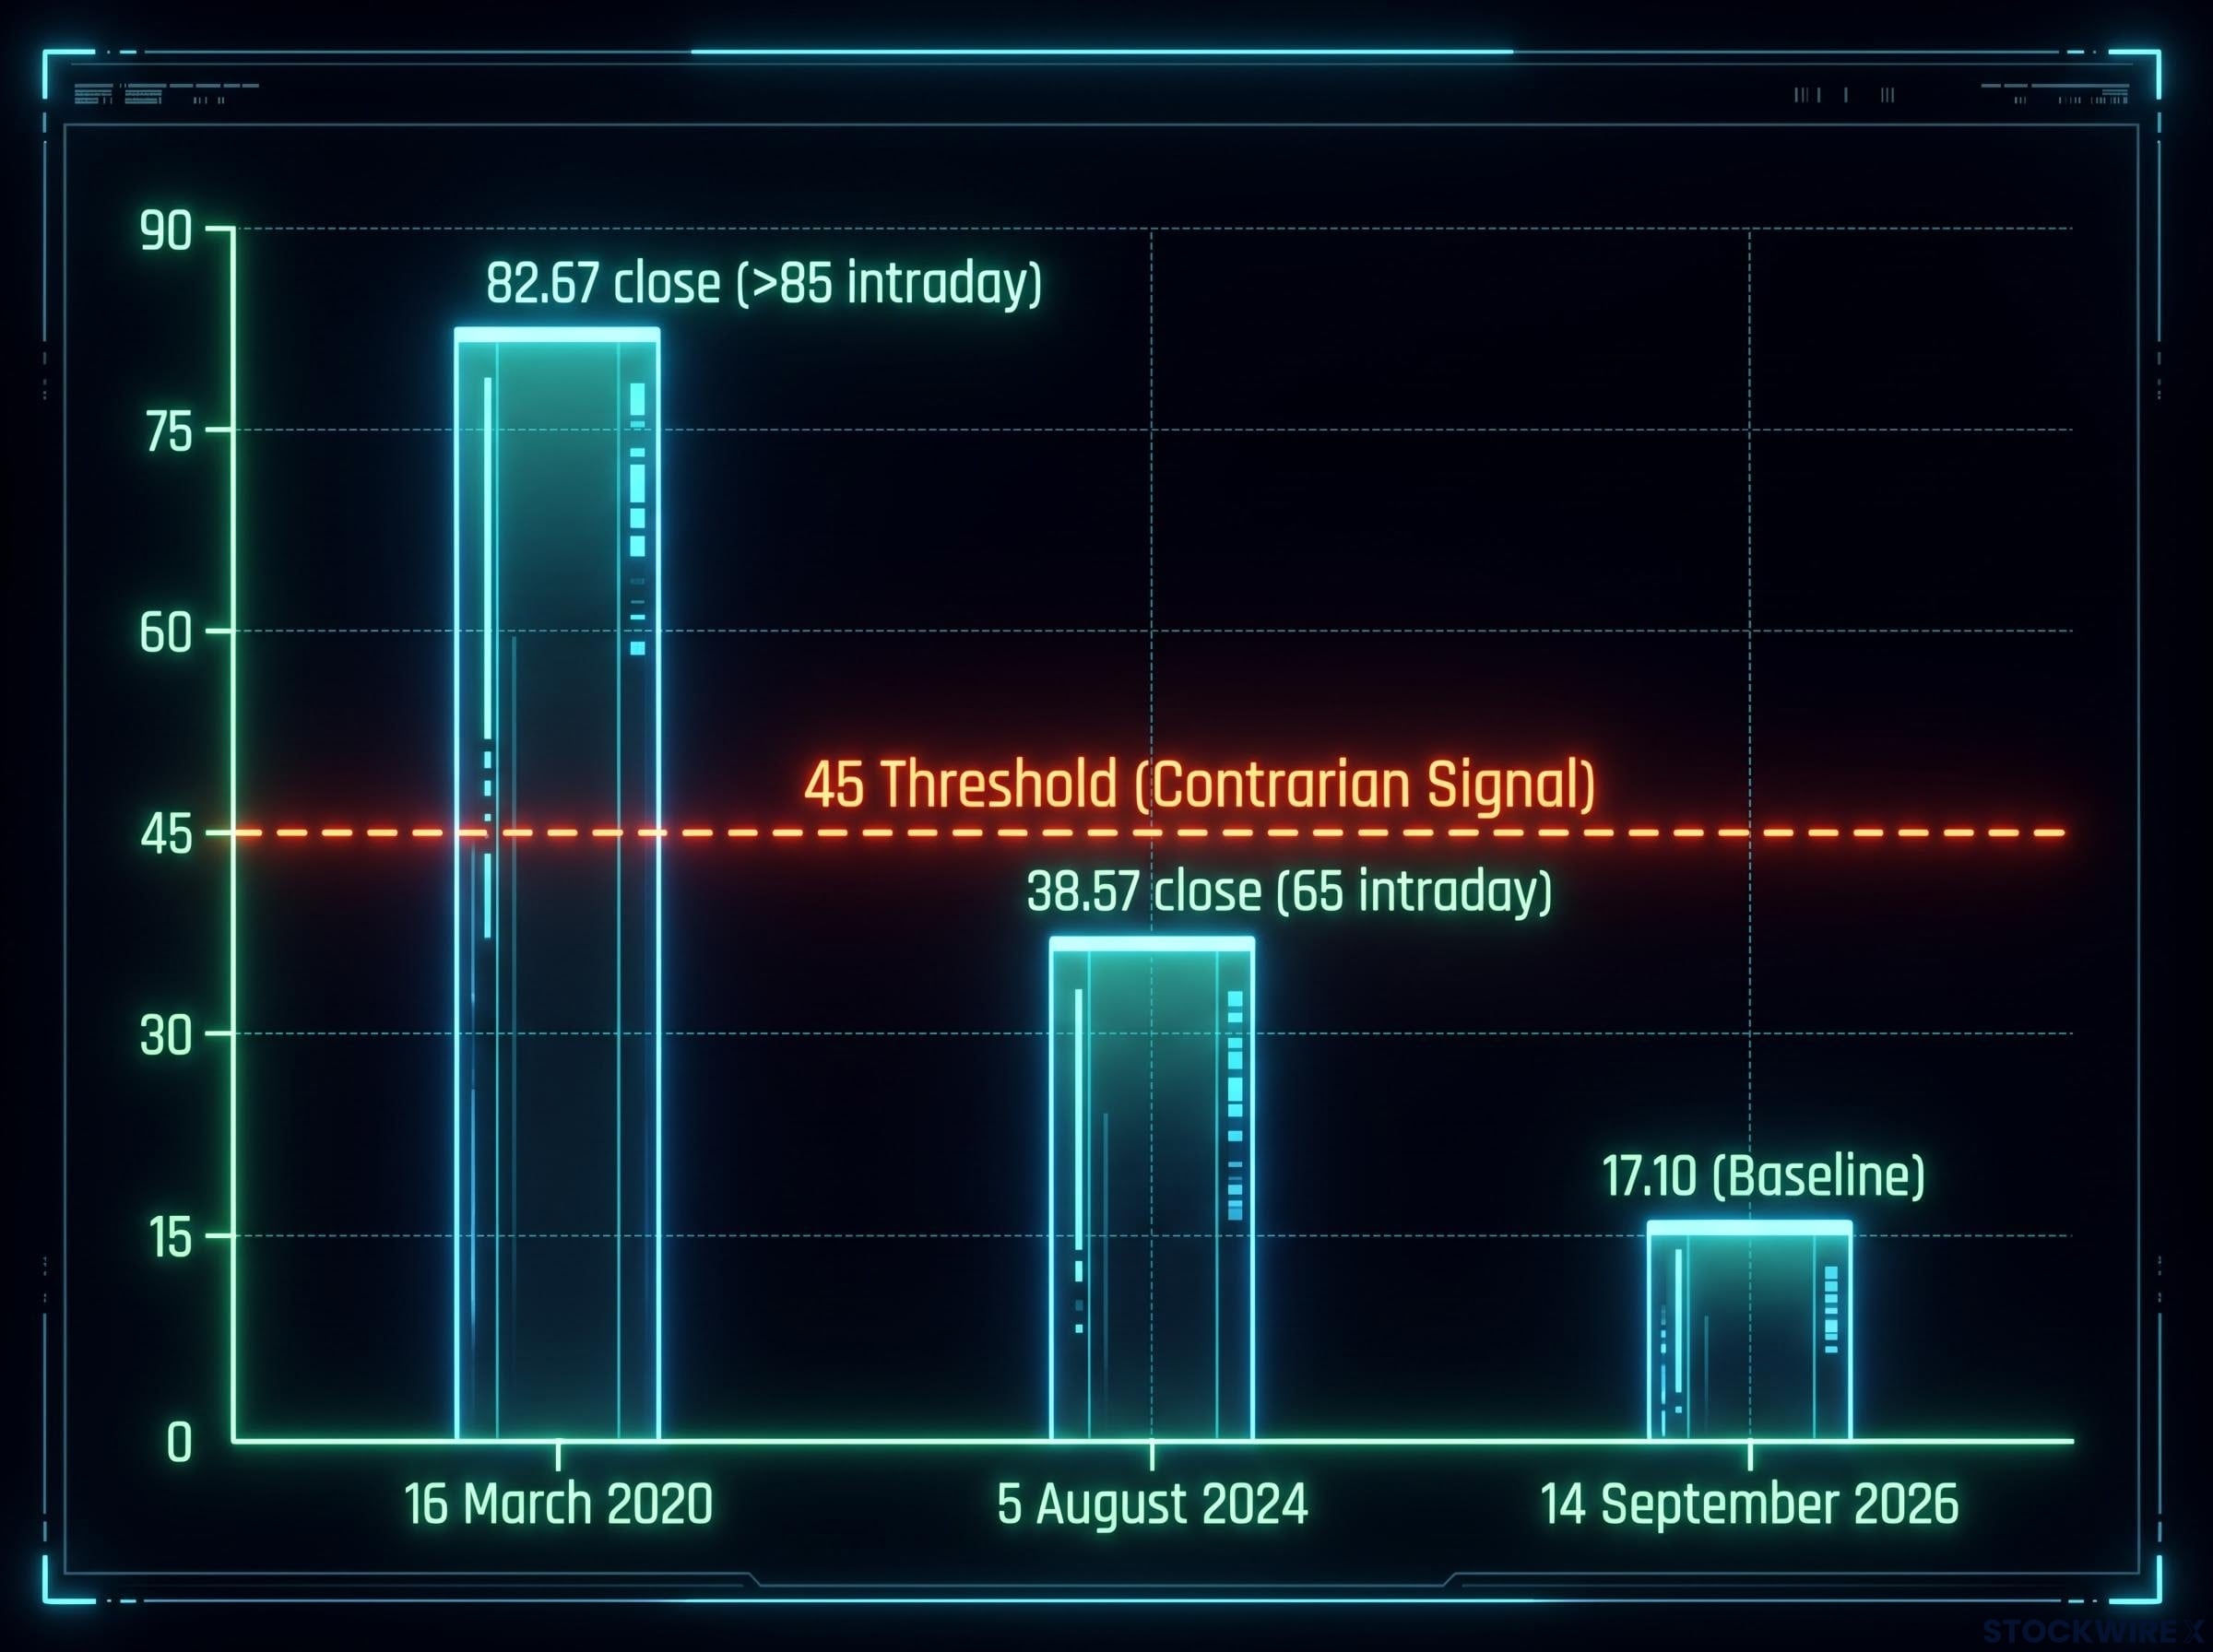
March 2020 peak The VIX recorded 82.67 on 16 March 2020, with intraday prints above 85, followed by a powerful multi-year equity rally that matched the classical positive-forward-return pattern.
If you treat the VIX as a simple sentiment meter, you are missing the engineering beneath it. Understanding what the number actually measures is the prerequisite for knowing when to trust it and when to discount it.
When big ASX news breaks, our subscribers know first
Three regimes, three different meanings for the same spike
The same VIX reading has not always carried the same message. To see why, walk through three periods in sequence and let the pattern shift do the talking.
Before roughly 2017, the VIX behaved as a dependable contrarian indicator. Spikes reliably preceded positive three-month forward equity returns, exactly as the forced-deleveraging and mean-reversion mechanism predicts. Panic created discounts, and patient capital was rewarded.
Then the relationship inverted. Between roughly 2017 and 2025, volatility spikes began correlating with increased forward risk rather than improved return prospects. The rulebook that a generation of retail investors had internalised quietly stopped working.
The inversion years (2017-2025)
What changed was the machinery around the number. Dealer hedging flows and a proliferation of volatility-linked products altered how the VIX responded to stress, so a spike could reflect derivative-market mechanics rather than a genuine buying opportunity.
For anyone carrying the old contrarian playbook into this period, this is the operationally important part. The rule did not merely underperform; it reversed. Buying spikes on autopilot could have meant buying into rising risk rather than fading fear.
The August 2024 episode shows how easily technical structure alone can manufacture a VIX explosion. According to unverified sourcing, the VIX touched 65 intraday and closed at 38.57 on 5 August 2024, triggered by a Bank of Japan rate hike, yen carry-trade unwinds, and a weak U.S. jobs report.
“Huge overreaction” UBS strategist Gerry Fowler characterised the August 2024 spike as a “huge overreaction” driven by positioning and poor liquidity, not by macro capitulation.
Has the classical signal returned?
Over the past year, the earlier pattern appears to have re-emerged. A February 2026 preprint study, “Predictive Signals from VIX Spikes: A Comparative Study of Linear and Nonlinear Models” (unverified), found that extreme VIX events provide statistically significant positive average equity returns over 3-month and 12-month horizons.
The catch is the threshold. The evidence is strongest at readings above 45, a far higher bar than the mid-teens or twenties many casual contrarians treat as a spike. A brief September 2026 move, where the VIX jumped from 14.92 to 16.34 on 1 September 2026 before retracing to 15.20 the next day (unverified), does not remotely qualify.
| Period | VIX spike interpretation | Forward return signal | Representative episode |
|---|---|---|---|
| Pre-2017 | Classical fear signal | Positive (contrarian buy) | Long-standing pattern |
| 2017-2025 | Inverted / technical stress | Increased forward risk | August 2024 spike |
| Post-2025 | Contrarian signal re-emerging at extremes | Positive above 45 | February 2026 study findings |
The core error this article addresses is treating the contrarian signal as a permanent feature of markets. It is regime-dependent. Identify which regime is active, and you change what a spike means to you.
SSRN research on high-VIX regime dynamics supports the view that market state fundamentally conditions how a spike translates into forward returns, with sentiment persistence behaving asymmetrically across calm and stressed periods in ways that make a single universal contrarian rule unreliable.
Why the signal shifted: two competing structural explanations
Analysts and institutions offer two genuinely competing explanations for why the VIX behaves differently now. Neither is settled, and the tension between them is itself worth understanding.
The mainstream institutional view points to market microstructure and hedging flows. Under this thesis, the number has been reshaped by how modern derivative products are traded and hedged, not by any deliberate management of markets. The specific forces cited include:
- Structured-product hedging: A March 2024 Bank for International Settlements (BIS) Quarterly Review (unverified) argued that dealers hedging yield-enhancing structured products have dampened realised volatility, artificially compressing the baseline VIX.
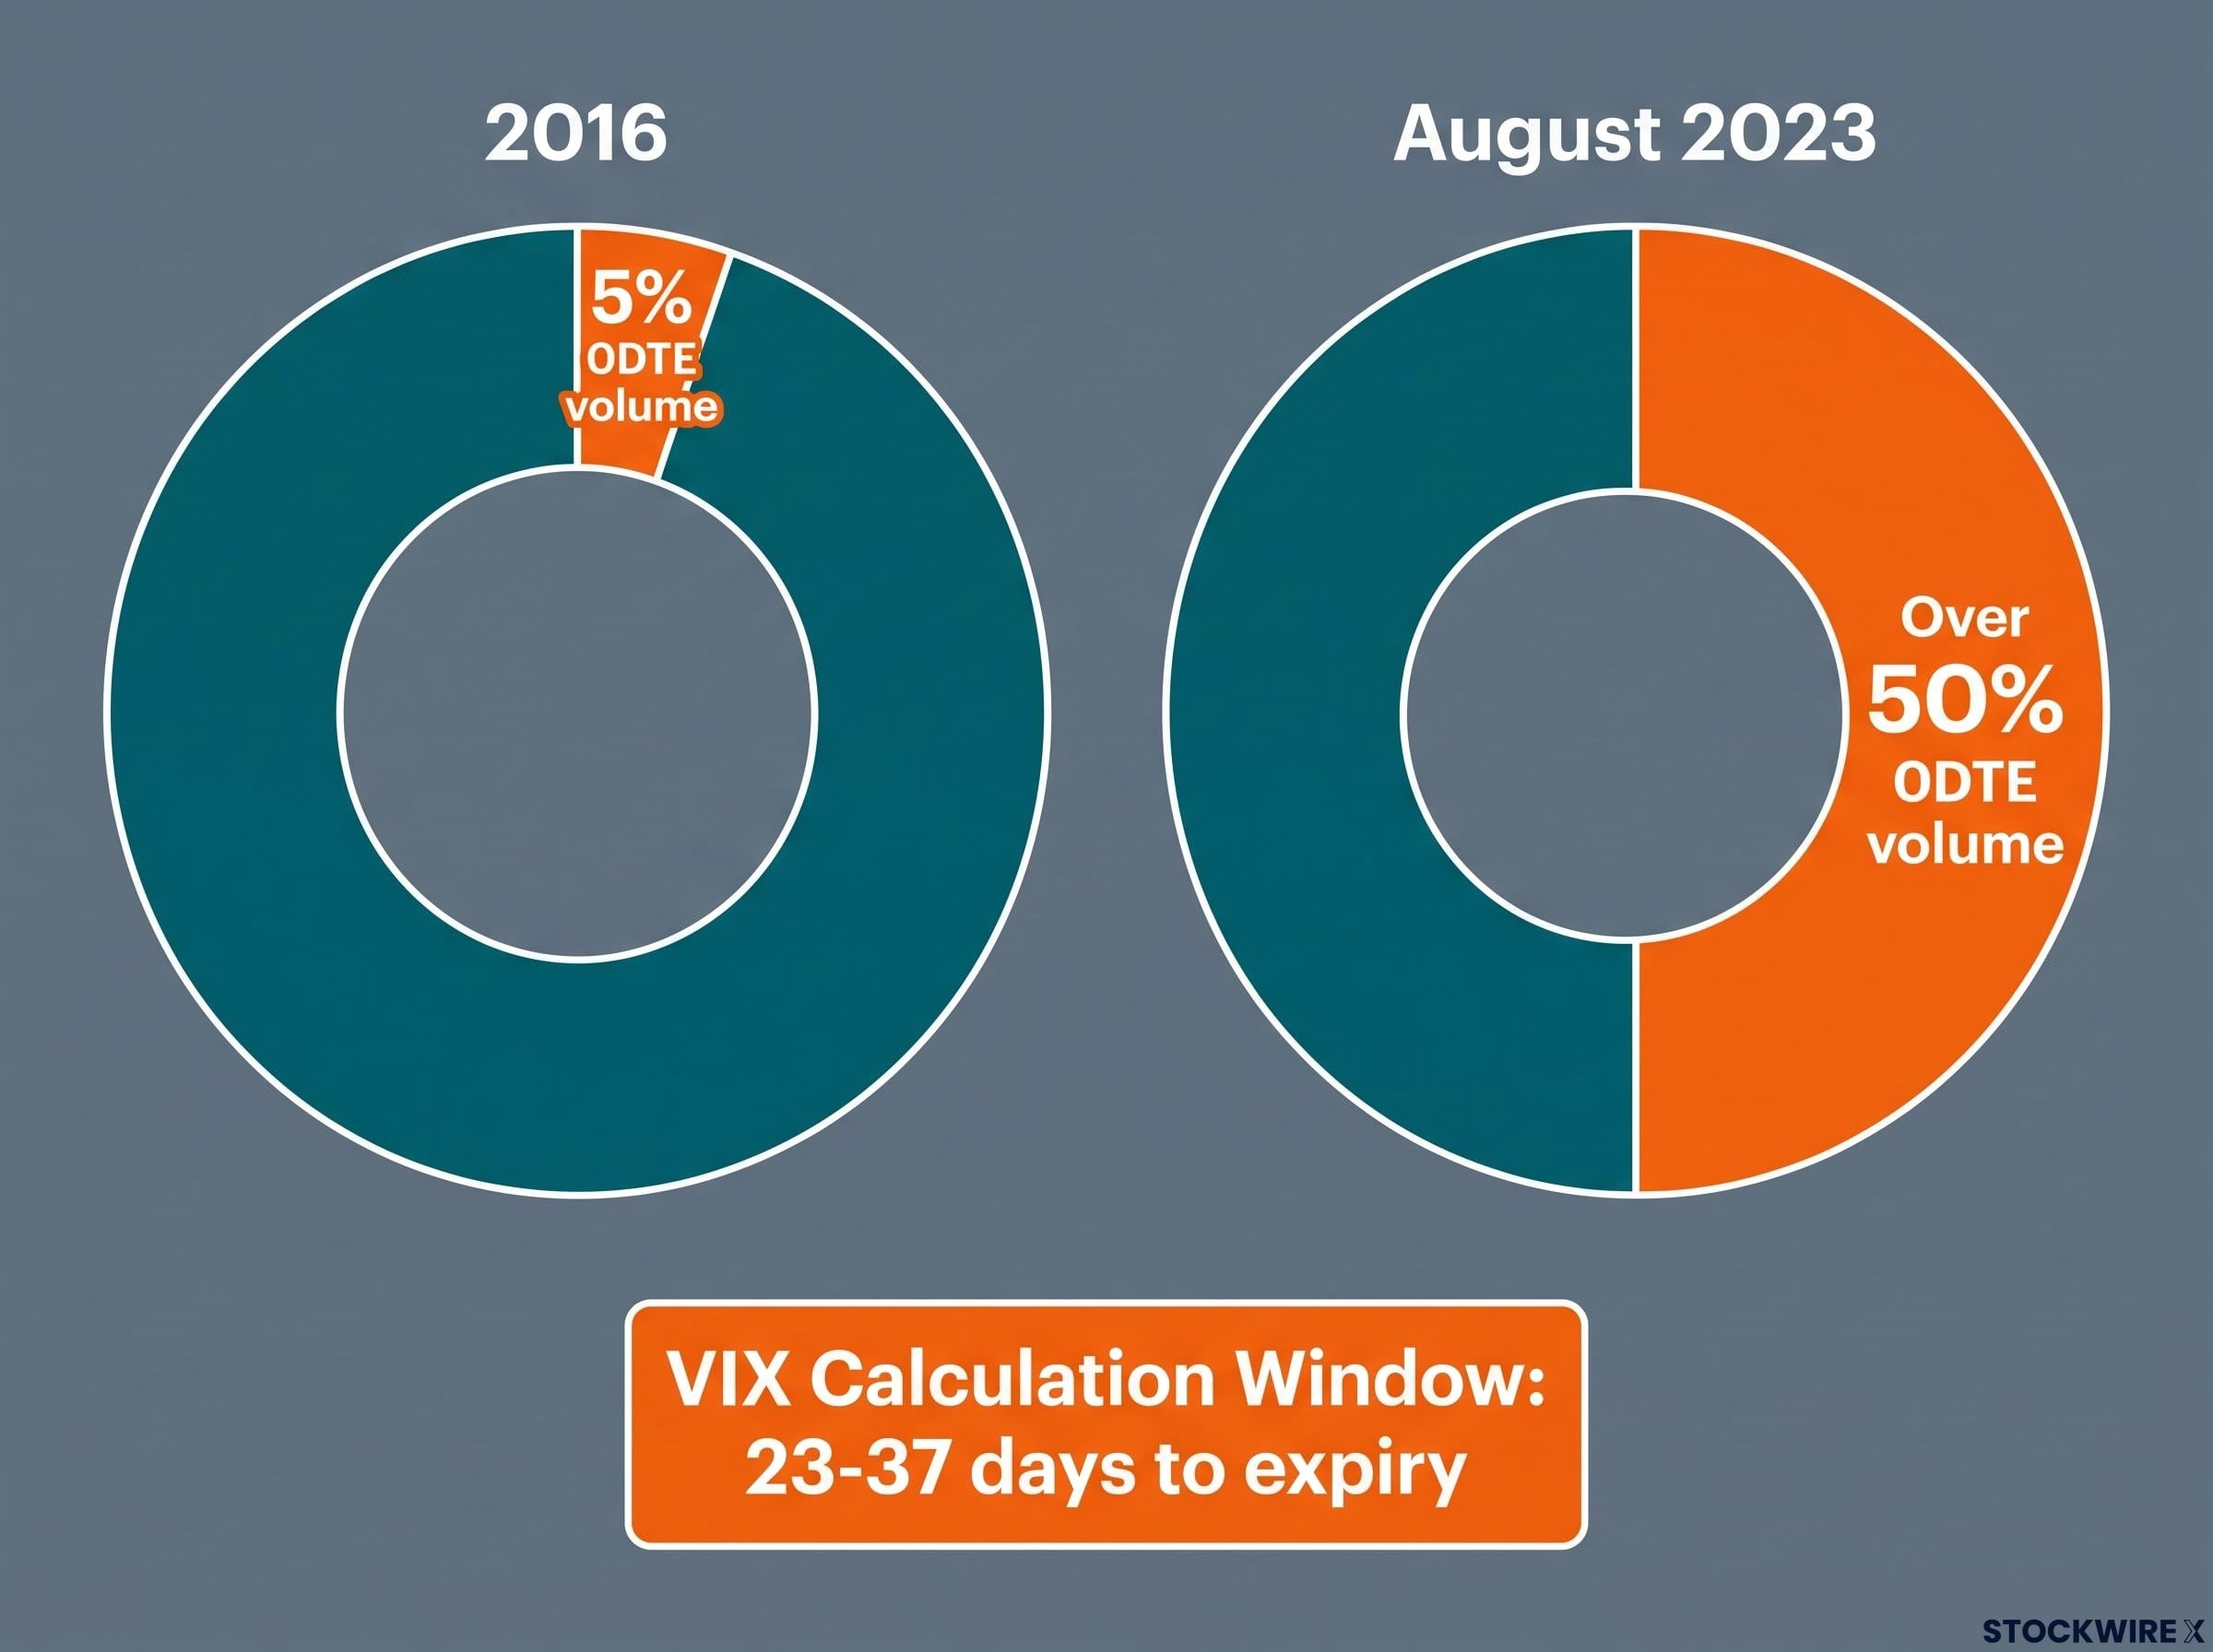
- The 0DTE volume shift: Zero-days-to-expiry (0DTE) options, contracts that expire the same day they are traded, rose from about 5% of SPX options volume in 2016 to more than 50% in August 2023 (unverified). Because the VIX uses 23-37 day options, this affects the headline number only indirectly, through shifting hedging demand.
- Bid-ask spread amplification: A 2025 SEC working paper (unverified) found that asymmetric widening of bid-ask spreads during uncertainty mechanically lifts the mid-quotes used in the VIX calculation, amplifying spikes beyond what fundamentals would predict.
The dramatic rise in 0DTE volume, contracts that now account for roughly 59% of all SPX options activity, reshapes dealer gamma positioning in ways that feed back into the headline VIX indirectly through hedging demand shifts across the 23-37 day window the index actually uses.
The alternative framework is the government management thesis, attributed to the analysis of Jim Carzon. It argues that policy-level actors now treat volatility expansions as entry points to support equities, effectively engineering recoveries after VIX spikes.
It is worth being precise here. Major central bank and regulatory sources, including the BIS and SEC, attribute the changes in the VIX’s predictive power to options-market microstructure and hedging flows, not to direct government management of equity volatility. The intervention thesis is an analyst-level argument without official institutional backing.
There are, however, documented examples of active government market support, which is why the debate has traction:
- Treasury buyback programme: Launched in May 2024 (unverified), with initial weekly envelopes of up to $2 billion in nominal coupon Treasuries, rising to $4 billion per operation from August 2024. This is a Treasury bond programme, not an equity intervention.
- Sovereign wealth fund proposals: An executive order dated early February 2025 (unverified) mandated a 90-day plan to establish a U.S. sovereign wealth fund, with no funding size designated.
- CHIPS Act equity positions: The government effectively took a 10% stake in Intel following $8.9 billion in awards reported on 29 August 2025 (unverified), described as a de facto sovereign wealth approach.
Whichever thesis you find more persuasive, both point to the same practical conclusion. The VIX can be pushed up or held down by forces unrelated to genuine investor fear, which means you should never read it in isolation. The structural explanation sets the floor on how much you can trust the number.
What the three-period framework means for how you read the next spike
Here is where the history becomes usable. The takeaway is not a new mechanical rule but a set of questions to ask before you act on the next spike.
Using a jumping VIX as an automatic buy signal is increasingly risky. A compressed baseline can understate genuine macro risk, and technical feedback loops mean an elevated reading may reflect purely derivative stress rather than broad capitulation.
“Increasingly risky” Analysts caution that using VIX spikes mechanically as a buy signal is increasingly risky in modern market structure, where the baseline itself may be distorted.
The three-regime history is really a reminder that the signal’s reliability is a variable, not a constant. So before acting, work through three questions:
- Is this a fundamental panic or a technical spike? A carry-trade unwind or a liquidity air pocket, like August 2024, is not the same as genuine macro capitulation.
- Is the reading above the 45 threshold? The February 2026 preprint (unverified) found the contrarian signal is statistically strongest at extreme readings above 45, a higher bar than most casual contrarians apply.
- What is the broader macro context? Central bank stance, carry-trade positioning, and the policy environment all shape whether a spike is an opportunity or a warning.
Apply that checklist to the present. According to unverified sourcing, the spot VIX sat at roughly 17.10 on 14 September 2026, with prior closes of 17.84 on 10 September and 15.84 on 11 September 2026.
That mid-to-high teens range is a non-extreme baseline. The classical contrarian mechanism is historically weaker here than at readings above 45, which means the current environment is neither a stress warning nor a clear entry signal.
For that reason, the research points toward buying downside protection through put options rather than establishing outright long volatility positions at this stage. In practice, the setup rewards patience and conditional preparation over reactive positioning.
The VIX futures curve sits in contango roughly 80% of the time, which means long-volatility products continuously bleed negative roll yield even when the spot reading is stable, a structural drag that compounds any misreading of the headline number.
This article is for informational purposes only and should not be considered financial advice. Investors should conduct their own research and consult with financial professionals before making investment decisions. Past performance does not guarantee future results.
Reading the VIX in 2026: a more conditional, more durable framework
The arc across three regimes tells a single story. The classical signal worked, then broke, then appears to have returned, and the lesson is not which signal to follow but how to stay regime-aware as conditions keep changing.
The two structural explanations, microstructure and policy intervention, remain genuinely contested. That ambiguity is not a failure of analysis. It is a feature of interpreting an instrument shaped by both fundamental behaviour and engineered market structure.
The February 2026 preprint (unverified) is the anchor for calibration: statistically significant positive forward returns are most reliably associated with extreme events above 45, not routine spikes into the high teens or twenties. With the reading sitting in the mid-to-high teens as of September 2026, the machinery for a classical contrarian opportunity may be assembling, but the threshold has not been triggered. Waiting for it is precision, not passivity.
The durable posture reduces to a few principles:
- Read the VIX in context, never in isolation.
- Weight the contrarian signal most heavily at extreme readings above 45.
- Distinguish technical spikes from genuine fundamental panics.
- Treat current mid-teens readings as a non-extreme baseline.
Applied with patience, this conditional framework improves with every new episode, because you now know exactly what to ask.
For readers wanting to build a fuller picture of when the mid-teens reading historically transitions toward a stress regime, our full explainer on VIX seasonality patterns examines three decades of data showing September records the single largest average monthly VIX increase of the year at plus 6.29%.