
The MSCI China Index trades at a forward price-to-earnings ratio of 10.76x, while the S&P 500 sits above 21x. On its face, that gap says Chinese equities are priced for permanent failure, a market the world has quietly decided to write off.
The question is whether that price reflects reality or opportunity. It is an unusually live question right now because three forces are colliding at once: a wall of household savings that reached RMB 173 trillion by June 2026 and has not rotated into stocks, a property market in structural retreat that is eliminating the dominant alternative asset for ordinary savers, and a regulatory push designed to make capital markets credible enough for those savers to trust.
Global institutions are revisiting their China allocations precisely because these forces are converging at a moment of maximum pessimism. Here is a framework for separating genuine structural risk from sentiment-driven discount, and for identifying the specific variables worth watching before deciding whether Chinese equities belong in a diversified portfolio.
The valuation gap is real, but so is the question of whether it is warranted
Start with the headline numbers. As of 31 August 2026, the MSCI China Index carried a trailing P/E of 13.96x, a forward P/E of 10.76x, a price-to-book ratio of 1.45x, and a dividend yield of 2.29%, according to MSCI’s index factsheet.
Against the S&P 500’s forward multiple above 21x, that is roughly a two-to-one discount. Chinese equities are among the cheapest major markets in the world by this measure.
The discount looks even starker against each market’s own history. As of 31 January 2025, MSCI China traded at a P/E of 10.1x, slightly below its 25-year average of 11x, while the S&P 500 sat at 21.9x, well above its 25-year average of 16x. One market is trading below its long-run norm; the other is trading at a substantial premium to its own.
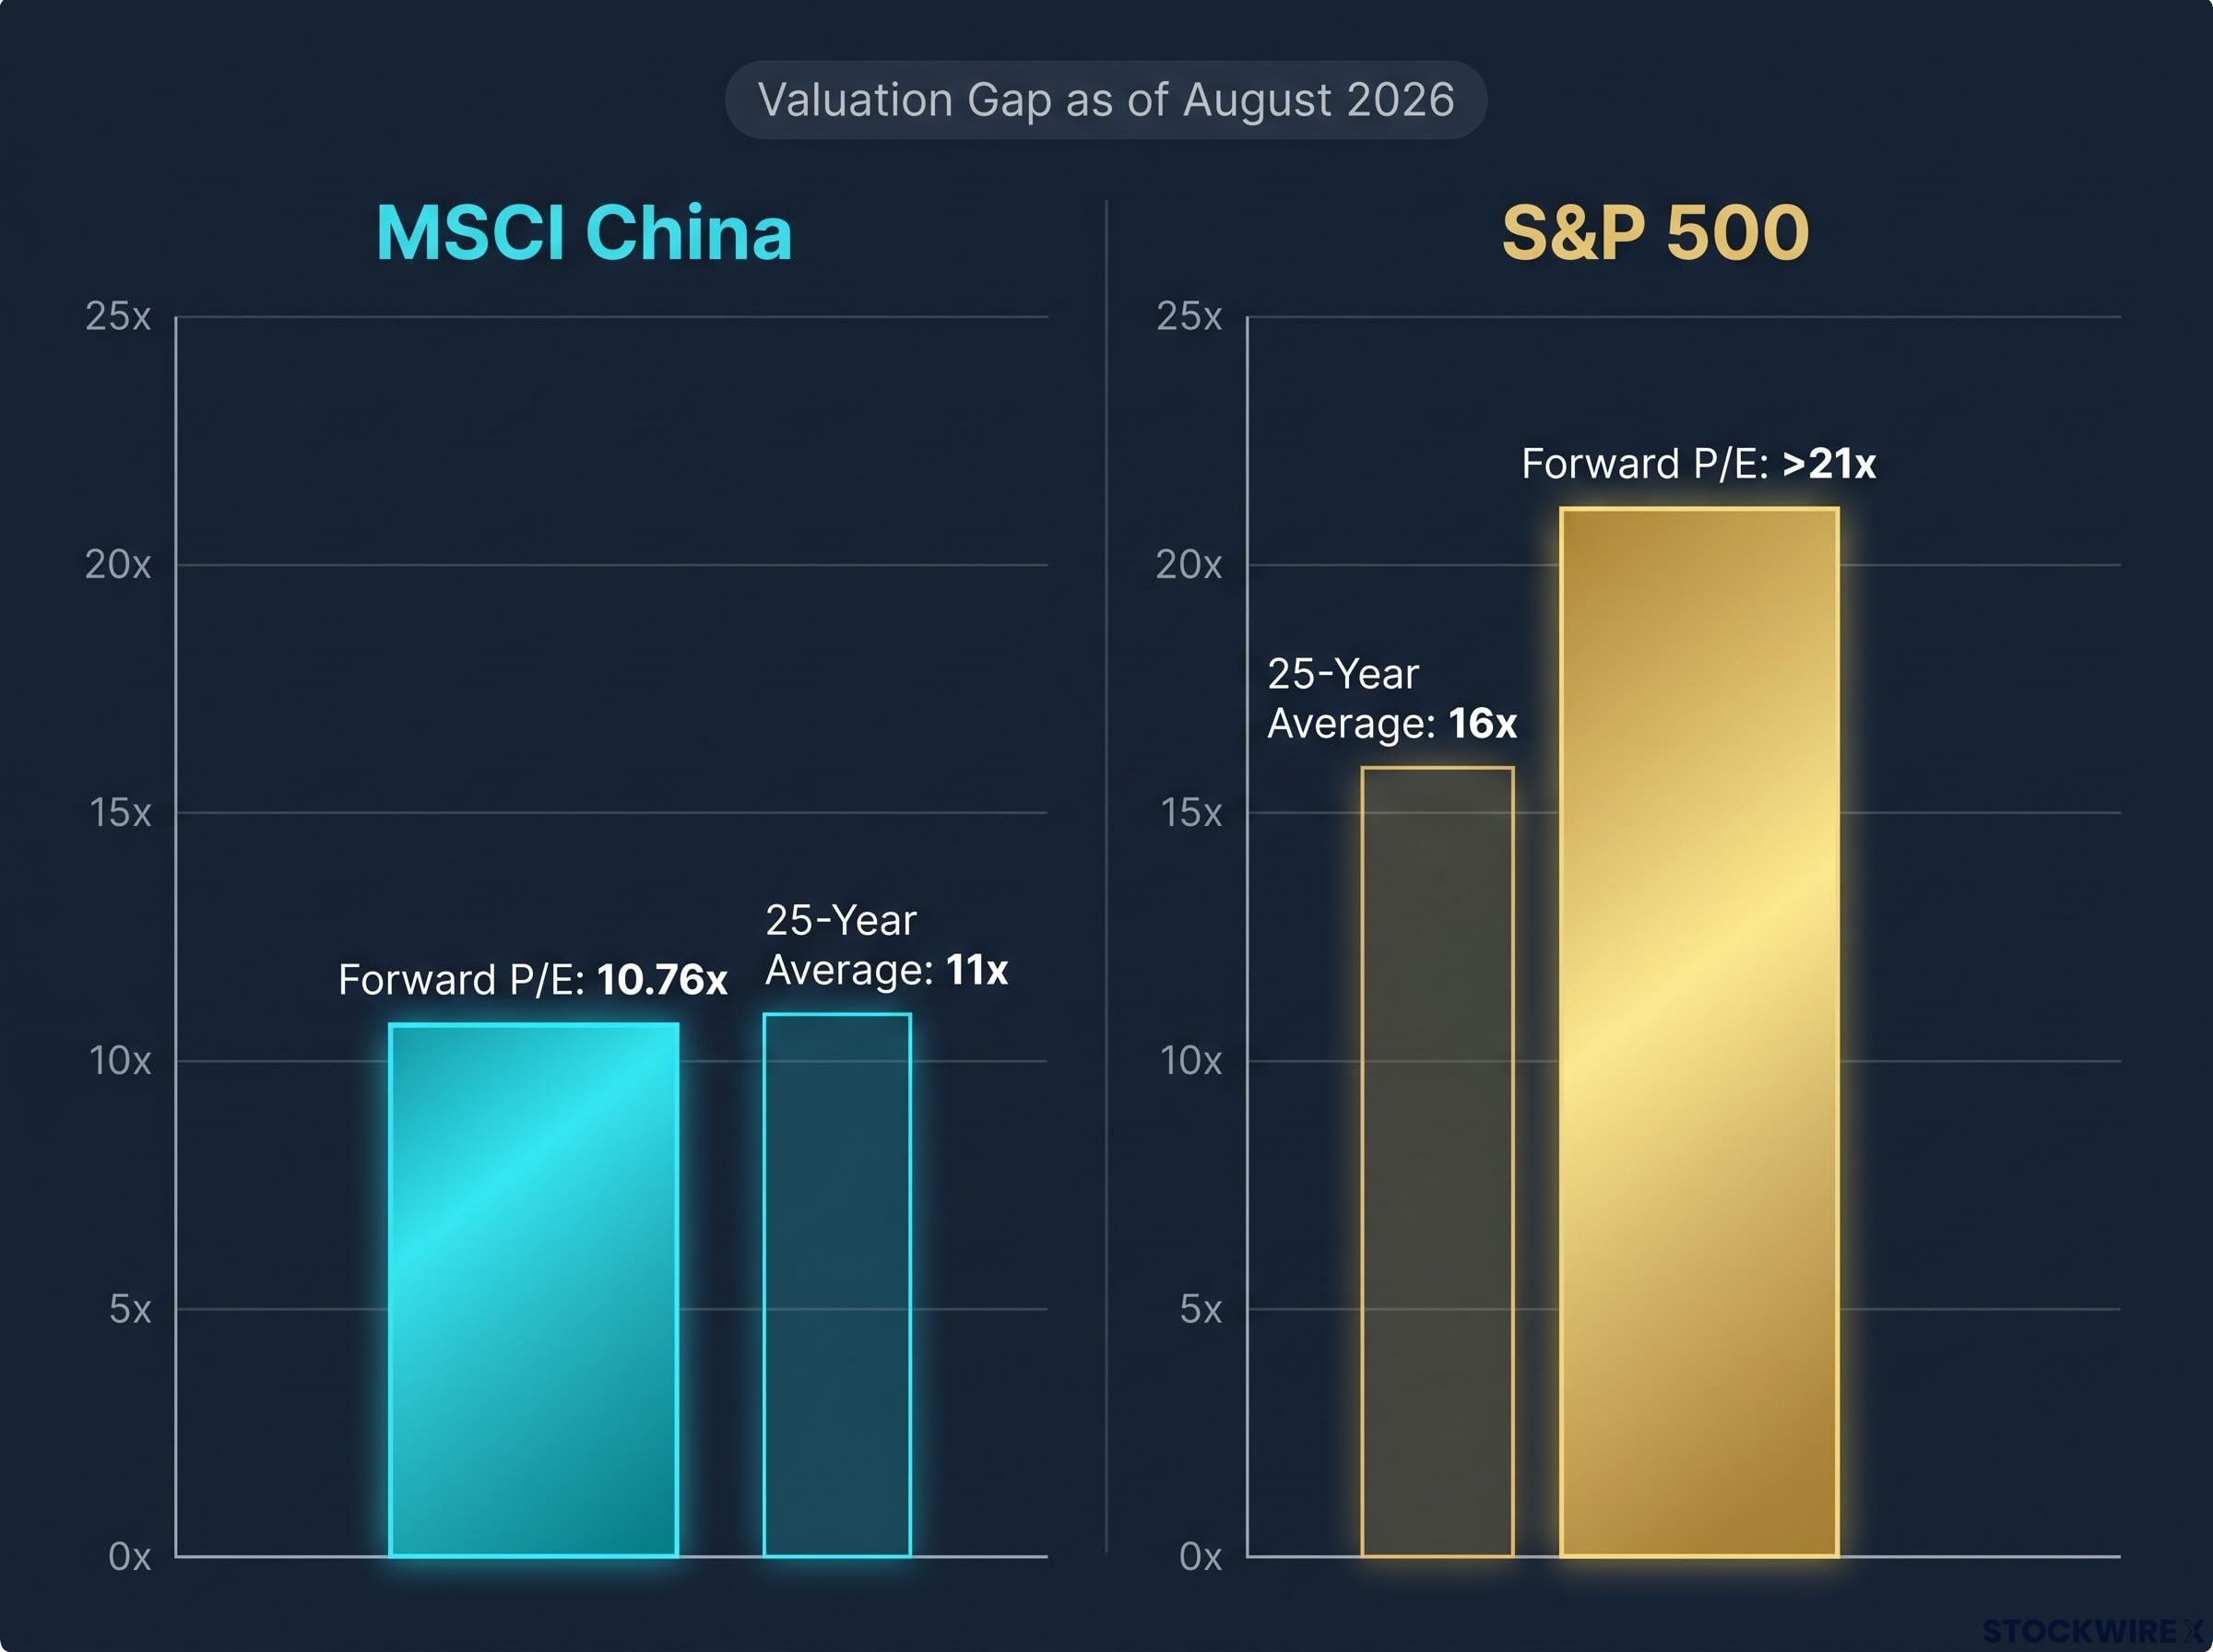
So the gap is undeniable. The harder question is whether it is a mispricing or an accurate reading of deteriorating fundamentals.
| Index | Trailing P/E | Forward P/E | 25-Year Average P/E | Dividend Yield |
|---|---|---|---|---|
| MSCI China | 13.96x | 10.76x | 11x | 2.29% |
| S&P 500 | Not disclosed | 21.9x | 16x | Not disclosed |
The bear case does not dispute the arithmetic. It argues the low price reflects genuine structural deterioration: earnings risk in property-linked sectors, demographic headwinds that erode long-run growth, and a track record that gives investors little reason to trust a re-rating.
That track record is the pivot point. Research by Allen et al., cited in the World Bank China Economic Update of December 2025, found the long-term net real return on Chinese household stock-market investment was close to zero across nearly two decades.
The distinction between GDP growth and equity returns is nowhere more consequential than in China: the country averaged roughly 9% real annual growth over three decades yet delivered negligible returns to broad equity holders, because index-level performance depends on capital allocation discipline and ROIC, not the headline growth rate.
According to World Bank analysis, the average net real return on stock-market investments by Chinese households was close to zero between 2000 and 2018, meaning households were not rewarded for taking equity risk over an eighteen-year stretch.
This is the single most important figure in the valuation debate, and here is what it tells you: cheap valuations have existed in China before, and they did not automatically convert into investor gains. The discount is a necessary condition for a bull case. It is nowhere near a sufficient one.
Not everyone reads it that way. In late 2025, the UBS Chief Investment Office upgraded China equities to Attractive, citing cheap valuations, an improving earnings picture, and a constructive view on the technology sector. The valuation gap is real. What it means is exactly what remains contested.
When big ASX news breaks, our subscribers know first
RMB 173 trillion in household savings is not a catalyst yet, and here is why
The scale of Chinese household savings invites a tempting story. By end-June 2026, household deposits reached roughly RMB 173.48 trillion, up from RMB 167 trillion at end-December 2025, a 9.7% year-on-year increase. In September 2025 the figure was climbing at 10.2%.
Put in context, that deposit pile equals approximately 122% of GDP and is around five times the size of retail mortgage loans, according to World Bank data from December 2025.
Chinese household deposits stood at roughly 122% of GDP as of late 2025, a savings buffer more than five times the size of the country’s retail mortgage book.
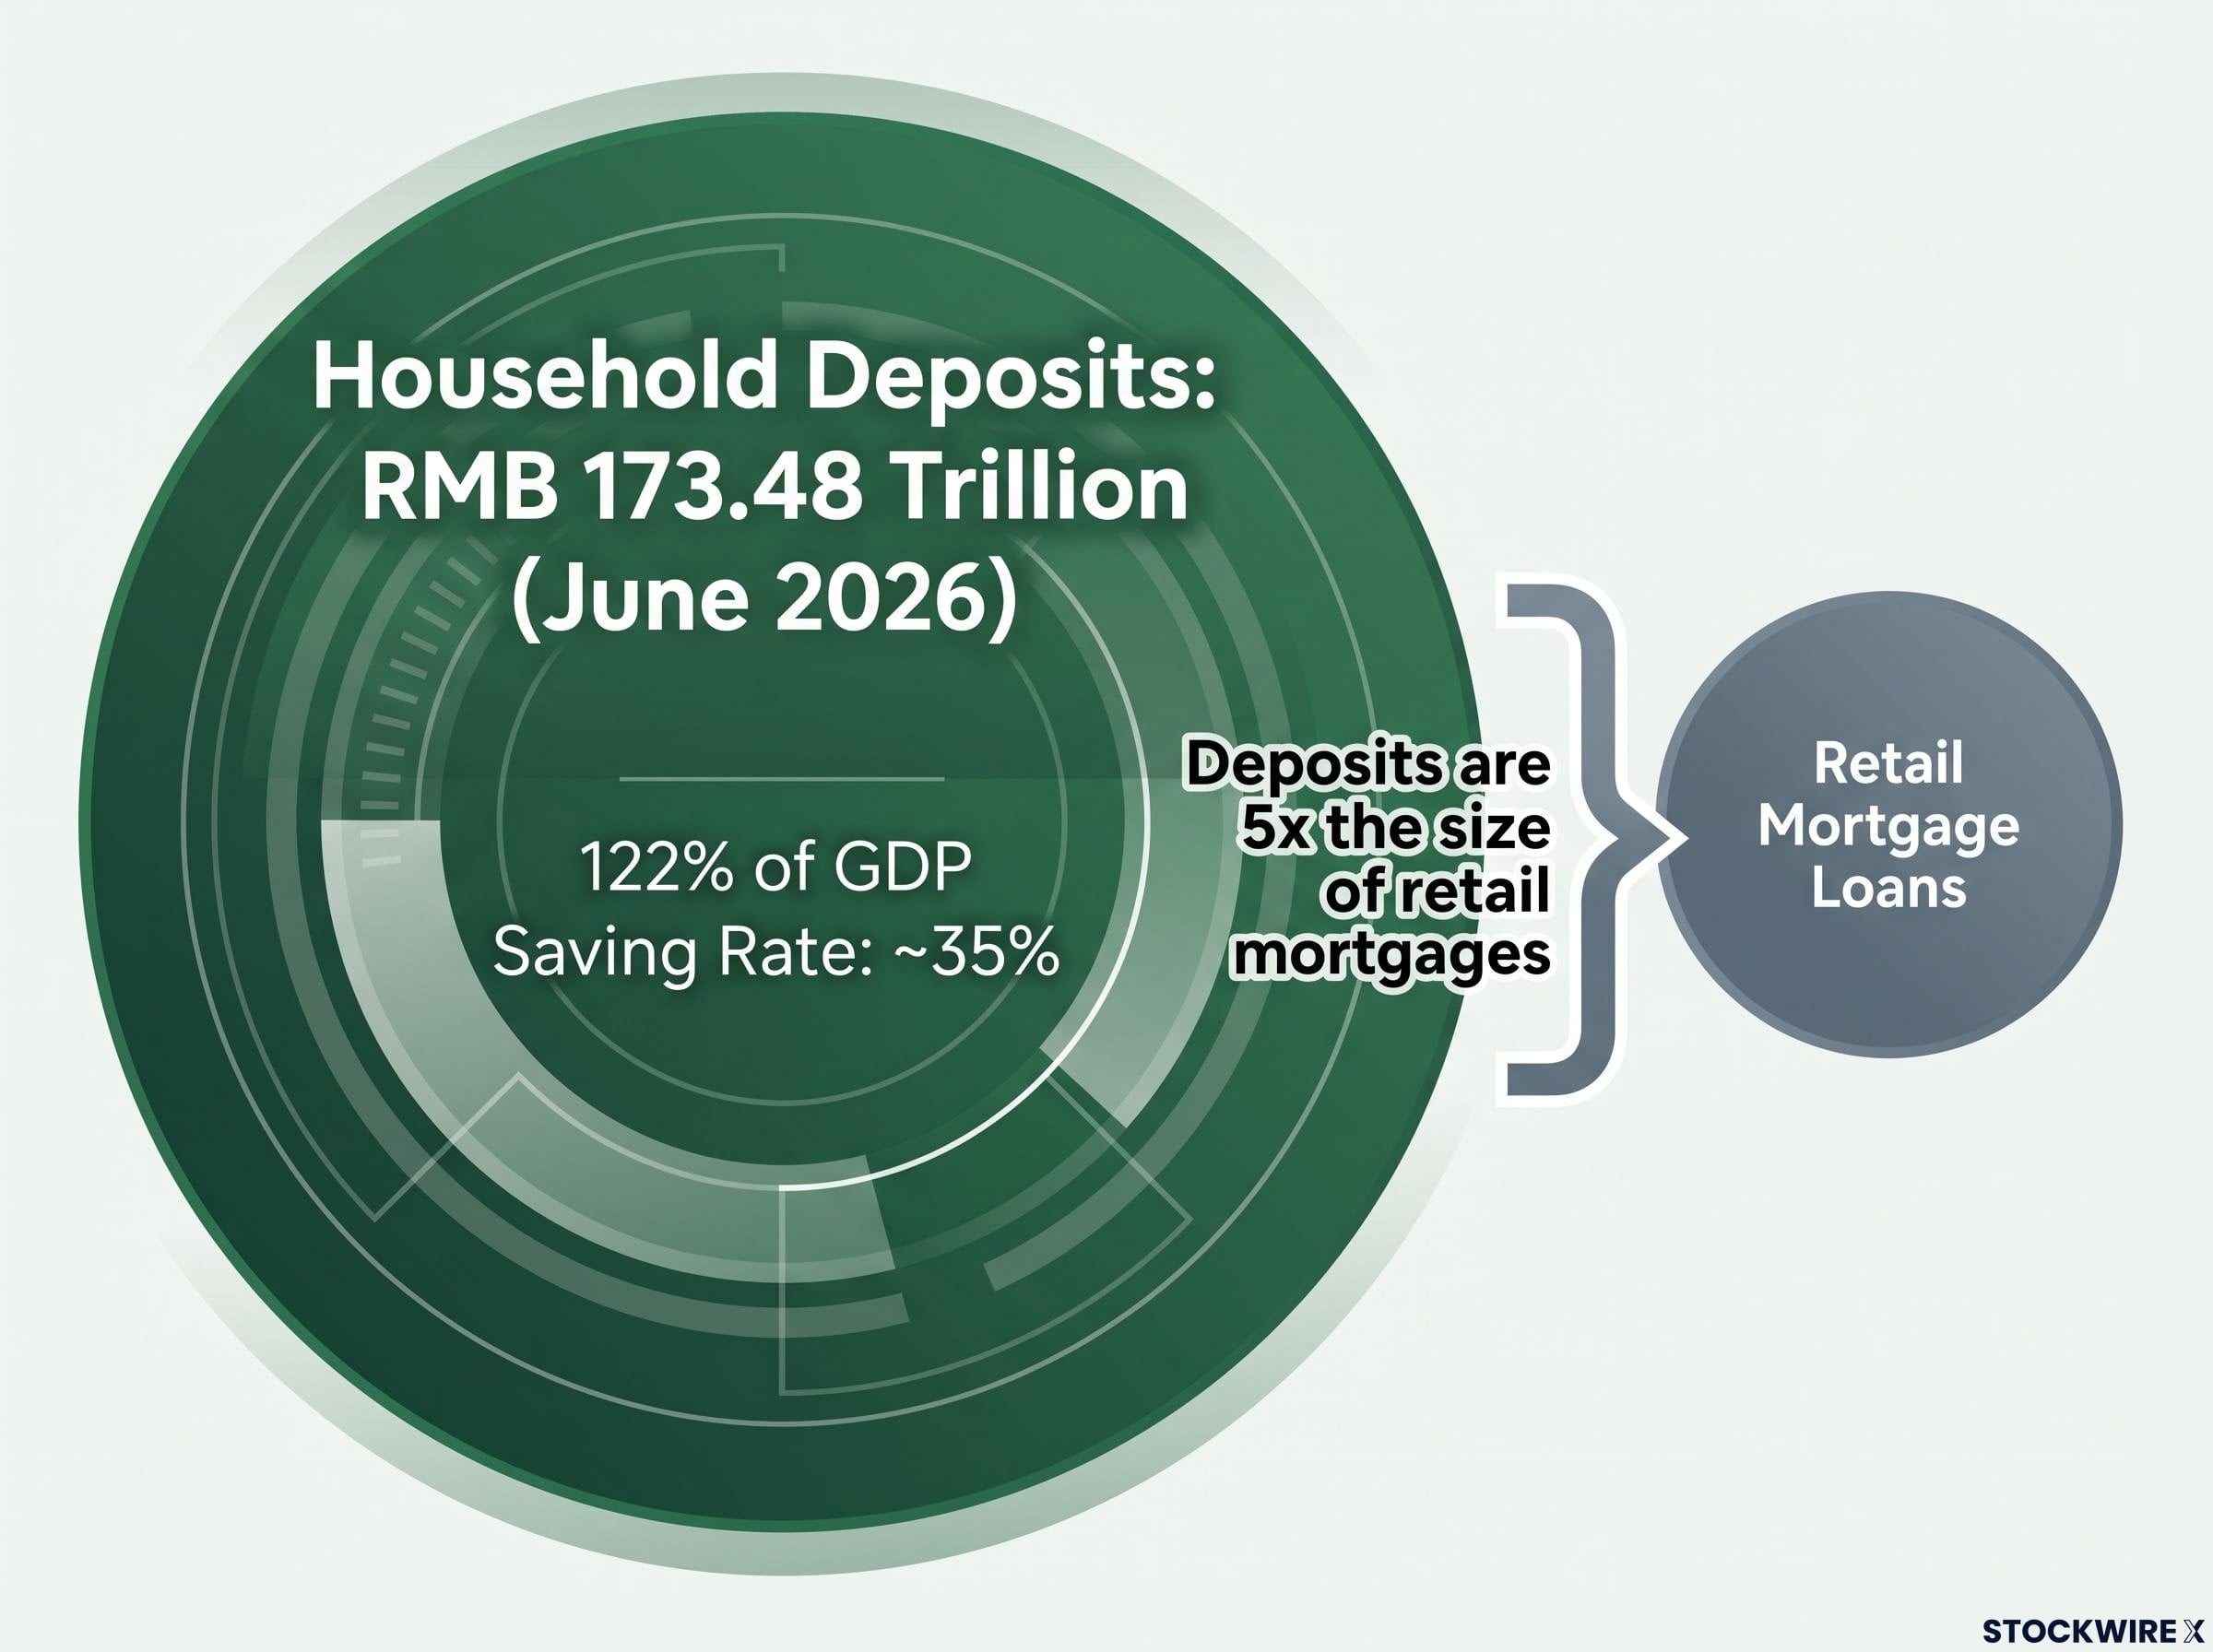
It is natural to look at that number and imagine a reservoir about to spill into equities. The household saving rate of around 35% only heightens the sense of latent energy. But the deposit growth rate is better read as a sentiment indicator than a pending catalyst. It measures how thoroughly households have opted out of risk assets, not how ready they are to opt back in.
The reasons are specific. Households repeatedly cite limited spare funds and low expected equity returns as reasons for staying out, a finding echoed in micro-household research on Chinese stock participation. Property historically absorbed the surplus, and its structural cooling does not cleanly redirect those flows. As of 2022, the World Bank found households held around 23% of financial assets in deposits, a preference reinforced by weak market performance and an uncertain outlook.
What would actually unlock the rotation
Research in the Journal of Applied Economics and Policy Studies (2024) identifies social trust, social interaction, and financial literacy as key determinants of whether households invest in risky assets. Those findings point to four structural prerequisites, each with evidence behind it:
Peer-reviewed research on household stock participation in China finds that social trust, financial literacy, and herding dynamics all shape whether individual savers commit capital to equities, reinforcing the article’s core point that deposit rotation into stocks is a behavioural and institutional problem as much as a valuation one.
- A sustained track record of positive returns. Given the near-zero real returns households experienced over 2000-2018, only a stable run of gains would convince savers that equities can reliably beat deposits and property.
- Regulatory credibility. Households must perceive markets as fair, rules as predictable, and enforcement as reliable before committing more wealth. Trust in institutions is a documented precondition for participation.
- Higher financial literacy. The academic evidence flags literacy and advisory channels as necessary for broad-based movement out of deposits.
- Macroeconomic clarity. A murky outlook reinforces precautionary saving. Clearer prospects for growth and employment are viewed as essential to reducing the perceived need for large deposit buffers.
For any investor pricing in a domestic retail-driven re-rating, the read is this: the savings-to-equities rotation is real optionality, but it requires structural conditions that have not yet been met. That should temper near-term expectations while preserving the long-term case.
The property collapse changes the asset-allocation map, but not cleanly
In theory, a property market in retreat should push household savings toward equities. Remove the dominant competing asset and capital has to go somewhere. The evidence suggests the transition is neither clean nor fast.
The downturn looks structural rather than cyclical. A June 2026 Univest analysis notes China’s urbanisation rate has moved above 65%, meaning the pool of new urban homebuyers is structurally shrinking (a figure flagged as not independently confirmed in available research). Fitch forecasts annual new housing demand averaging 800 million square metres between 2024 and 2040, less than half the 1.6 billion square metre peak of 2021. A sector that once accounted for around a quarter of GDP is resetting to a smaller footprint.
For equity investors, that structural retreat carries four specific risks:
- Earnings pressure in property-linked sectors. Developers, banks, construction, materials, and local-government financing vehicles all face sustained strain on profitability.
- Capped household risk appetite. A prolonged slump suppresses confidence, limiting upside for domestic consumption and financials even where valuations are low.
- Consumption drag. Falling property wealth weighs on spending, with youth unemployment (16-24, excluding students) rising to 17.9% in July 2026 from 14.9% in June, according to NBS data under its revised methodology, an added headwind to demand.
- Credit risk to banks and shadow lenders. Sustained price declines raise default risk and amplify financial-stability concerns.
Yet a stabilisation camp exists. S&P Global Ratings, in its property outlook, forecast primary home prices falling 6-8% in 2024 and 4-6% in 2025, while describing a path to stabilisation if policy support and market clearing continue. The Conference Board noted in March 2025 that the downturn had hurt household wealth and confidence, but pointed to early signs of possible stabilisation, set against household debt exceeding 60% of GDP.
Materials sector deterioration tells the same structural story at the activity level: cement output collapsed 11.6% year-on-year in July 2026 and cement sector profits fell 84% in H1 2026, with more than half of installed capacity sitting idle, figures that translate directly into earnings pressure for the bank and construction-linked names that dominate the cheap end of Chinese equity valuations.
| View | Structural Drag | Stabilisation |
|---|---|---|
| Key evidence | Urbanisation above 65%; Fitch demand forecast of 800m sqm to 2040 vs 1.6bn peak; sector once ~25% of GDP | S&P forecast of 4-6% price fall in 2025 with path to stabilisation; accommodative policy, lower loan rates, relaxed purchase rules |
| Equity implication | Sustained earnings pressure in financials and cyclicals; cheap may mean cheap for a reason | Orderly clearing supports bank earnings and confidence, removing a tail risk to the broader market |
For an equity investor, the property question is not really about whether home prices recover. It is about whether the sector’s retreat is orderly enough to stabilise bank earnings and household confidence without triggering a broader credit event. That is the single largest swing factor for the market, and it remains unresolved.
The anti-graft push and foreign interest: what the regulatory pivot could actually achieve
Watch where sophisticated money is moving. Foreign institutional interest in Chinese equities has picked up measurably, and it is the clearest live signal that the valuation discount is drawing action rather than just commentary.
Several global names have shifted stance:
- UBS upgraded China equities to Attractive and expects a positive year in 2026, driven by earnings growth, AI innovation, accommodative policy, and rising domestic liquidity.
- Goldman Sachs maintains an increase stance, and is reported to have found global active funds lifting China allocations from around 5% to 6.4% (a figure not independently confirmed in available research).
- Franklin Templeton has been cited alongside UBS and Goldman as stepping up allocations, pointing to favourable valuations and AI-driven optimism.
- VanEck lists Australia’s dedicated China A-shares benchmark exposure via the FTSE China A50 ETF (CETF), and announced its China New Economy ETF for ASX listing in October 2025, targeting profitable, fast-growing A-shares in consumer, healthcare, and technology.
UBS expects a positive year for Chinese equities in 2026, with upside driven primarily by earnings growth, supported by AI innovation, accommodative policy, and continued inflows.
The regulatory story runs on a different clock. The agency overseeing domestic markets is conducting an anti-graft push designed to build credibility with everyday citizens and encourage retail investment. That matters, because academic evidence identifies regulatory credibility, as a component of social trust, as a precondition for household equity participation. Yet specific named measures and outcomes of the campaign were not locatable in available research, which itself signals limited public transparency.
The CSRC regulatory architecture now functions as a dual gatekeeper for Chinese issuers, running a parallel approval process alongside US exchanges that gave Beijing real rejection authority over foreign listings, with 56 approvals documented in 2024 confirming the pathway remains active but increasingly conditional on meeting standards from both regulators simultaneously.
Why domestic retail participation is on a different timeline
Foreign capital and domestic retail are two different stories on two different clocks. Foreign institutions are valuation-responsive and fast to move; they can act on a discount within a quarter. Domestic retail participation depends on trust in institutions and financial literacy, both of which the academic evidence describes as slow to build and easily damaged. That gap is why a foreign-led rally can begin well before, and independently of, any broad domestic re-rating.
The read for an investor is precise. Rising foreign allocations tell you sophisticated capital is willing to act on the discount now, which can provide near-term price support and compress the gap incrementally. Domestic participation at scale is a medium-term aspiration, not a near-term trigger, so return expectations should be calibrated accordingly.
Positioning for a market where the discount may be permanent or may not be
The honest conclusion is that the China equity question does not resolve. The bull case and the bear case both draw on real evidence, and the discount reflects genuine uncertainty rather than a mistake waiting to be corrected.
Bulls point to a forward P/E of 10.76x against the S&P 500 above 21x, AI-driven earnings potential, foreign institutional re-entry, and the structural cooling of property as a competing asset. Bears point to near-zero real household equity returns over 2000-2018, a property sector in structural retreat, demographic headwinds, and regulatory opacity. The RMB 173 trillion deposit pile sits between the two arguments, latent demand that neither side can yet claim. Youth unemployment at 17.9% in July 2026 is a reminder that the consumer headwind has not lifted.
Rather than pick a side, watch the three variables most likely to shift the balance:
- CSRC regulatory credibility. Measurable progress would look like verifiable enforcement and a rising, sustained share of new retail money entering the market rather than trading existing positions.
- Property sector credit stability. Progress would look like bank earnings holding and default risk contained as prices clear, without a broader credit shock.
- Technology earnings track record. Progress would look like consecutive periods of earnings growth, particularly in tech, demonstrating that Chinese equities can compound value rather than oscillate.
The decision ultimately turns on time horizon. Short-horizon investors face real execution risk from macro volatility and regulatory opacity. Longer-horizon investors with diversified global exposure may find the entry point compelling, provided they accept that the re-rating catalyst is structural and measured in years, not quarters. The investment is fundamentally a bet on which uncertainty resolves first.
For investors wanting to translate the China allocation debate into a specific portfolio decision, our dedicated guide to China ETF options on the ASX covers the structural differences between IZZ, CETF, and broad emerging markets vehicles, including the legal constraint that Chinese companies must prioritise government directives over shareholder interests.
This article is for informational purposes only and should not be considered financial advice. Investors should conduct their own research and consult with financial professionals before making investment decisions. Past performance does not guarantee future results. Financial projections are subject to market conditions and various risk factors, and forward-looking statements are speculative and subject to change based on market developments.