The Dow Jones Industrial Average is quoted every day in financial news. It moves markets when it drops. And most people who cite it cannot actually explain how it is calculated.
You have almost certainly heard a phrase like “the Dow fell 400 points” and nodded along without knowing what that number really represents, or whose stocks it reflects.
Here is the thing worth understanding: the Dow Jones Industrial Average is not a broad snapshot of the American stock market. It is a 30-stock, price-weighted index built on a specific calculation method that shapes what moves it, what does not, and why it sometimes behaves differently from other benchmarks quoted alongside it.
That structure has real consequences for how you should read its daily swings.
After reading this, you will be able to look at a Dow point move and understand exactly what drove it, judge whether the index is the right benchmark for your own portfolio thinking, and know the specific instruments available if you want to invest in it directly. That is the practical unlock, and it starts with where the index came from.
A 130-year-old index that still moves markets
The Dow has been running since the late 19th century, which makes it one of the oldest equity benchmarks in the world. That longevity alone tells you something about its credibility as a shared reference point.
It was created by Charles Dow, who also co-founded the Wall Street Journal. From the very beginning, then, the index was tied to financial journalism, built as a way to summarise market activity for readers rather than as a tool for portfolio construction.
That heritage matters, because the features that made the Dow simple and durable in the 1800s are the same features critics point to today when they argue it is a flawed measure of the modern market.
Constituent changes also reflect deliberate editorial judgment rather than a mechanical quantitative screen: two rounds of additions in 2024 brought in Nvidia and Amazon while dropping Intel and Walgreens, signalling the committee’s view that the index should tilt toward digital economy and AI-era businesses rather than the industrial names that defined it in earlier decades.
What the 30 stocks actually are
The index has always been a small, curated set of prominent U.S. companies. Today it holds exactly 30 components, and that narrowness was a deliberate design choice, not an oversight.
According to Barron’s, updated 11 September 2026, the current constituents include a roster of household names:
- Apple, Microsoft, NVIDIA, Amazon, and Alphabet (Class A)
- JPMorgan Chase, Goldman Sachs, American Express, Visa (Class A), and Travelers
- Caterpillar, Boeing, Honeywell International, 3M, and IBM
- Walmart, Home Depot, Procter & Gamble, Nike, and Walt Disney
- Cisco Systems, Salesforce, Sherwin-Williams
(This sample is drawn from Barron’s and is illustrative rather than a complete canonical list.)
Despite persistent professional criticism of its methodology, the Dow remains the most widely quoted U.S. equity benchmark in mainstream coverage. That prominence is exactly why it is worth understanding.
Because here is the catch. When you hear these 30 names described in the news as “the market,” you are hearing a deliberately narrow slice of it. A 400-point Dow drop is not a verdict on the entire U.S. equity market. It is a report on 30 specific companies, weighted in a specific and rather unusual way. Understanding that weighting is the next step.
When big ASX news breaks, our subscribers know first
Why a $1 stock move does not affect every company equally
You already have one piece of the signal: the point number on your screen. What sits behind it is a mechanism that surprises most people the first time they see it.
The Dow’s level is calculated by adding up the share prices of all 30 component stocks, then dividing that total by a single number called the Dow divisor. Notice what is missing from that formula: company size. Market capitalisation, the total dollar value of a company’s shares, plays no part. Only the per-share price matters.
This is what “price-weighting” means. A stock with a high share price pushes the index around more than a stock with a low share price, even when the low-priced company is far larger economically.
Price-weighting mechanics create a structural imbalance that most casual market watchers never notice: a company trading at $500 per share carries five times the index influence of a company trading at $100, even when the cheaper stock represents a far larger business by total market value.
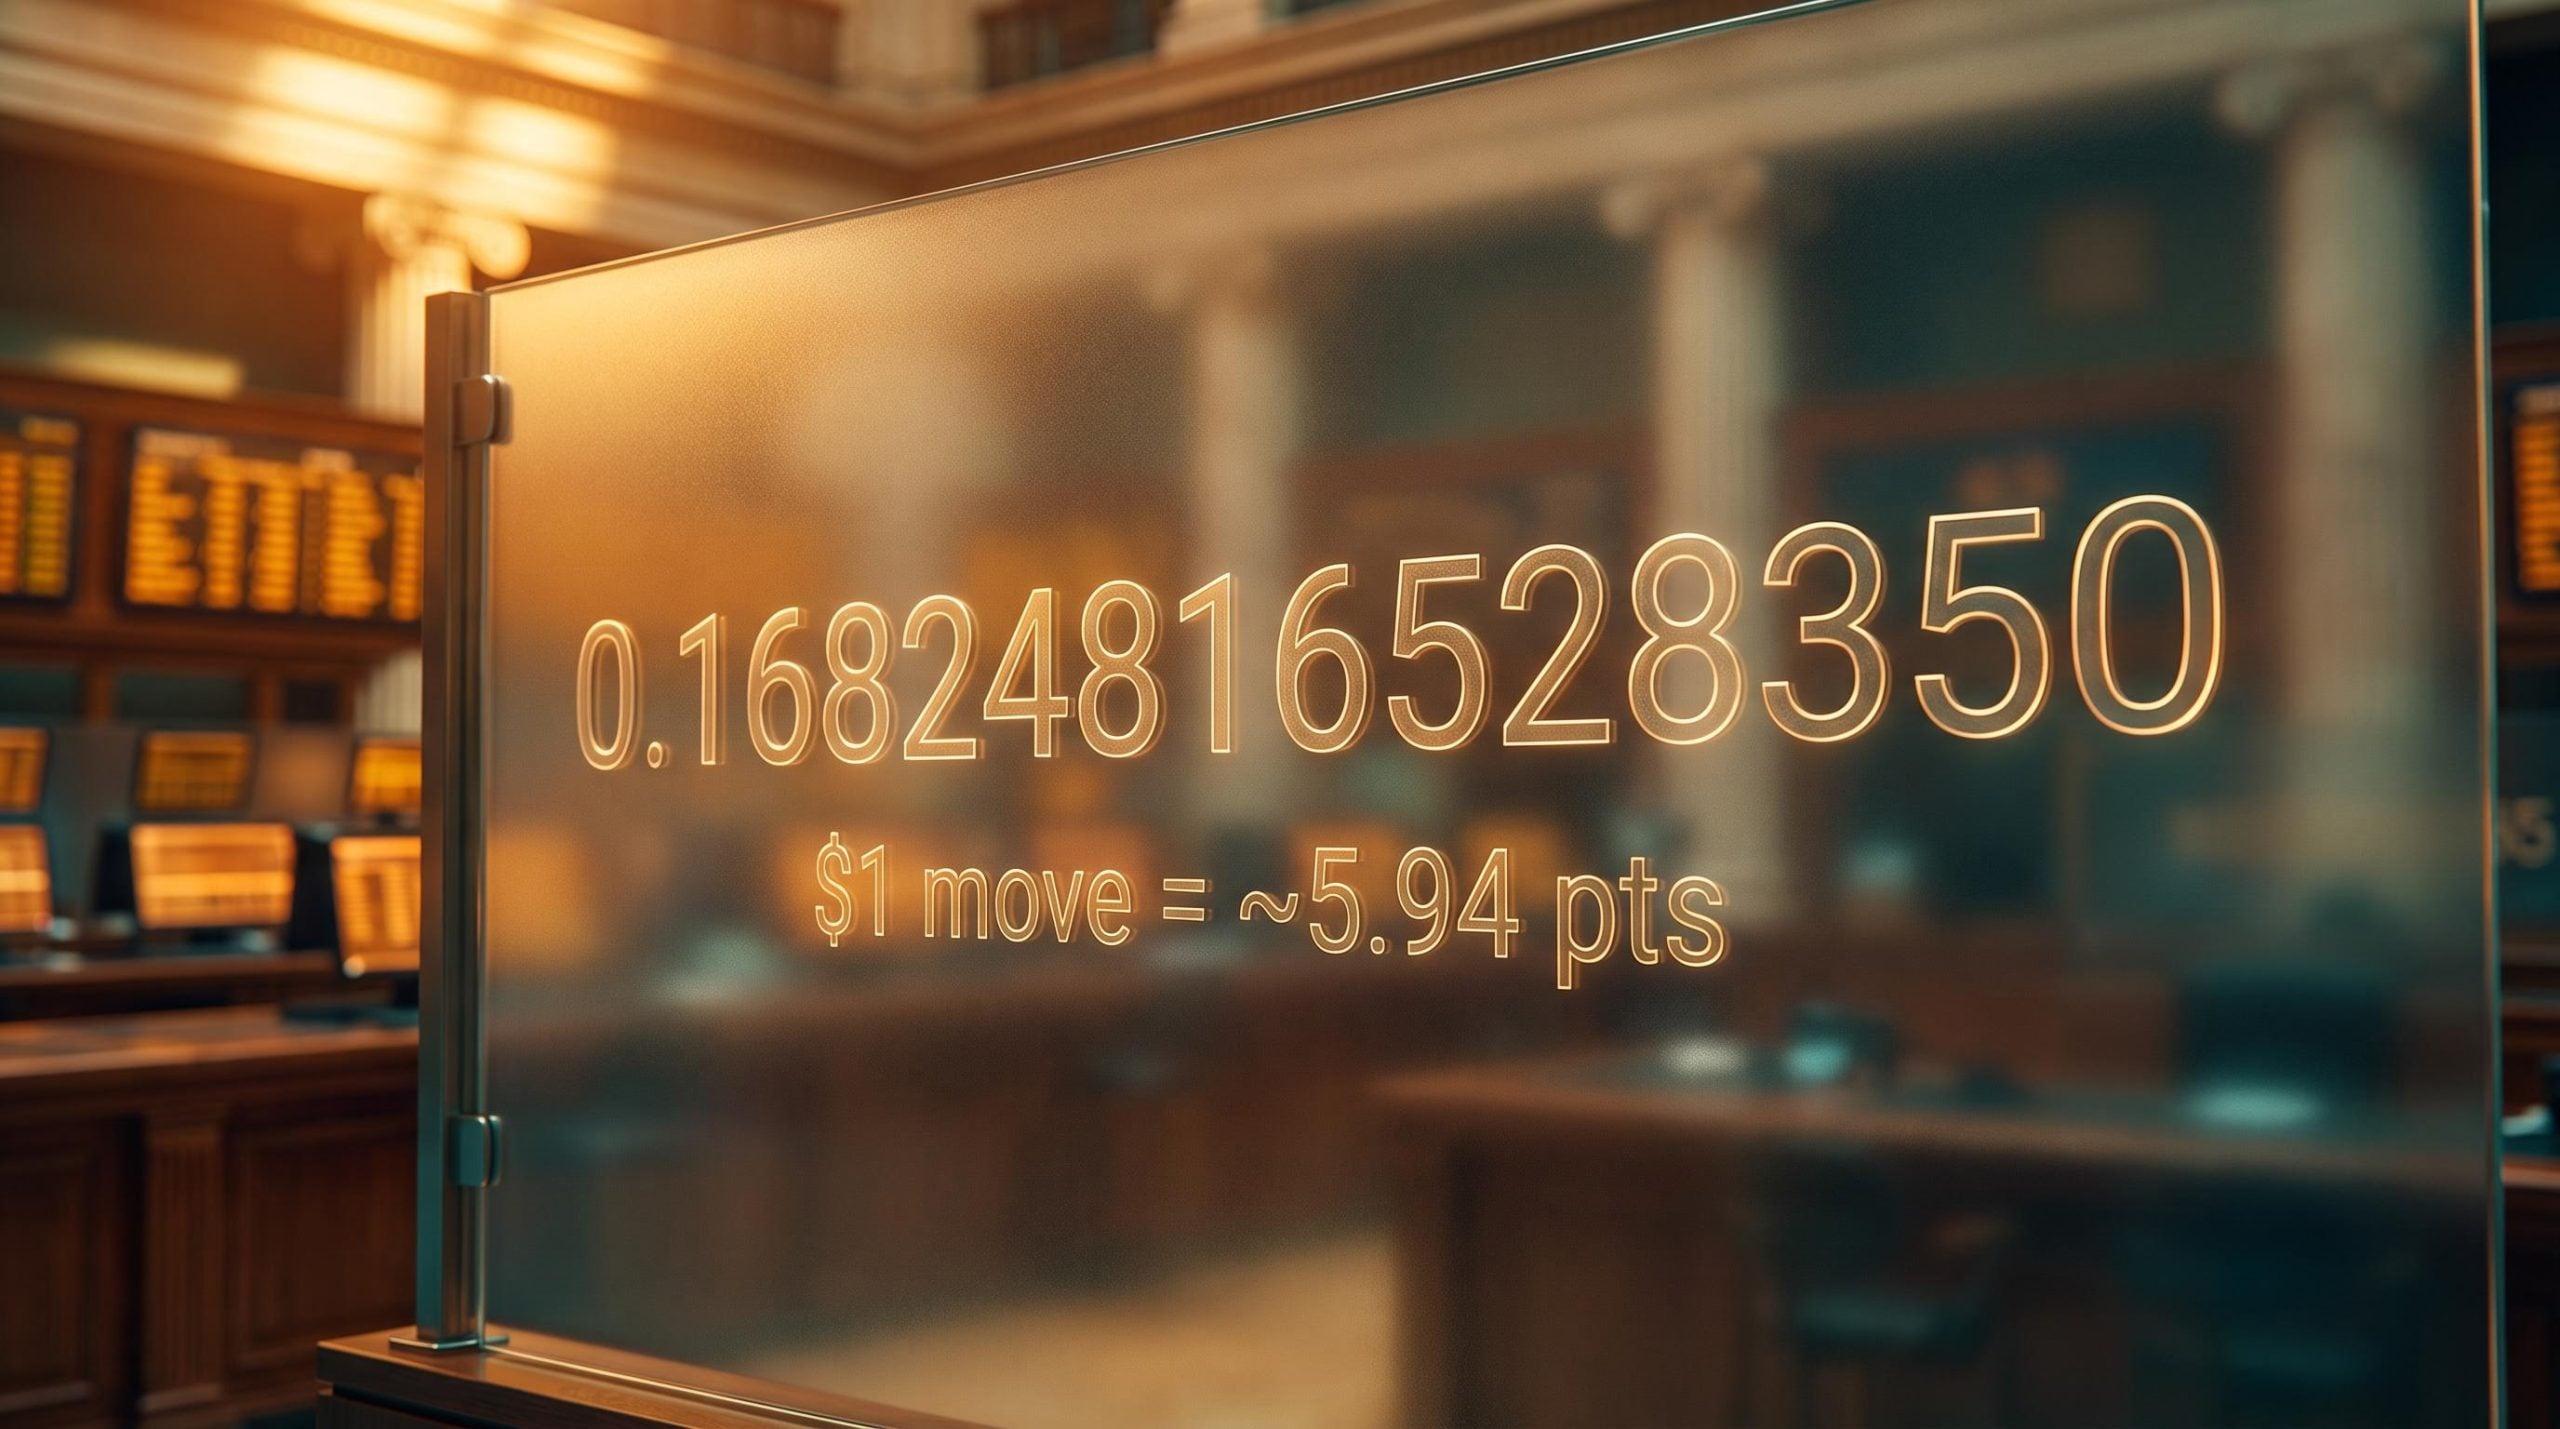
The divisor The current Dow divisor is 0.16824816528350 (roughly 0.168), effective 29 June 2026 according to Wikipedia. This is the precise scaling factor that translates raw price changes into index points, and it is updated periodically.
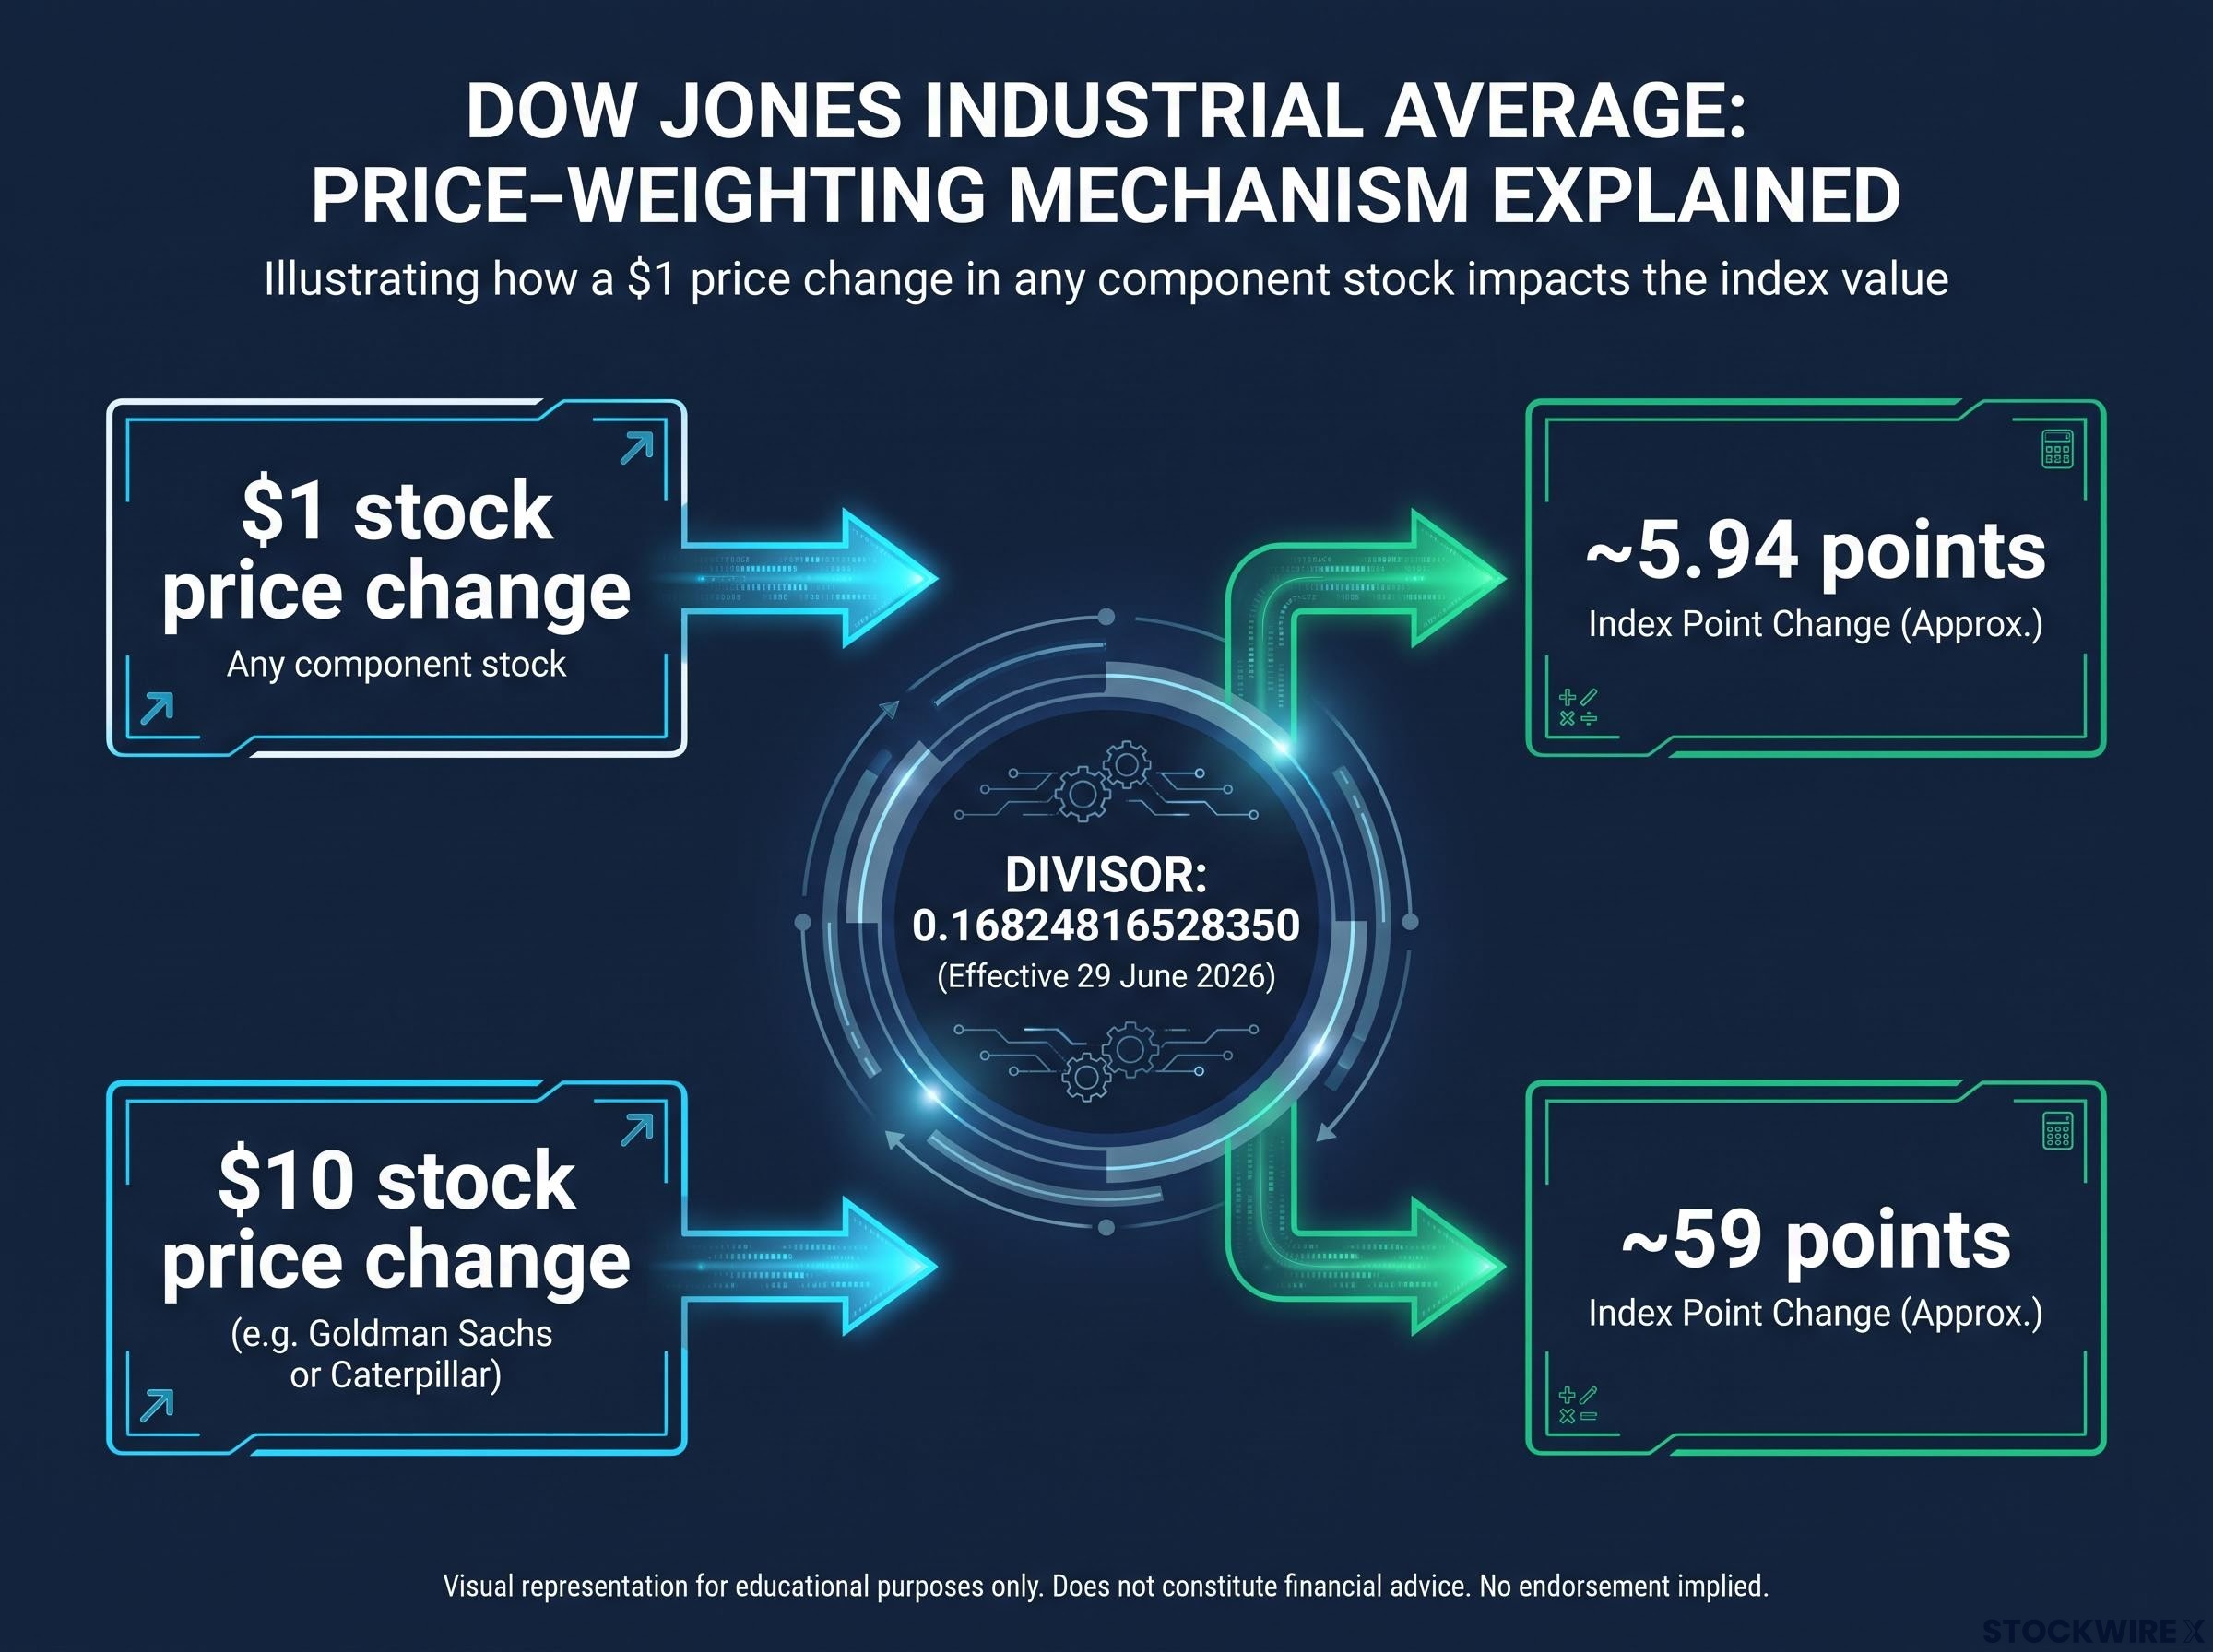
With the divisor at that level, a $1 change in any single component stock moves the index by roughly 5.94 points. It does not matter which company. A dollar is a dollar, whether it moves at NVIDIA or at 3M.
Now scale that up. A $10 move in a high-priced name like Goldman Sachs or Caterpillar shifts the index by nearly 59 points on its own. A mega-cap company trading at a lower per-share price, perhaps because of past stock splits, carries proportionally less weight even if it is the bigger business.
| Scenario | Stock price change | Approximate Dow point move |
|---|---|---|
| Any component stock | $1 | ~5.94 points |
| High-priced component (e.g. Goldman Sachs) | $10 | ~59 points |
| Cap-weighted index (for contrast) | Depends on company size, not share price | Influence scales with market value |
The takeaway for you is direct. Price-weighting means you cannot use a Dow point move as shorthand for broad economic performance. A handful of high-priced stocks effectively set the index’s daily direction. That is a structural quirk worth knowing before you treat the Dow as a market thermometer.
How the divisor gets adjusted
The divisor is not a fixed constant. It changes to keep the index honest when companies take corporate actions.
Say a component executes a 2-for-1 stock split, which halves its share price overnight. If the divisor stayed the same, the index level would drop mechanically even though nothing about the underlying business changed. To prevent that false signal, the divisor is reduced so the index level immediately before and after the split is identical.
Component substitutions trigger the same fix. When one stock replaces another at a different price, the divisor absorbs the gap. For context, TheStreet reported the divisor stood at 0.42563928 as of 30 October 2025, so its move to roughly 0.168 shows how meaningfully this figure shifts over time as the components change.
How the Dow compares to broader benchmarks
Every time you check a different index, you are measuring a different thing. Getting clear on that is the single most useful benchmarking skill you can build, and the cleanest comparison is the Dow against the S&P 500.
The two indices answer different questions. The Dow is a price-weighted collection of 30 blue-chip stocks. The S&P 500 holds 500 companies and weights them by market capitalisation, meaning each company’s influence is proportional to its total market value.
That distinction changes everything about how a giant company shows up. In the S&P 500, a mega-cap like Apple exerts enormous influence because its total market value is enormous. In the price-weighted Dow, Apple’s sway is capped by its per-share price, which can leave it punching below its economic weight.
Index divergence between the Dow and the S&P 500 is not random noise: it follows predictably from their structural differences, and on days when semiconductor names sell off hard, the price-weighted, 30-stock Dow can rise even as the cap-weighted S&P 500 declines, because the chip names causing the most damage often carry minimal weight in the Dow.
| Feature | Dow Jones Industrial Average | S&P 500 |
|---|---|---|
| Number of components | 30 | 500 |
| Weighting method | Price-weighted | Market-capitalisation-weighted |
| Index operator | S&P Dow Jones Indices | S&P Dow Jones Indices |
| Typical use case | Pulse check on blue-chip names; long historical series | Broad-market proxy for portfolio analysis |
| Representative ETF | DIA | VOO / IVV |
The Dow’s narrow composition means it can under-represent smaller companies, growth sectors, and newer industries. It is not a complete stand-in for the U.S. equity market, which is why professionals increasingly lean on cap-weighted indices for serious portfolio work.
None of this makes the Dow useless. As a quick read on a concentrated set of blue-chip industrial and consumer names, it does the job, and its century-plus data series is genuinely valuable for long-run comparisons few other indices can match.
For you, the practical rule is simple. If you want to know how your diversified portfolio performed on a given day, the S&P 500 is a closer proxy. The Dow tells you what 30 blue-chip stocks did, weighted by their share prices, not what the broad market did.
Dow Theory as a trend-reading framework
Charles Dow left behind more than an index. He also developed a methodology for reading market direction that still carries his name, and it is worth knowing as a lens, though not as gospel.
At its core, Dow Theory holds that a primary trend in the Dow Jones Industrial Average should be confirmed by a matching move in the Dow Jones Transportation Average, with trading volume acting as a secondary signal. The logic is that if goods are being made and shipped, both averages should agree.
The theory also breaks a market trend into three phases:
- Accumulation: informed investors quietly build positions while sentiment is still cautious.
- Public participation: the broader market notices the trend and follows in, driving prices further.
- Distribution: informed investors sell into the enthusiasm as public excitement peaks.
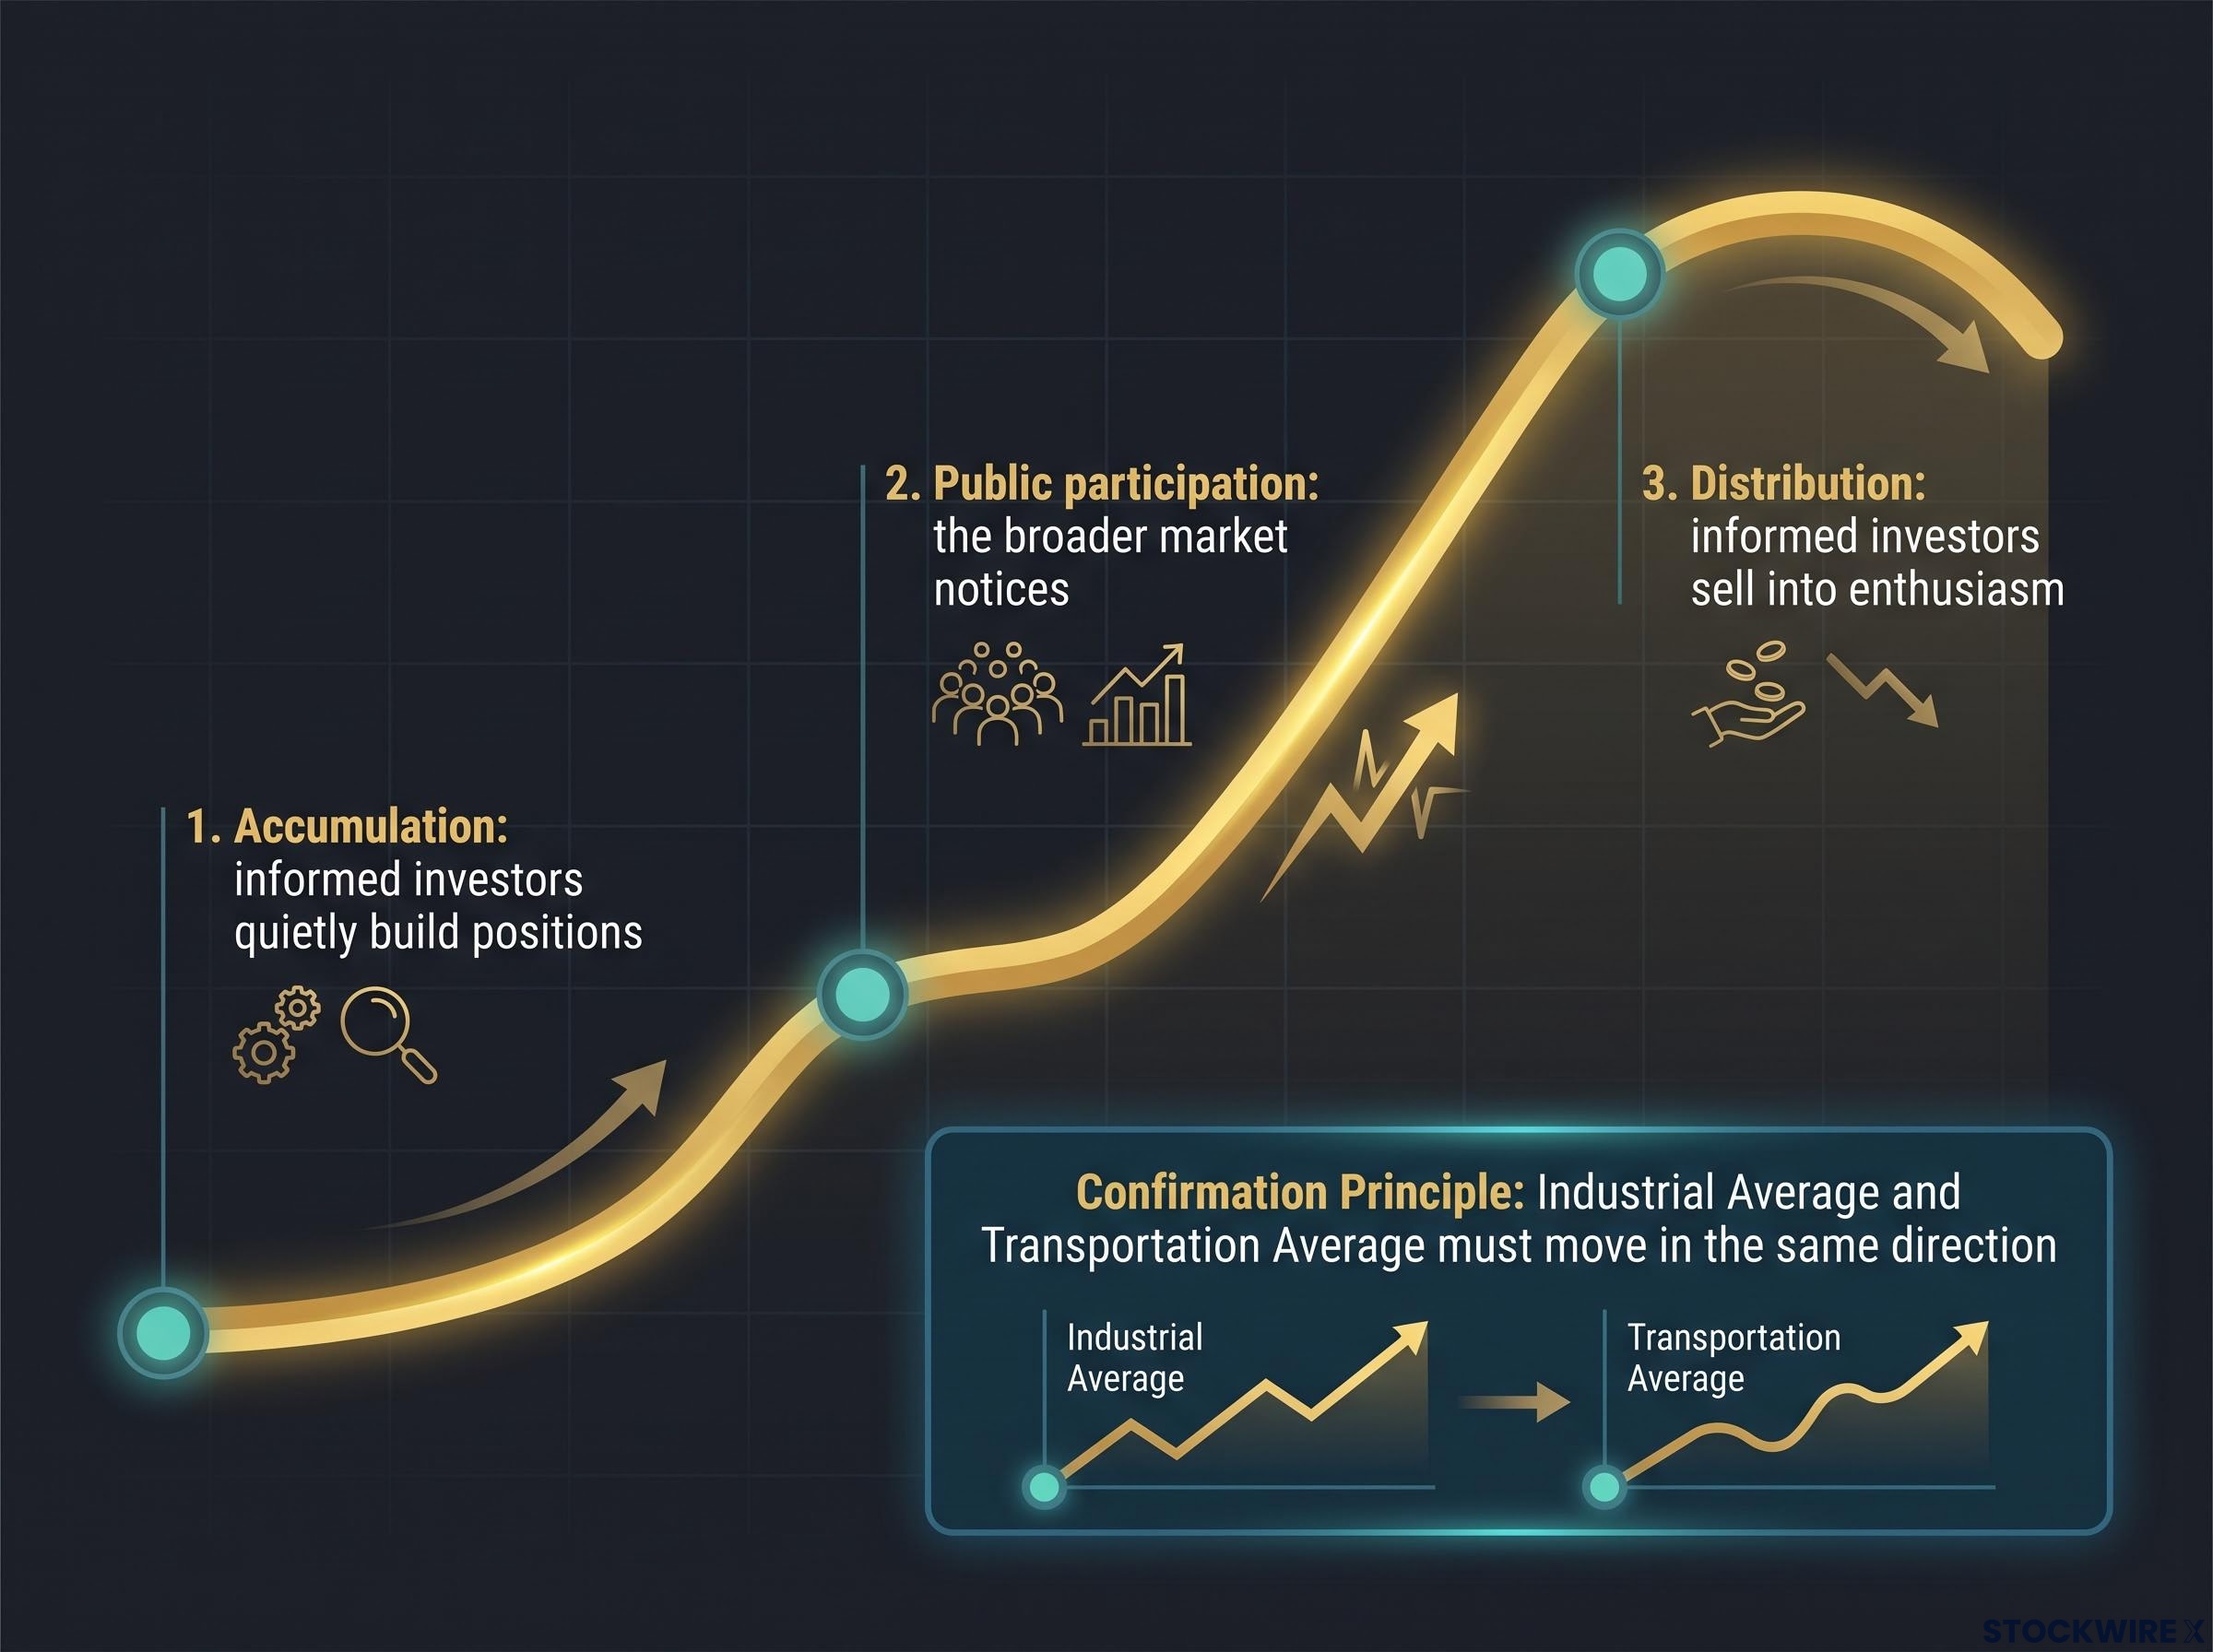
The confirmation principle Under Dow Theory, a primary trend is only validated when the Industrial Average and the Transportation Average move in the same direction. One average moving alone is treated as an unconfirmed, and therefore unreliable, signal.
The framework has genuine defenders and genuine critics. Supporters value it as a high-level trend compass, and they point out that many modern trend-following and momentum strategies echo its emphasis on higher highs, higher lows, and confirmation across economically linked sectors.
Critics counter that the U.S. economy has shifted heavily toward services and technology, so leaning on “industrials” and “transports” may no longer capture the full breadth of activity. In an era of globalised supply chains and digital business models, they argue, the old sector boundaries blur, weakening the premise that the two averages must confirm one another.
Where does that leave you? Dow Theory is most useful as a vocabulary for distinguishing a primary trend from short-term noise, not as a system for timing your entries and exits precisely. Used that way, it can stop you from reacting to a brief correction as though it signals a lasting change in direction.
Your options for investing in the Dow
If reading about the Dow has left you wanting exposure to it, you have several routes, ranging from the straightforward to the genuinely complex. Start with the simplest.
The most direct path for most people is the SPDR Dow Jones Industrial Average ETF (DIA). An exchange-traded fund holds a basket of stocks and trades on an exchange like a single share. DIA holds the Dow’s 30 components in proportion to the index, so buying one share gives you the whole basket.
The ETF wrapper makes the Dow’s 30-stock basket accessible as a single tradeable security, but it also layers in mechanics worth understanding: in-kind creation and redemption, expense ratios that compound over time, and a secondary market price that can briefly diverge from the underlying net asset value.
Investopedia frames DIA as the only direct Dow-tracking ETF available to U.S. investors, which makes it the default vehicle. According to State Street, as of 10 September 2026 it carries an expense ratio of 0.16% and holds roughly $45.4 billion in assets, with figures across sources landing between about $45.2 billion and $46.4 billion in mid-September.
Beyond the ETF sit mutual funds, then futures, then options, each step up carrying more complexity and more risk.
| Instrument | Example | Cost | Risk level | Best suited for |
|---|---|---|---|---|
| ETF | DIA | 0.16% expense ratio | Lower | Most retail investors seeking simple exposure |
| Mutual fund | Category only (no specific fund confirmed) | Varies by fund | Lower to moderate | Investors preferring managed, non-exchange vehicles |
| Futures contract | DJIA futures | Margin plus roll costs | High | Experienced traders hedging or speculating |
| Options contract | DJIA options | Premium plus time decay | High | Experienced traders managing directional bets |
The cost gap is the part to weigh consciously. DIA’s 0.16% expense ratio is higher than the 0.03% charged by popular S&P 500 ETFs such as VOO or IVV, and the 0.04% on total-market funds like SCHB. You are paying a premium for the Dow’s brand and concentration, a trade-off worth making on purpose rather than by default.
Futures and options: higher complexity, higher risk
Futures and options are a different category of instrument entirely, built for traders rather than buy-and-hold investors.
DJIA futures let you speculate on or hedge against the index’s future level, with leverage magnifying both gains and losses. The risks specific to derivatives include:
- Leverage: small index moves produce large gains or losses on your position.
- Margin requirements: you must post collateral, and losses can exceed your initial outlay.
- Expiration: contracts have a fixed end date, not an indefinite holding period.
- Roll costs: maintaining exposure means replacing expiring contracts, which costs money.
- Time decay: for options, value erodes as expiration approaches.
Options give you the right, but not the obligation, to buy or sell at a set index level, with time decay eating into the position’s value as expiry nears. The critical difference from holding DIA is downside. With a share of DIA, the most you can lose is what you invested. With futures, margin means your losses can exceed the amount you put in.
Advisors often position broad, low-cost cap-weighted ETFs as core holdings and treat Dow-specific exposure as a tactical or preference-driven addition.
Knowing the Dow’s limits makes it more useful, not less
The point of understanding the Dow’s structure is not to dismiss it. It is to use it well.
You now know the index is price-weighted, that it holds just 30 stocks, and that a handful of high-priced names can steer its daily direction. That knowledge lets you interpret its moves with far more precision than the average headline reader, who takes a point number at face value.
Its narrowness is a limitation, but its longevity and familiarity are genuine assets. The historical series stretching back to the late 19th century is uniquely long, and its constant presence in financial coverage makes it a shared reference point almost everyone recognises.
The core decision The Dow works beautifully as a historical and cultural benchmark. It works less well as the backbone of a portfolio management strategy, where a broad, low-cost index does more.
So here is the practical call. For building a core portfolio, a low-cost broad-market or S&P 500 ETF at 0.03% to 0.04% covers more ground than DIA at 0.16%. If you specifically want Dow exposure for tactical or historical-alignment reasons, DIA is the clearest vehicle, and you now have what you need to choose deliberately.
Next time you see “Dow down 300 points,” you will know to ask which stocks drove it, how it compares to the S&P 500, and whether it touches what you actually hold.
This article is for informational purposes only and should not be considered financial advice. Investors should conduct their own research and consult with financial professionals before making investment decisions. Past performance does not guarantee future results.