New Zealand’s services sector posted its strongest reading in nearly two years last month, and the headline looks like a clean recovery signal. The BNZ-BusinessNZ Performance of Services Index hit 51.2 in August, the highest since September 2023 and a third straight month above the expansion line. Then you look under the hood: of the five components that build that composite, three remained in contraction.
That gap is the whole story. It puts New Zealand’s services sector at a genuine test, whether it is finally climbing out of a long soft patch or setting up another false dawn. The sector already looked promising once in this cycle. It returned to expansion at 51.5 in December 2025, then slid back to 48.0 in February 2026 and 46.0 in March. Above 50 has not meant durable.
Here is what the sub-index data actually tells you, what the Reserve Bank’s tightening cycle adds to that reading, and what the combination means for the New Zealand dollar. By the time you finish, you will know how to read this data past the headline, and why that distinction matters for judging where the economy is heading.
What the PSI sub-indices reveal that the headline hides
The composite that produced 51.2 is not a single measurement. It is a weighted blend of five sub-components: New Orders/Business, Activity/Sales, Employment, Stocks/Inventories, and Supplier Deliveries. Fifty is the line between growth and contraction. When one component runs hot enough, it can arithmetically pull the whole index above the line while the majority sit below it.
That is exactly what happened in August.
How the composite calculation creates misleading signals
New Orders/Business came in at a strong 55.2. That reading alone was enough to lift the composite into expansion, even though three of the other four components stayed below 50. The three-month moving average of 50.9 was the best since July 2023, but it still sits under the index’s long-term average of roughly 52.8. So even the improved trend remains below the historical norm.
Finimize made the point cleanly, noting that the broader composite reading of 51.6 suggests the economy may still be growing, just not in a way that feels secure for many service firms. A number above 50 confirms direction. It says nothing about breadth.
The sub-index verdict: orders without commitment
The full breakdown shows where the fragility sits.
| Sub-Index | Reading | Status |
|---|---|---|
| New Orders/Business | 55.2 | Expansion |
| Stocks/Inventories | 50.8 | Marginal expansion |
| Activity/Sales | 49.4 | Contraction |
| Employment | 49.4 | Contraction |
| Supplier Deliveries | 49.0 | Contraction |
The pattern is orders without commitment. Firms are booking new business but not yet staffing or fulfilling it at scale. Activity/Sales and Employment both sit at 49.4, and Supplier Deliveries at 49.0 was the weakest of the lot. BNZ economists described the situation directly: the recovery remains narrowly based.
What that divergence tells you is that service firms are cautiously building a pipeline without committing to the cost of expansion. It is a real signal of confidence, but not yet a durable one. Katherine Rich, chief executive of BusinessNZ, flagged the same caution, pointing out that 60.8% of surveyed firms described conditions negatively.
“Further improvement is needed before a convincing turnaround can be confirmed,” said Katherine Rich, Chief Executive of BusinessNZ.
When big ASX news breaks, our subscribers know first
Why this expansion reads differently from previous false starts
Scepticism is warranted here, and the recent record earns it. This is not the first time in the cycle that the services index has crossed 50 only to fall back. Tracing the sequence shows why a single strong composite reading should never be treated as a turning point on its own.
- August 2025: PSI at 47.5, with the broader composite in contraction for a seventh consecutive month. A genuinely weak base.
- December 2025: PSI jumped to 51.5, the first expansion since February 2024. Employment still lagged at 49.6, a warning sign that firms were not hiring into the improvement.
- February and March 2026: The index reversed hard, printing 48.0 then 46.0. The December optimism did not hold.
- The current run: June 50.9, July 50.6, August 51.2. Three months above 50, but built on the same narrow foundation.
The December episode is the cautionary tale. A promising composite reading with a lagging employment sub-index preceded a two-month slide back into contraction. On the surface, August looks like a rerun.
There is one structural difference, and it matters. The December pop came before the Reserve Bank had committed to a clear direction. The current expansion is happening while the RBNZ is tightening, not easing. Demand is improving despite higher rates, not because of stimulus, which makes the underlying demand signal more credible than the December version.
ANZ captured the tension in its Weekly Data Wrap of 21 August 2026.
“Demand continues to improve, but hiring remains weak and the index is volatile month to month,” ANZ noted in its assessment of the services data.
That is the data point to watch. The employment sub-index staying below 50 is the difference between firms ordering and firms committing. Until it crosses and holds, the improvement is real but unconfirmed.
What the PSI means for RBNZ policy and how the data feeds into rate decisions
The services sector does not exist in isolation from the machinery that reads it. The Reserve Bank of New Zealand treats data like the PSI as one input among many, and understanding how a sub-index reading travels toward an Official Cash Rate decision explains why this expansion sits alongside the tightening path rather than against it.
The September 2026 OCR decision and its inflation context
On 2 September 2026, the RBNZ raised the OCR by 25 basis points to 2.75%, the second consecutive hike. The driver was not services strength. It was inflation, which ran at 4.1% in the June 2026 quarter, well above the Bank’s target band of 1% to 3% and its 2% midpoint.
The Committee framed the move as a gradual withdrawal of stimulus and described the current level as still accommodative. In plain terms, the RBNZ believes rates remain low enough to support activity even after two hikes, which leaves room for more.
Here is where the services profile becomes relevant to you if you are positioning around New Zealand rate expectations. A services sector in genuine, broad expansion would add to demand-side inflation pressure and give the RBNZ reason to tighten faster. The current narrowly based expansion, strong orders but weak hiring and activity, does the opposite. It signals improving demand without the wage and activity pressure that would force the Bank’s hand, which actually reduces the case for an accelerated tightening path.
What comes next: October pause or December hike?
The forward guidance is a genuine debate among the major banks, with the OCR path through year-end contested.
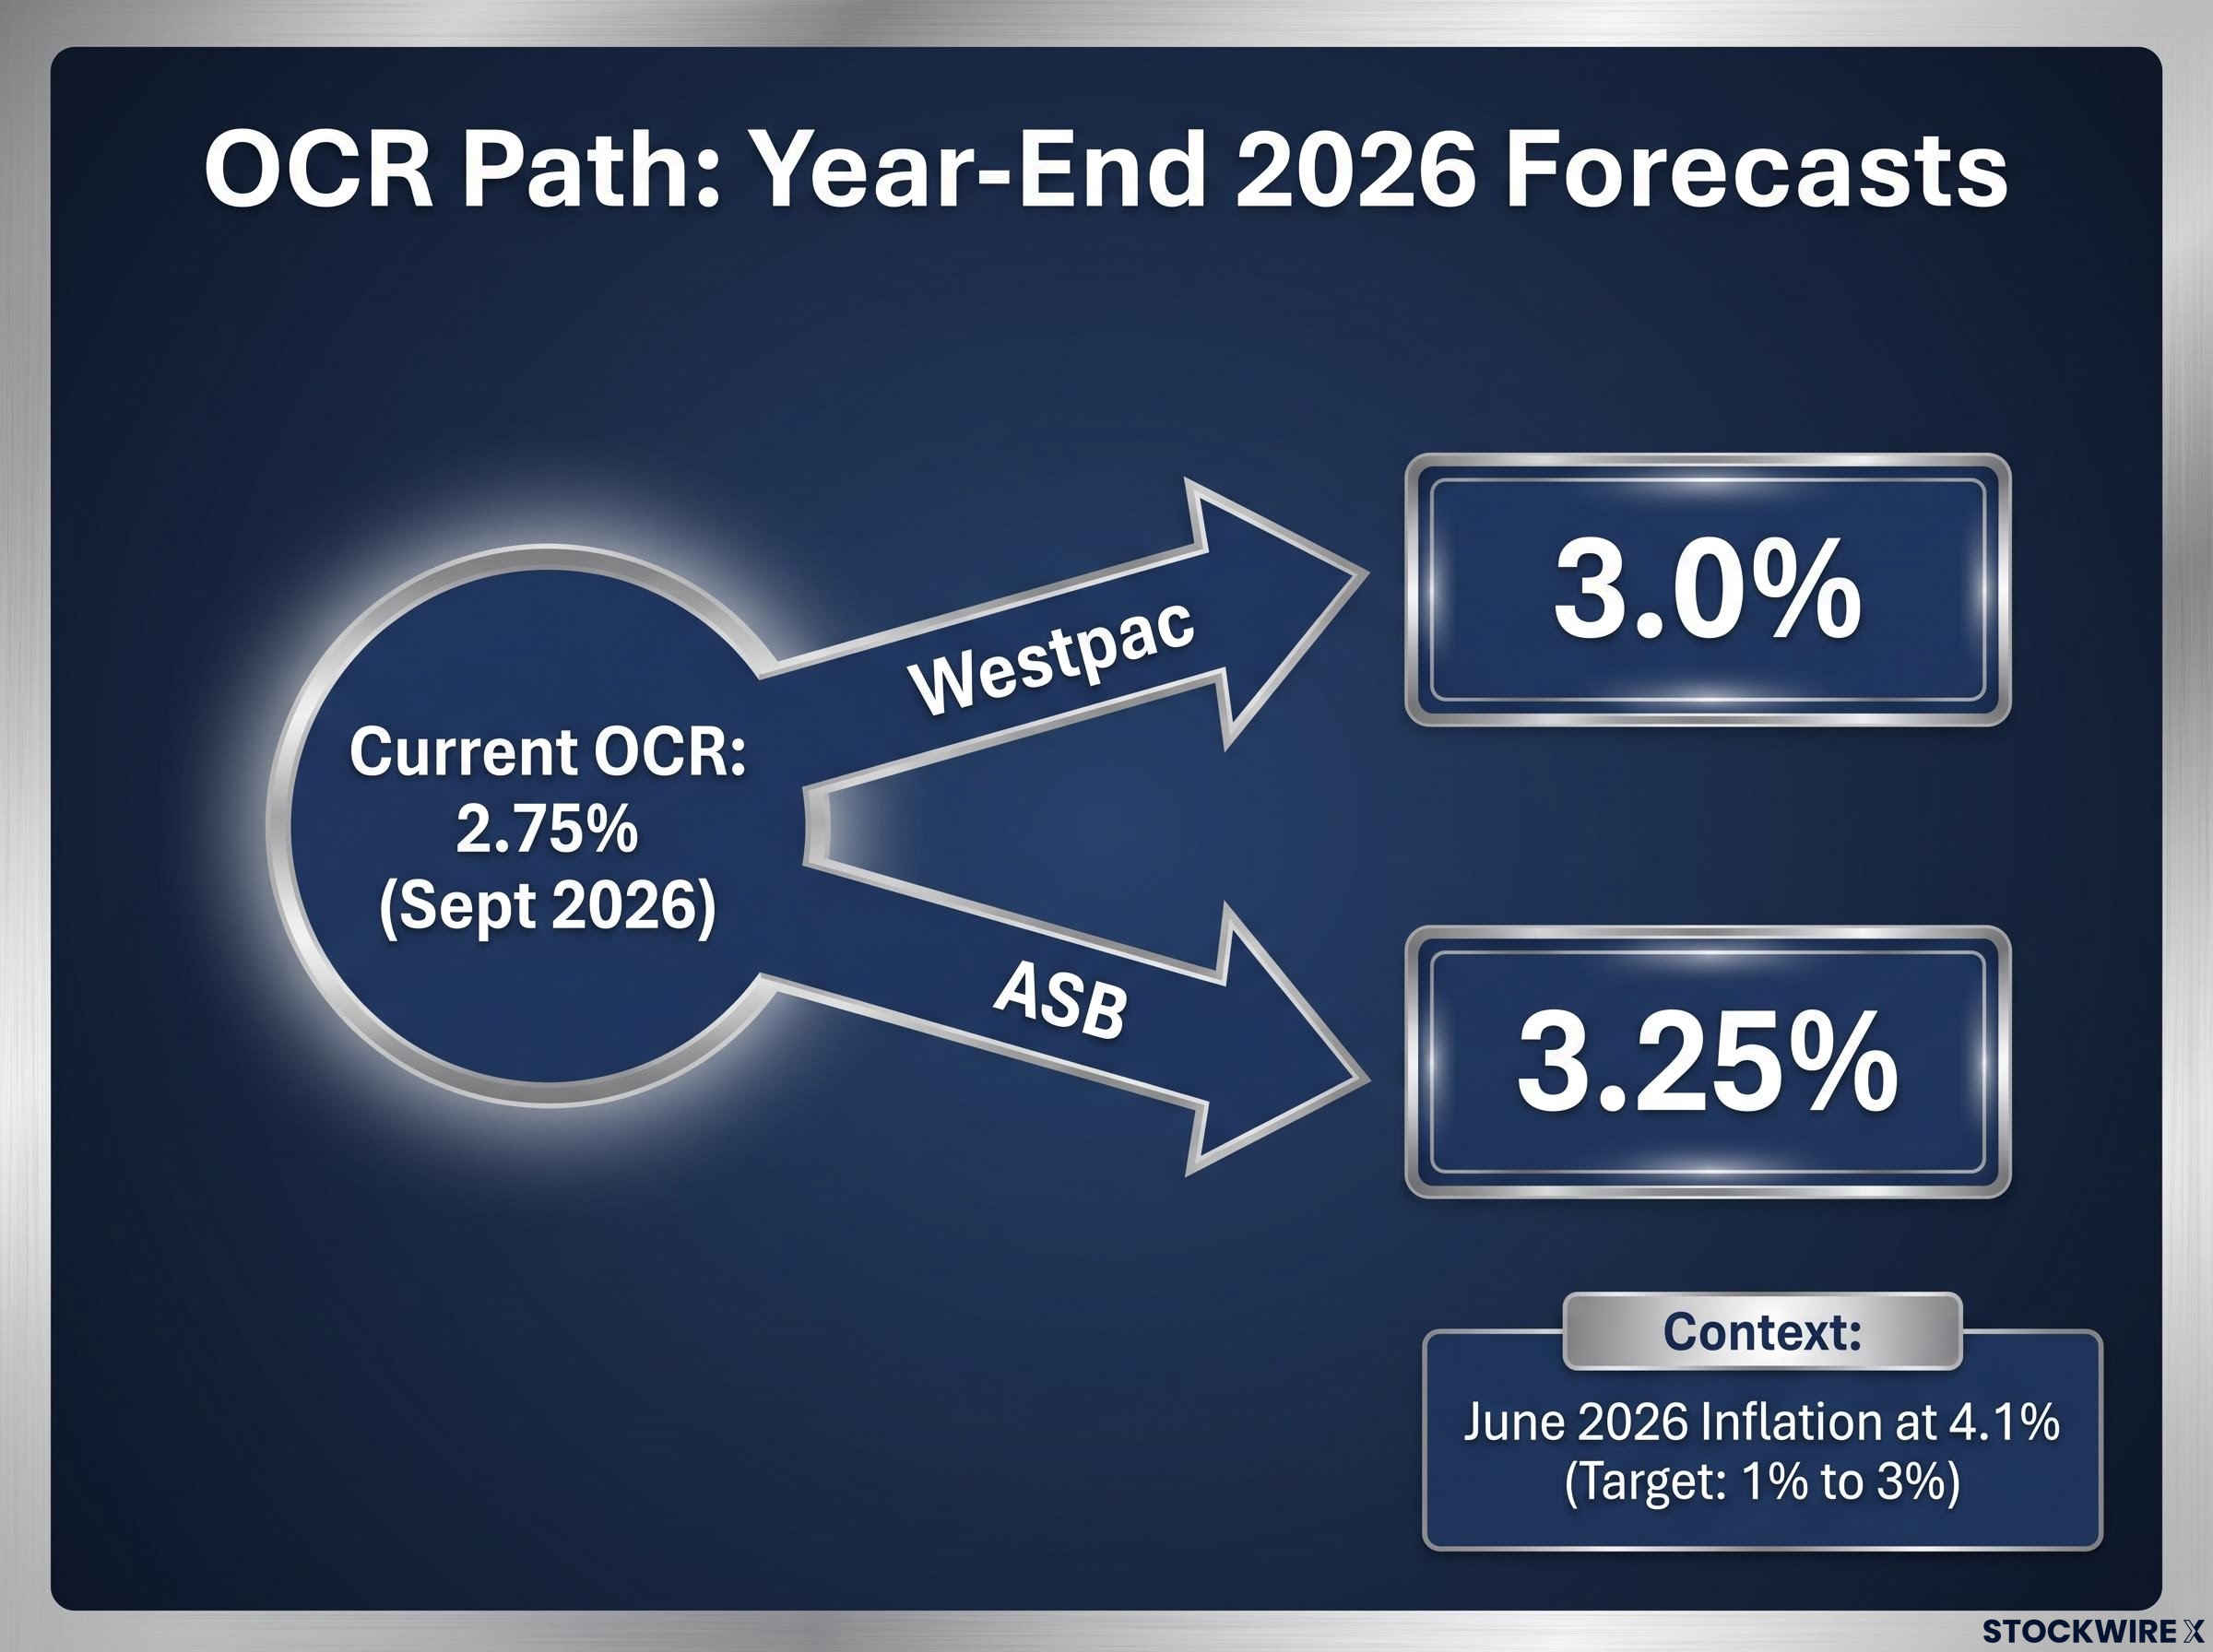
- Westpac: A pause at the October review, then a further 25bp hike to 3.0% in December 2026.
- ASB: The OCR climbing to 3.25% by year-end.
- Bloomberg’s reading of RBNZ projections: The Bank’s own track implies the chance of one further hike, with a less urgent push toward neutral.
The common thread is data-dependence. The next two reviews fall in October and December, and services, employment, and inflation readings will all feed the decision. If the sub-50 employment and activity components have not recovered by then, the case for a pause strengthens.
NZD/USD in a narrowly based recovery: where the currency sits and what could move it
Everything above converges on the currency. A narrowly based domestic recovery, a tightening cycle whose durability is contested, and heavy external sensitivity combine to make the New Zealand dollar a range-bound story with clear triggers on both sides, not a directional bet.
In early-to-mid September the pair traded in the high-0.58s: roughly 0.5811 on 11 September, 0.5835 on 9 September, and around 0.5850 in the week of 8 September. The forecast range clusters just above that.
| Source | Year-End Target | Publication Date |
|---|---|---|
| BNZ Currency Research | 0.59 (near-term range 0.56-0.60) | 8 September 2026 |
| TradingEconomics | 0.58 end-Q3, 0.60 in 12 months | 11 September 2026 |
| FXbankForecast | 0.60 (cross-firm median) | 8 September 2026 |
| Forecasts.org | 0.589 for September | 3 September 2026 |
| Mtfx Group | Near 0.59, range 0.58-0.62 | 1 September 2026 |
The most telling move is BNZ’s. On 8 September it cut its year-end target from 0.63 to 0.59, calling the prior expectation too ambitious. A four-cent downgrade tells you the earlier bullish consensus rested on assumptions that have not materialised. The 0.56 to 0.60 range is a more honest reflection of where the currency sits given the services sector’s structural fragility.
Three structural risks cap the upside.
- China demand fragility: TMGM reported the NZD weakening after Chinese imports undershot expectations, citing fragile domestic demand in New Zealand’s largest trading partner.
- RBNZ policy mis-pricing: ING warned that market pricing of roughly 95bp of tightening by mid-2027 looks too hawkish relative to the Bank’s own projections.
- Commodity sensitivity: Mtfx Group described the NZD as highly sensitive to Chinese growth, commodity prices, and global risk appetite, a pro-cyclical currency that struggles in risk-off conditions.
The one clear support is the interest rate differential. The RBNZ tightening relative to the US Federal Reserve makes the NZD more attractive to hold, but that support is conditional on the hikes actually arriving and China not deteriorating.
“We see some downside risks for NZD,” ING analysts warned, describing market pricing of roughly 95bp of tightening by mid-2027 as looking “way too hawkish.”
For anyone with NZD exposure, the takeaway is asymmetry. A narrowly based domestic recovery paired with heavy external sensitivity means the risk skews to the downside if either China or the OCR path disappoints.
What a genuine services recovery would actually look like
Rather than asking whether the recovery is real, the more useful question is what confirmation would actually look like, so you can judge it yourself as the next readings land.
Three benchmarks would signal durability.
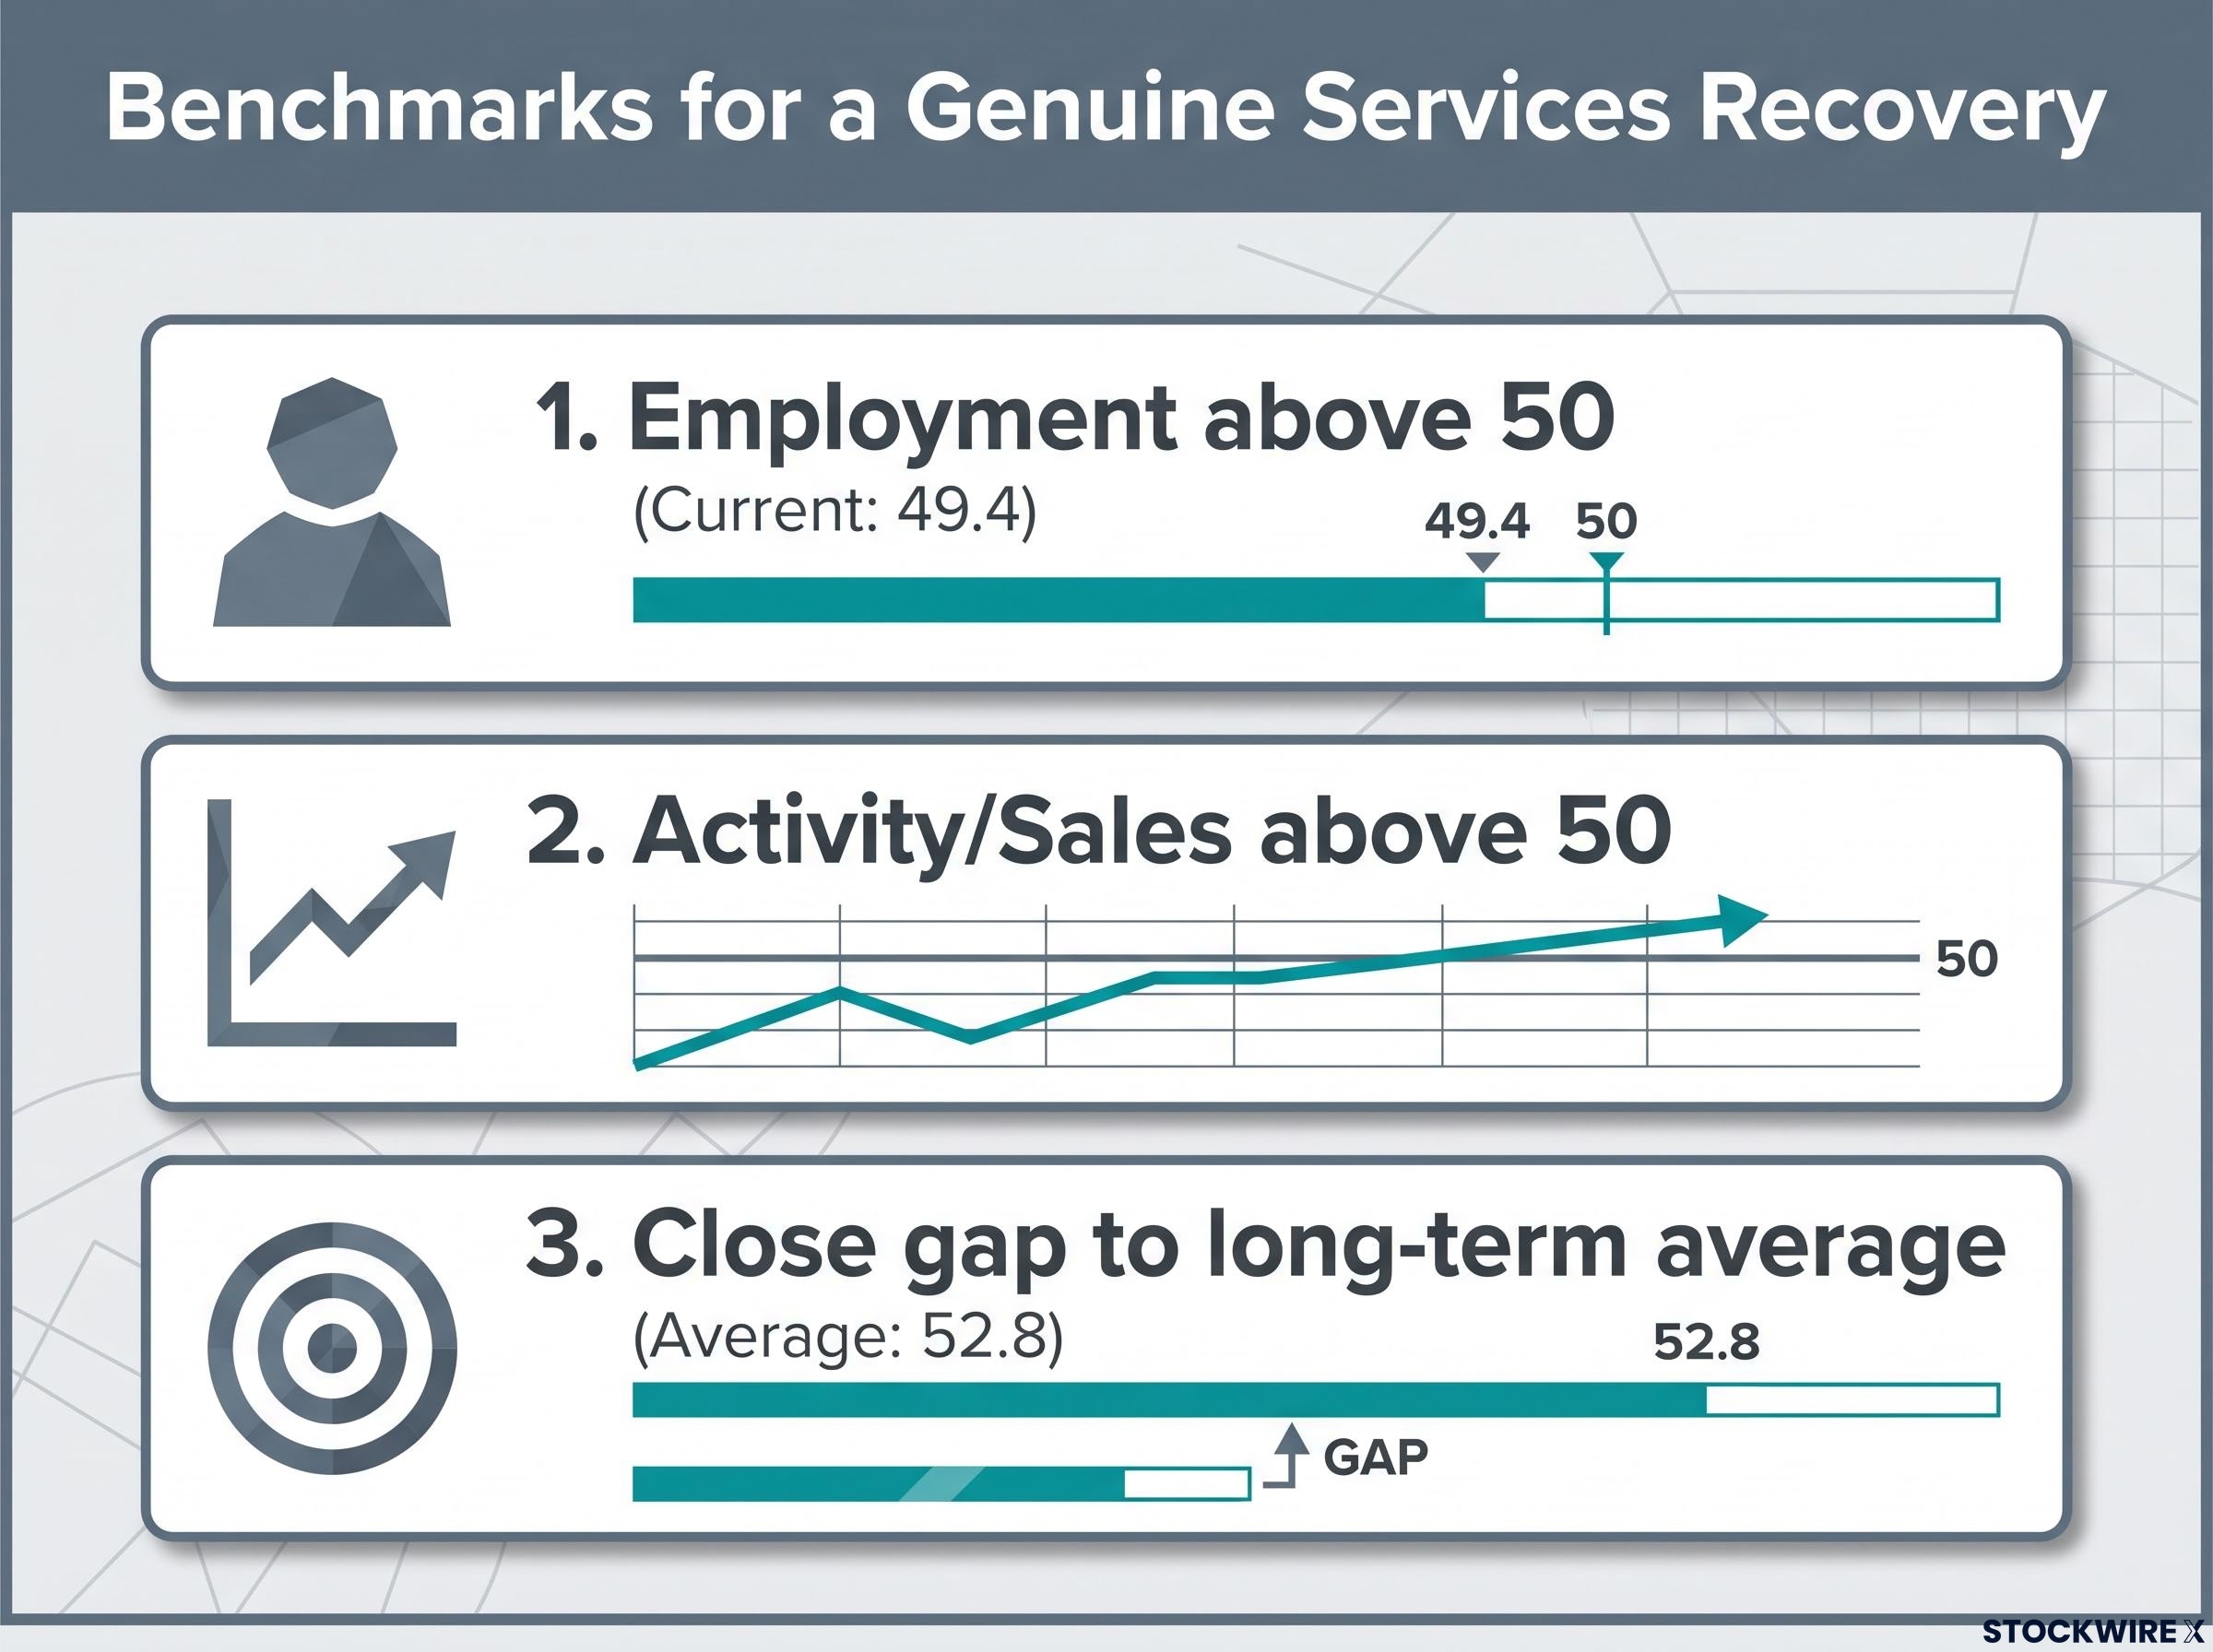
- Employment above 50 for two or more consecutive months, turning the current 49.4 from a lagging drag into a confirming signal.
- Activity/Sales recovering above 50, showing that booked orders are converting into current work rather than sitting in the pipeline.
- The composite closing the gap toward its long-term average of roughly 52.8, rather than hovering in the 51.0 to 51.5 band it occupies now, which is still 1.6 points short of the norm.
The underlying trajectory is genuinely contested, and the GDP forecasts show it.
Westpac projected 3.3% growth for 2026 (published February 2026), while ASB cited approximately 1.0% (published April 2026). Westpac’s figure predates the subsequent softening in activity data, leaving the trajectory genuinely contested.
The October and December OCR reviews are the near-term crunch points, where services, employment, and inflation data get synthesised into a decision. If the sub-50 employment and activity components have not recovered by then, the RBNZ faces a harder judgment on whether to hike again or pause. And if those components are still below 50 when the November PSI arrives, August’s headline will look in hindsight like another statistical echo rather than the start of something durable.
Three variables to watch before the October OCR review
The analysis maps onto a small number of concrete releases. Three variables will, within about six weeks, clarify whether August’s reading was signal or noise.
- The September PSI (due mid-October): specifically whether Employment and Activity/Sales finally cross 50, the single clearest test of whether firms have moved from ordering to committing.
- The next inflation indicator: confirmation of whether the June 4.1% reading is moderating back toward the target band or entrenching, which sets the ceiling on how far the RBNZ tightens.
- Chinese economic data: the external demand variable with the most direct read-through to the NZD, given China’s role as New Zealand’s largest trading partner.
The through-line pulls together neatly. Demand is improving but firms are not yet committing to it with hiring or supply. The RBNZ is tightening on inflation, not services strength. The NZD is range-bound in a window supported by the rate differential and capped by external risk. If the September PSI employment sub-index stays below 50, the October decision leans toward a pause, and the NZD likely holds the lower end of BNZ’s 0.56 to 0.60 range.
The confirmation to look for is sustained sub-index improvement, not one strong composite print. As Katherine Rich put it, more improvement is needed before any convincing turnaround can be called.
This article is for informational purposes only and should not be considered financial advice. Investors should conduct their own research and consult with financial professionals before making investment decisions. Past performance does not guarantee future results. Financial projections are subject to market conditions and various risk factors, and forward-looking statements are speculative and subject to change based on market developments.