In one week this September, oil surged more than 8%, short-term Treasury yields climbed 26 basis points, and US inflation printed hotter than forecast. Equity markets fell less than 1%.
That gap between the size of the punches thrown and the size of the flinch is a puzzle worth solving, and it has not been a one-off. Throughout 2025 and into 2026, macro shocks have repeatedly bounced off equity markets, prompting institutions from BlackRock to the Bank for International Settlements (BIS) to work out why. The stock market resilience on display has been real, structural, and increasingly scrutinised.
The question now is whether that durability holds as a new kind of unease takes shape, this time around whether AI spending can actually turn into earnings, a concern Danske Bank has tracked through successive waves. What follows here gives you a clear framework for understanding both why markets have been so hard to rattle and what would need to shift before that changes.
Three simultaneous shocks that barely moved the needle
Consider the week ending 11 September 2026 on its inputs alone, and you would expect a sell-off.
First came the inflation print. A US Consumer Price Index (CPI) reading, the main gauge of how fast consumer prices are rising, landed warmer than forecasters expected, which nudged up the market-implied odds of a Federal Reserve rate increase.
Then the bond market repriced. Short-dated yields, which move most directly on rate expectations, climbed across both US and European markets.
Then oil spiked, driven by shipping attacks in the Middle East and tight physical supply. Here is the cumulative weight, quantified:
Oil price shocks that originate in geopolitical supply disruptions carry a different transmission path than demand-driven rallies: shipping attacks and port embargoes compress supply with little warning, which is why the Middle East-driven spike to above $107 in September 2026 hit corporate margin calculations faster than Fed policy expectations adjusted.
- US CPI came in above consensus, lifting expectations of another Fed hike
- The US 2-year Treasury yield rose 0.263 percentage points to 4.642% over the week
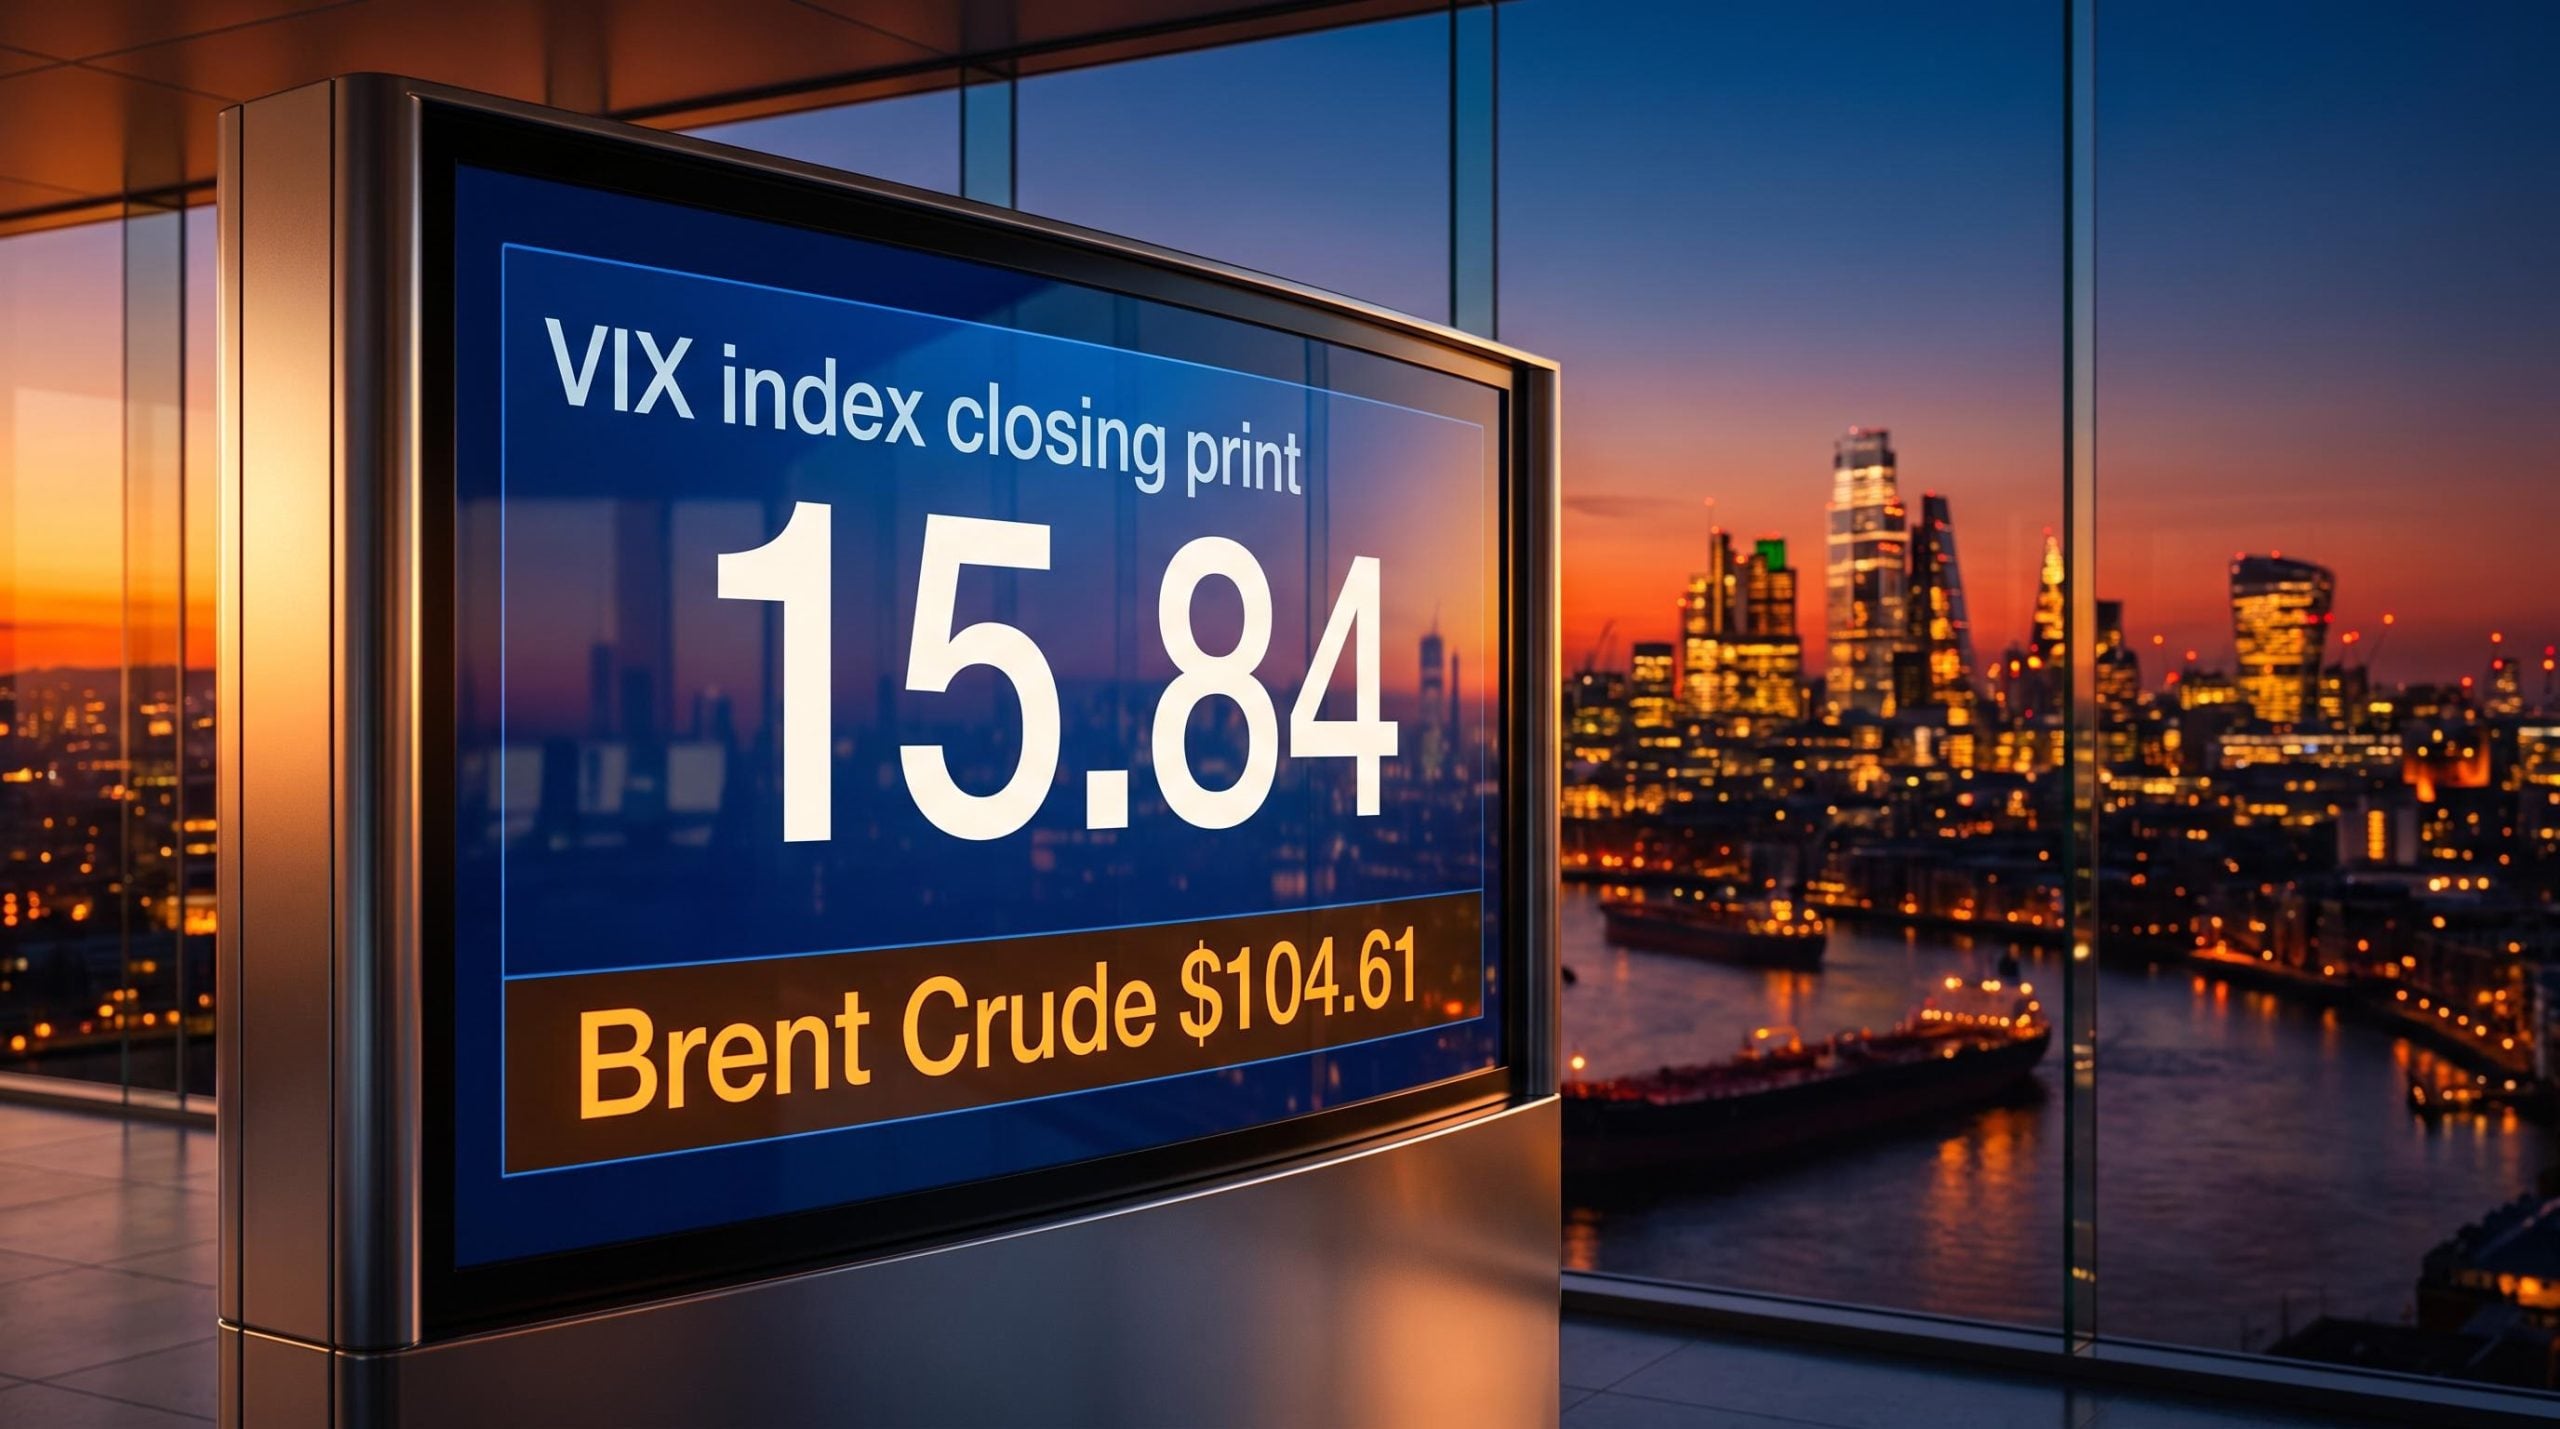
- Brent crude jumped 6.34% to $107.63 on 10 September, with WTI up 6.69% to $102.48, before Brent settled at $104.61 the next day, a weekly gain above 8%
Three shocks, hitting inflation, rates, and commodities at once. The equity response? The broader market finished the week down roughly 1%.
More telling than the index move was what happened to volatility. The CBOE Volatility Index (VIX), which measures how much price swing options traders are bracing for, fell rather than rose.
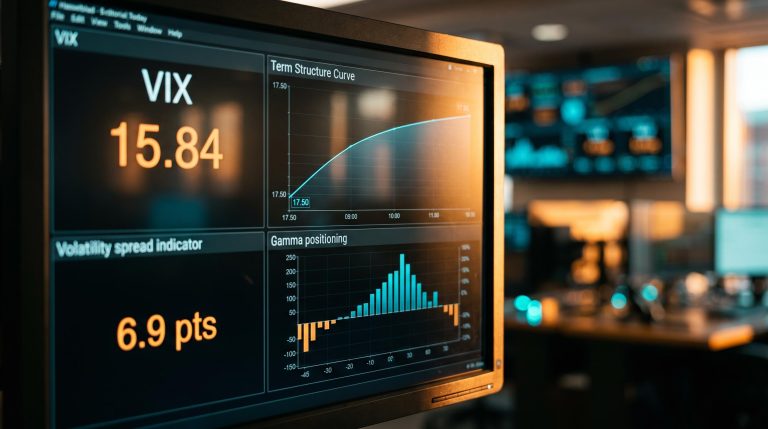
The VIX close: 15.84 On 11 September 2026, the VIX closed at 15.84, down 11.21% on the day, even with oil trading above $100. It had touched only 17.84 the session before.
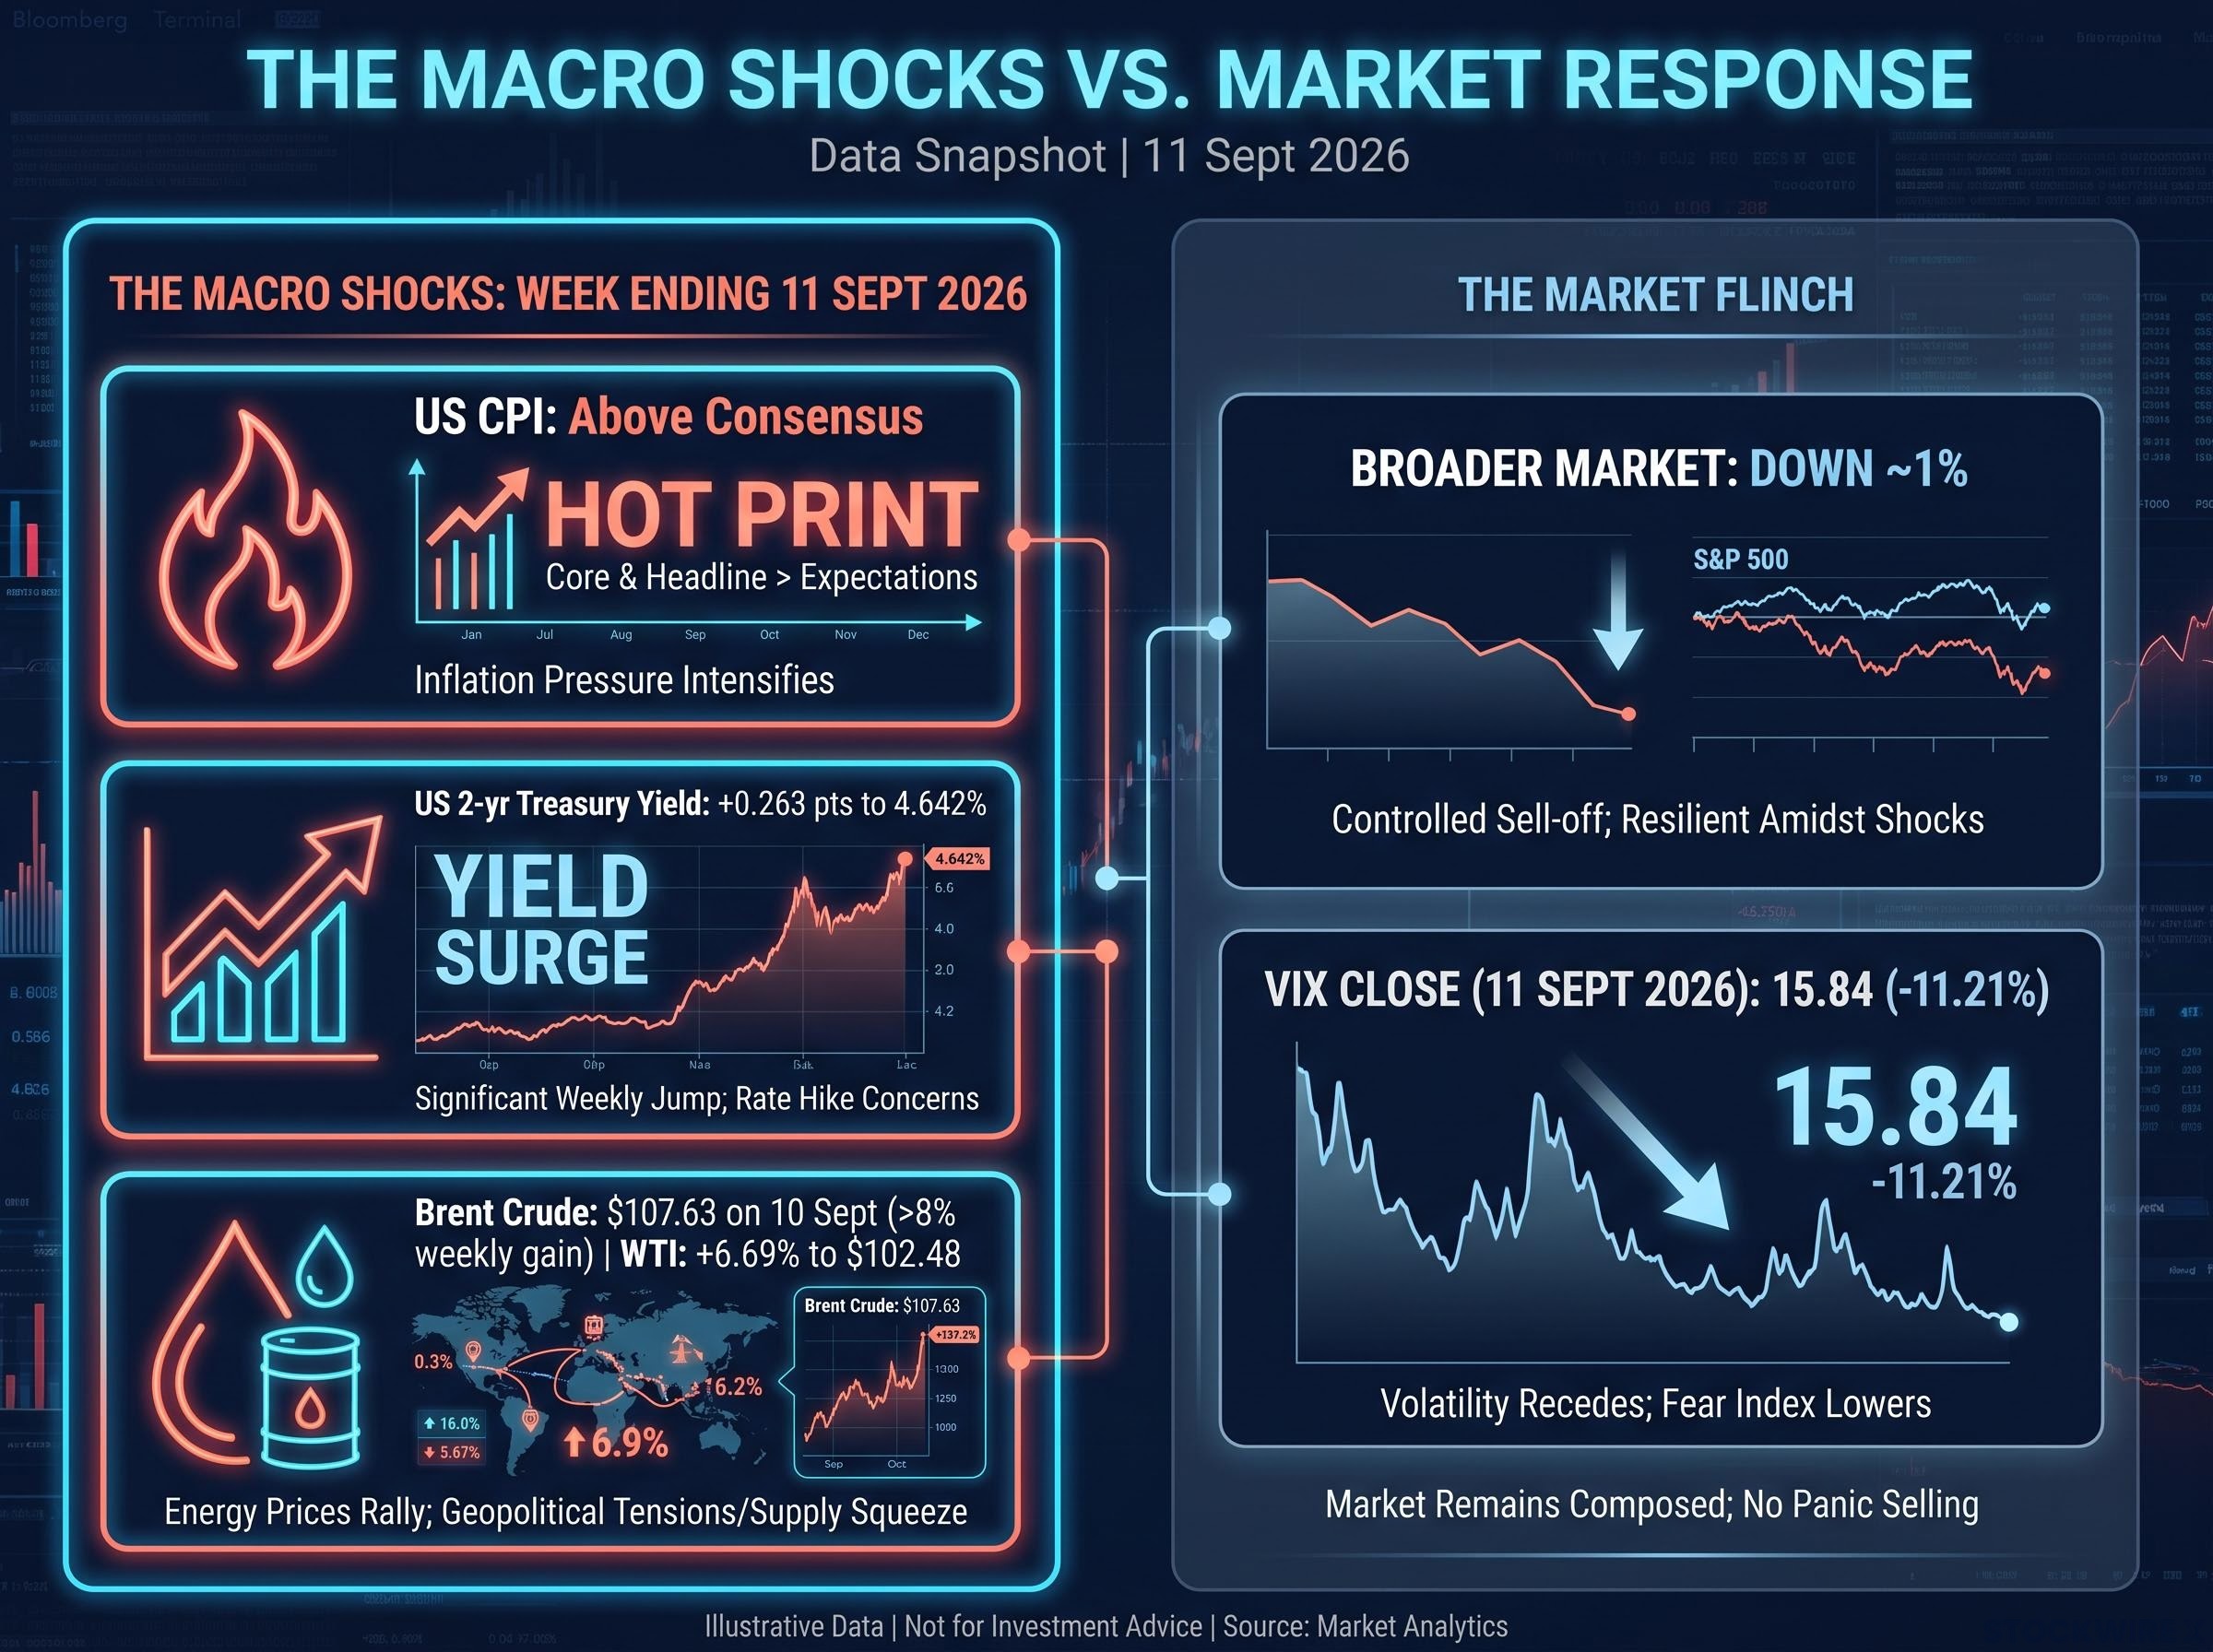
A VIX in the mid-teens during a week of simultaneous commodity, inflation, and yield pressure tells you something specific: professional options markets were not pricing genuine fear. That is a signal worth understanding before you draw any conclusion about where the market goes next.
When big ASX news breaks, our subscribers know first
What actually holds markets up when everything else pushes down
If the response was that muted, the natural question is what was doing the holding. The answer is not luck or mystery. It is several forces compounding at once, each identified by a named institution.
The first is earnings and AI-driven productivity optimism. UBS’s Chief Investment Office argued in March 2025 that equities could absorb rising yields precisely because enthusiasm for AI and strong corporate earnings underpinned the market.
The second is balance sheet strength. BlackRock noted in January 2025 that large US companies hold solid balance sheets and cash-flow momentum, leaving them room to advance provided rate increases stayed modest.
The third is limited tariff pass-through. Morgan Stanley explained in January 2026 that equities weathered new tariffs because import-cost exposure was cushioned by deferrals and pre-stocked inventory, with a sharp rebound in earnings revisions adding fundamental support.
The fourth is a policy expectation: confidence that central banks will act to prevent severe downturns, a factor the BIS and European Central Bank (ECB) have linked to compressed risk premia.
| Resilience driver | Source and date | Mechanism |
|---|---|---|
| Earnings and AI optimism | UBS CIO, March 2025 | AI enthusiasm and strong earnings offset the drag from rising yields |
| Balance sheet strength | BlackRock, January 2025 | Cash-flow momentum lets large US firms advance if rate rises stay modest |
| Limited tariff pass-through | Morgan Stanley, January 2026 | Deferrals and pre-stocked inventory delayed import-cost impact |
| Policy backstop expectation | BIS and ECB | Belief central banks will prevent severe downturns compresses risk premia |
The scale of the underlying rally gives these drivers weight. The S&P 500 had climbed 13% year-to-date by the period Allianz Investment Management cited in Q4 2025, while DWS reported the MSCI ACWI returned 10.1% in H1 2025 and rallied over 24% from its April 2025 trough.
What sector behaviour reveals that index moves conceal
The most precise clue that week was not the index at all. It was which sectors led.
Cyclical sectors, the ones whose fortunes track the economic cycle, outperformed defensive sectors during the shock week. That matters because cyclicals lead when investors feel confident about growth, not when they are hiding.
MSCI’s cyclical and defensive sector classifications define the two groups by how closely each sector’s returns track the broader economic cycle, with cyclicals expanding in upturns and contracting in downturns, which is why their outperformance during a multi-shock week carries a specific signal about how institutional investors were reading growth prospects.
Contrast that with a genuine risk-off event, where you would expect defensives such as consumer staples and utilities to lead as money seeks shelter. That did not happen. The sector map read as confidence, which tells you more about underlying sentiment than the headline move down does. It also helps you separate a market that is genuinely durable from one that is simply slow to reprice.
How AI anxiety has evolved through three distinct phases
That same confidence, though, is now bumping into a doubt that keeps reinventing itself. AI-related fear has not stood still. It has matured through three distinct waves, each asking a harder question than the last.
- First wave (late 2025), valuation and over-investment. The dominant worry was a bubble. A Bank of America fund manager survey in October to November 2025 found a record 54% of global managers viewed AI stocks as being in a bubble, naming it the top global tail risk.
- Second wave (early 2026), capacity and disillusionment. In January 2026, Deutsche Bank framed the fear around three themes: disillusionment (the gap between promise and real-world impact), dislocation (booming demand straining physical capacity), and distrust (rising political and legal pushback).
- Third wave (mid-to-late 2026), monetisation and capital allocation. The focus shifted to whether heavy AI spending can produce returns at all, a concern Danske Bank has led in tracking.
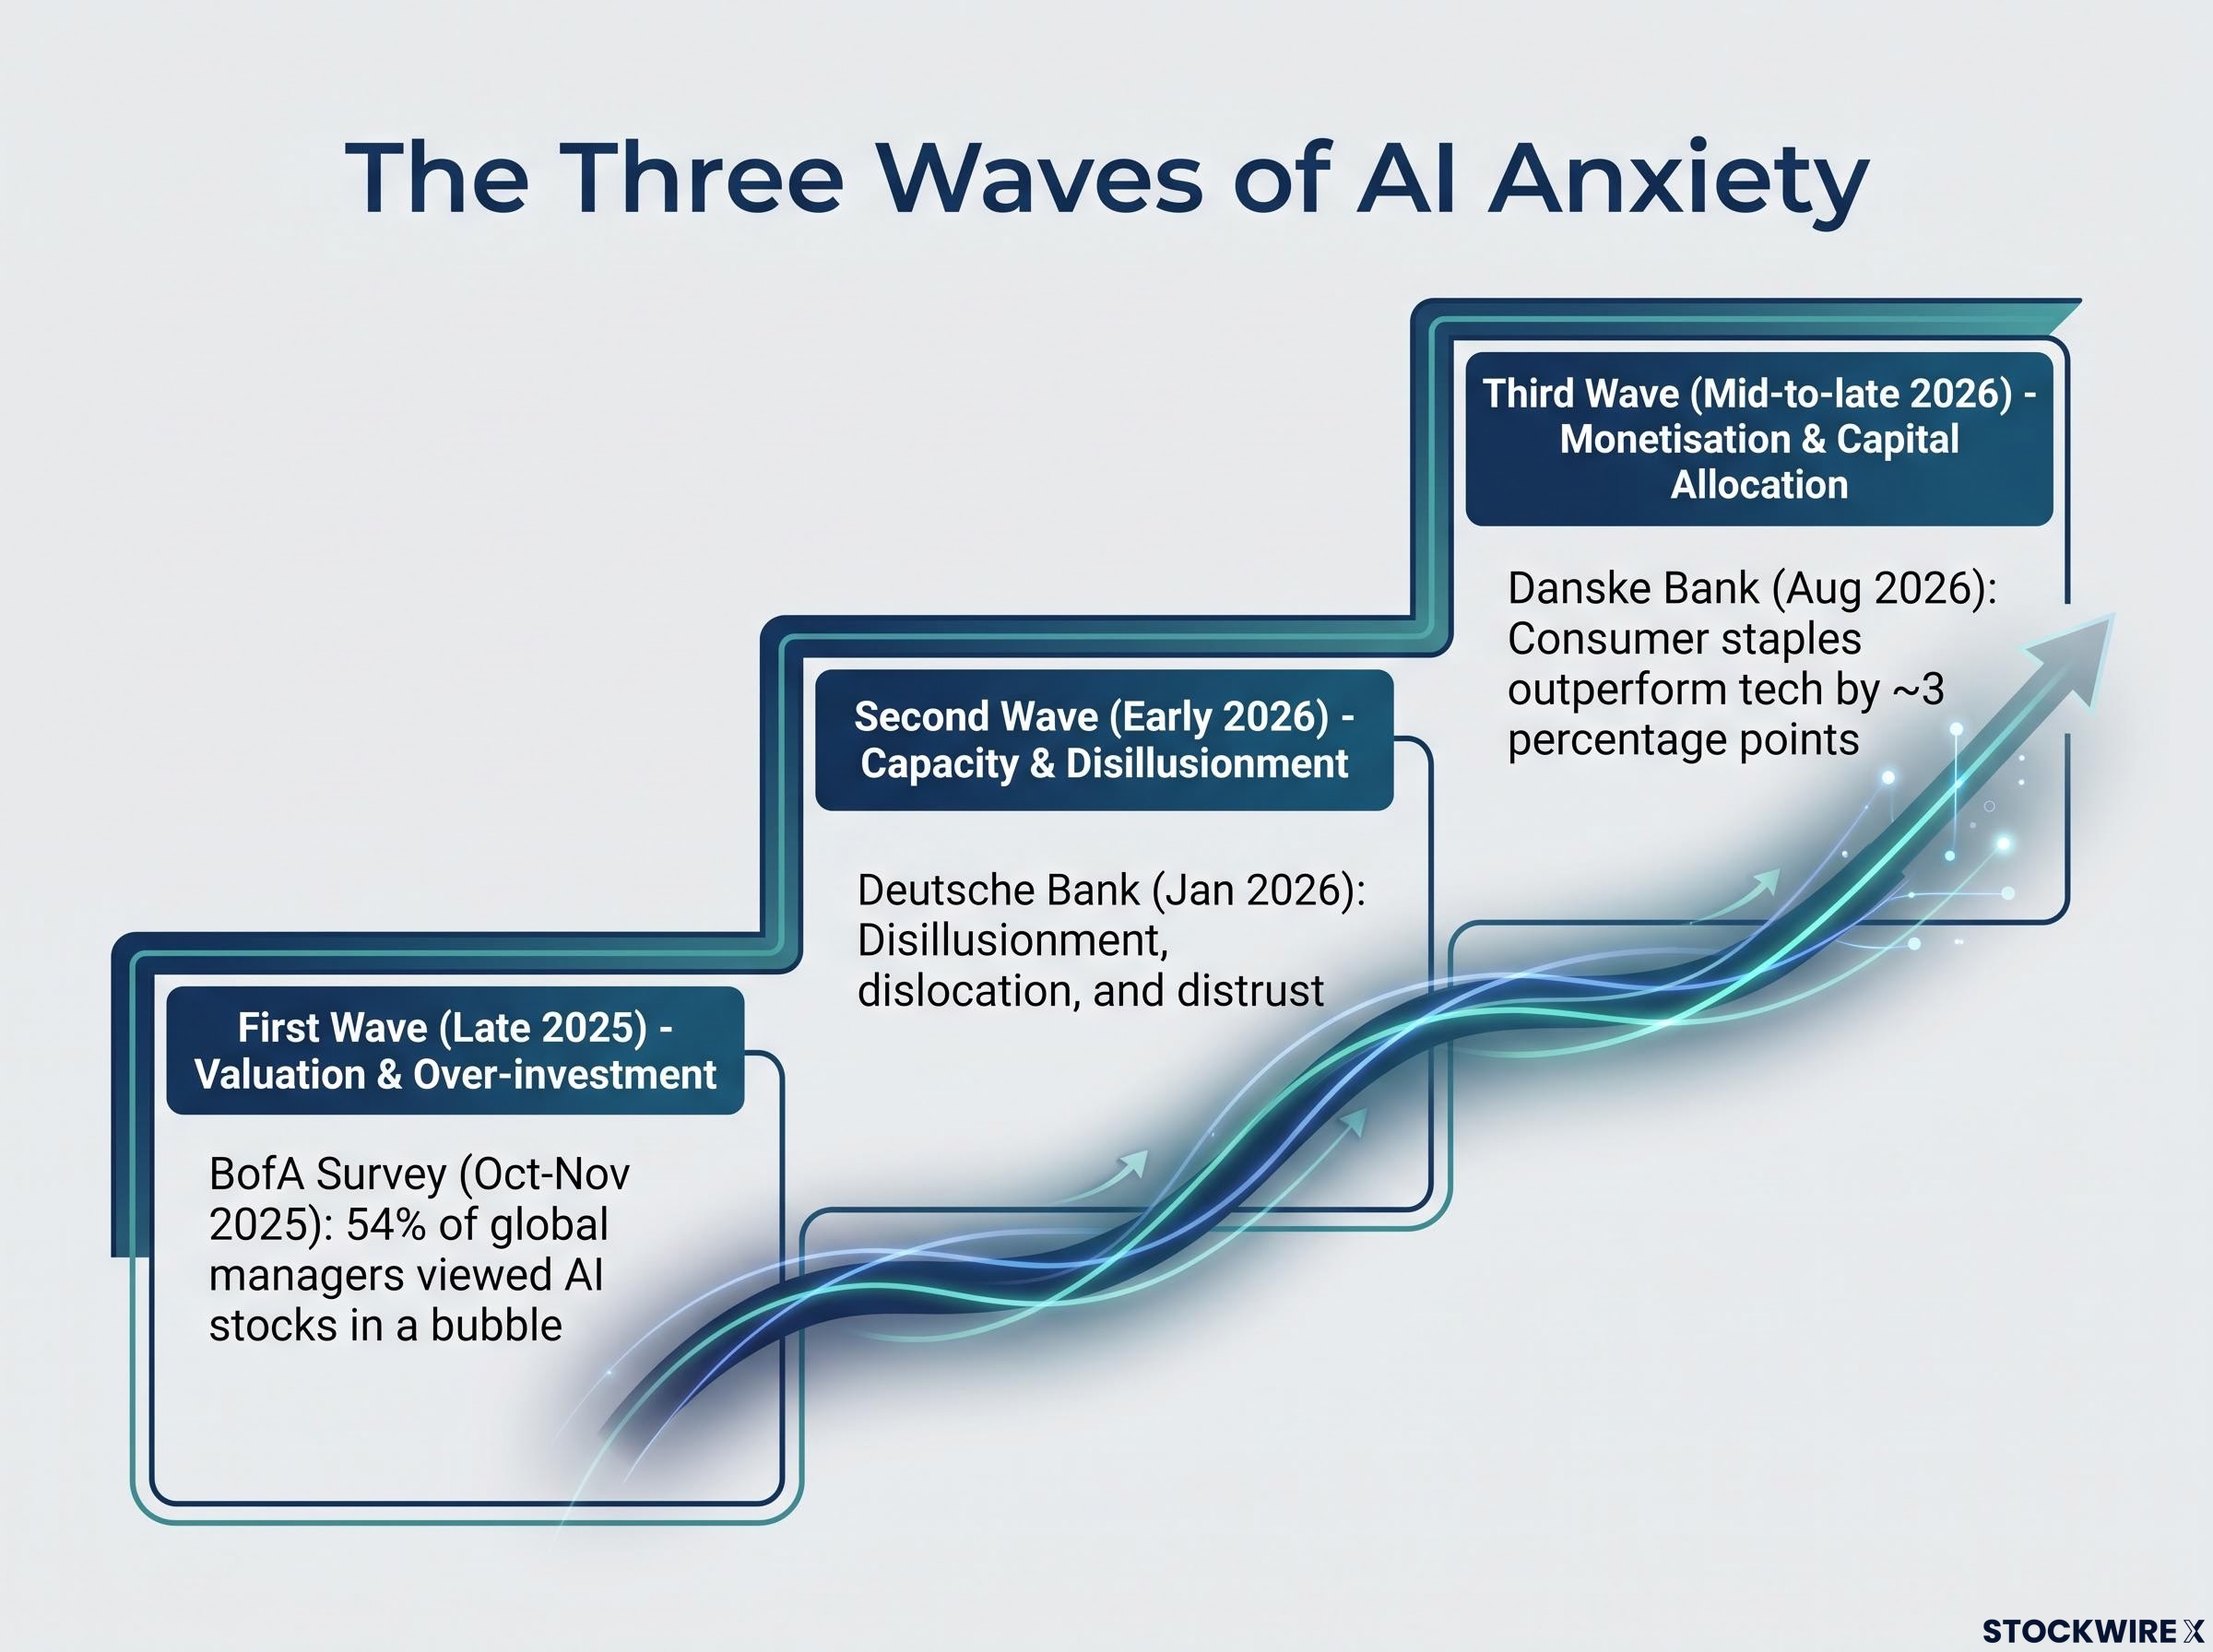
A record bubble reading At the peak of the first wave, 54% of global fund managers surveyed by Bank of America viewed AI stocks as being in a bubble, the single largest tail-risk reading in the survey.
Danske Bank’s commentary maps the current phase closely. In April 2026, the bank reported global equities slipping on renewed concerns about AI monetisation after OpenAI’s revenue warning, while cautioning against reading it as a broad demand slowdown.
By August 2026, Danske observed that AI jitters drove consumer staples to outperform technology by roughly 3 percentage points, which it interpreted as rotation within equities rather than wholesale de-risking. The BIS added structural heft, warning that fierce competition was pushing firms to pour too much money into AI projects whose returns remain uncertain.
The move from wave one to wave three is the important part. Asking whether these stocks are overvalued is a sentiment question that optimism can answer. Asking whether these companies can convert AI spending into earnings is a delivery question, and it is far harder to dismiss with enthusiasm alone. That is why this phase carries more structural weight than the two before it, and why knowing which type of concern is driving a given move is a sharper lens than treating all AI volatility as the same thing.
AI valuation risk is compounded by a distributional problem that index-level calm actively conceals: large opposing moves by individual AI winners and losers cancel each other out inside the benchmark, leaving investors exposed to single-stock concentration they believe they have diversified away through passive ownership.
Where the complacency argument comes from, and why it deserves attention
Set the resilience evidence beside the AI delivery question, and a third view emerges: that the calm itself is the risk. This is not a fringe position. It is being made by central banks and major research houses.
- The RBA (February 2025) flagged equity risk premia at multi-decade lows, with markets pricing very low odds of adverse scenarios
- The IMF described the market calm as “uneasy,” warning that easy liquidity and stretched valuations raise the chance of non-linear reactions
- The ECB (November 2025) named persistently high valuations and rising market concentration as vulnerabilities
- Nomura (September 2026) warned that the AI boom has masked a rising US risk premium
That Nomura warning carries a mechanism worth spelling out.
Compressed volatility signals in a high-rate environment carry a specific historical warning: both the mid-1990s regime that ended with the Asian crisis and the mid-2000s calm that preceded the Global Financial Crisis showed that low VIX readings alongside elevated skew can reprice rapidly and non-linearly when correlations shift.
Nomura’s warning, September 2026 The AI boom has masked a rising US risk premium. Because global savings are so concentrated in US dollar assets, a setback in the AI rally could trigger a sharp correction in US assets and weaken the dollar at the same time.
For you, that matters directly if you hold internationally diversified assets. The usual assumption is that dollar exposure acts as a safe anchor. Nomura’s point is that the anchor could drag in exactly the scenario where AI sentiment reverses, with equities and the dollar falling together rather than one offsetting the other.
Scenarios that could finally break the pattern
None of this is a forecast that a correction is imminent. It is a set of conditions to monitor. Three stand out.
- A sustained AI capex earnings disappointment cycle, where spending keeps rising but returns keep failing to arrive, the risk the BIS flagged directly.
- A further sharp rise in yields. LSEG’s 2025 Mid-Year Outlook noted the equity-bond yield correlation had turned negative, meaning further yield rises could pressure equities acutely rather than gently.
- A dollar-weakening event triggered by US risk premium repricing, the correlated shock Nomura describes.
For calibration, Capital Economics suggested in February 2026 that the S&P 500 could rally toward 8,000 before “collapsing under its own weight,” penciling in a 13% base-case correction and up to 30% in a worst case. Goldman Sachs had earlier, in January 2025, raised the probability of an equity drawdown to roughly 30%. Treat these as calibrated estimates, not predictions.
What shifts the calculus from resilience to repricing
So you are left with two forces in genuine tension. On one side sit real structural underpinnings: strong earnings, healthy balance sheets, and cyclical leadership signalling confidence. On the other sits a growing institutional consensus that risk premia are too compressed and AI capital allocation is under-scrutinised.
The useful distinction is not bull versus bear. It is durable strength versus deferred reckoning, and it determines whether current conditions call for holding positions, rotating defensively, or trimming concentration in AI-exposed names.
That is not a call to make blind. Here is a practical watching brief, three signals that would tip the assessment from resilience toward repricing:
- A sustained shift from cyclical to defensive leadership. Danske Bank read the August 2026 defensive outperformance as rotation, not de-risking. A persistent shift, rather than a single week, would suggest that reading no longer holds.
- A VIX break above 20 in a yield-pressure context. Against the 15.84 close on 11 September 2026, a move above 20 driven by rate stress rather than an isolated shock would mark a change in how options markets price risk.
- A meaningful downward revision to AI-linked earnings estimates. Not a single-quarter miss, but a pattern of cuts, which is the earnings-delivery failure the BIS warned about.
The Asian IT-led declines that accompanied the latest Danske commentary hint the third wave is already taking hold. Watch these three signals, and you are positioned to think rather than react.
For readers wanting to apply a systematic framework to the three warning signals identified here, our dedicated guide to fragile market rally signals covers how narrow AI-linked leadership, unvalidated productivity assumptions, and private credit risks compound into a specific early-warning checklist.
This article is for informational purposes only and should not be considered financial advice. Investors should conduct their own research and consult with financial professionals before making investment decisions. Past performance does not guarantee future results, and financial projections are subject to market conditions and various risk factors. Forward-looking statements are speculative and subject to change based on market developments.