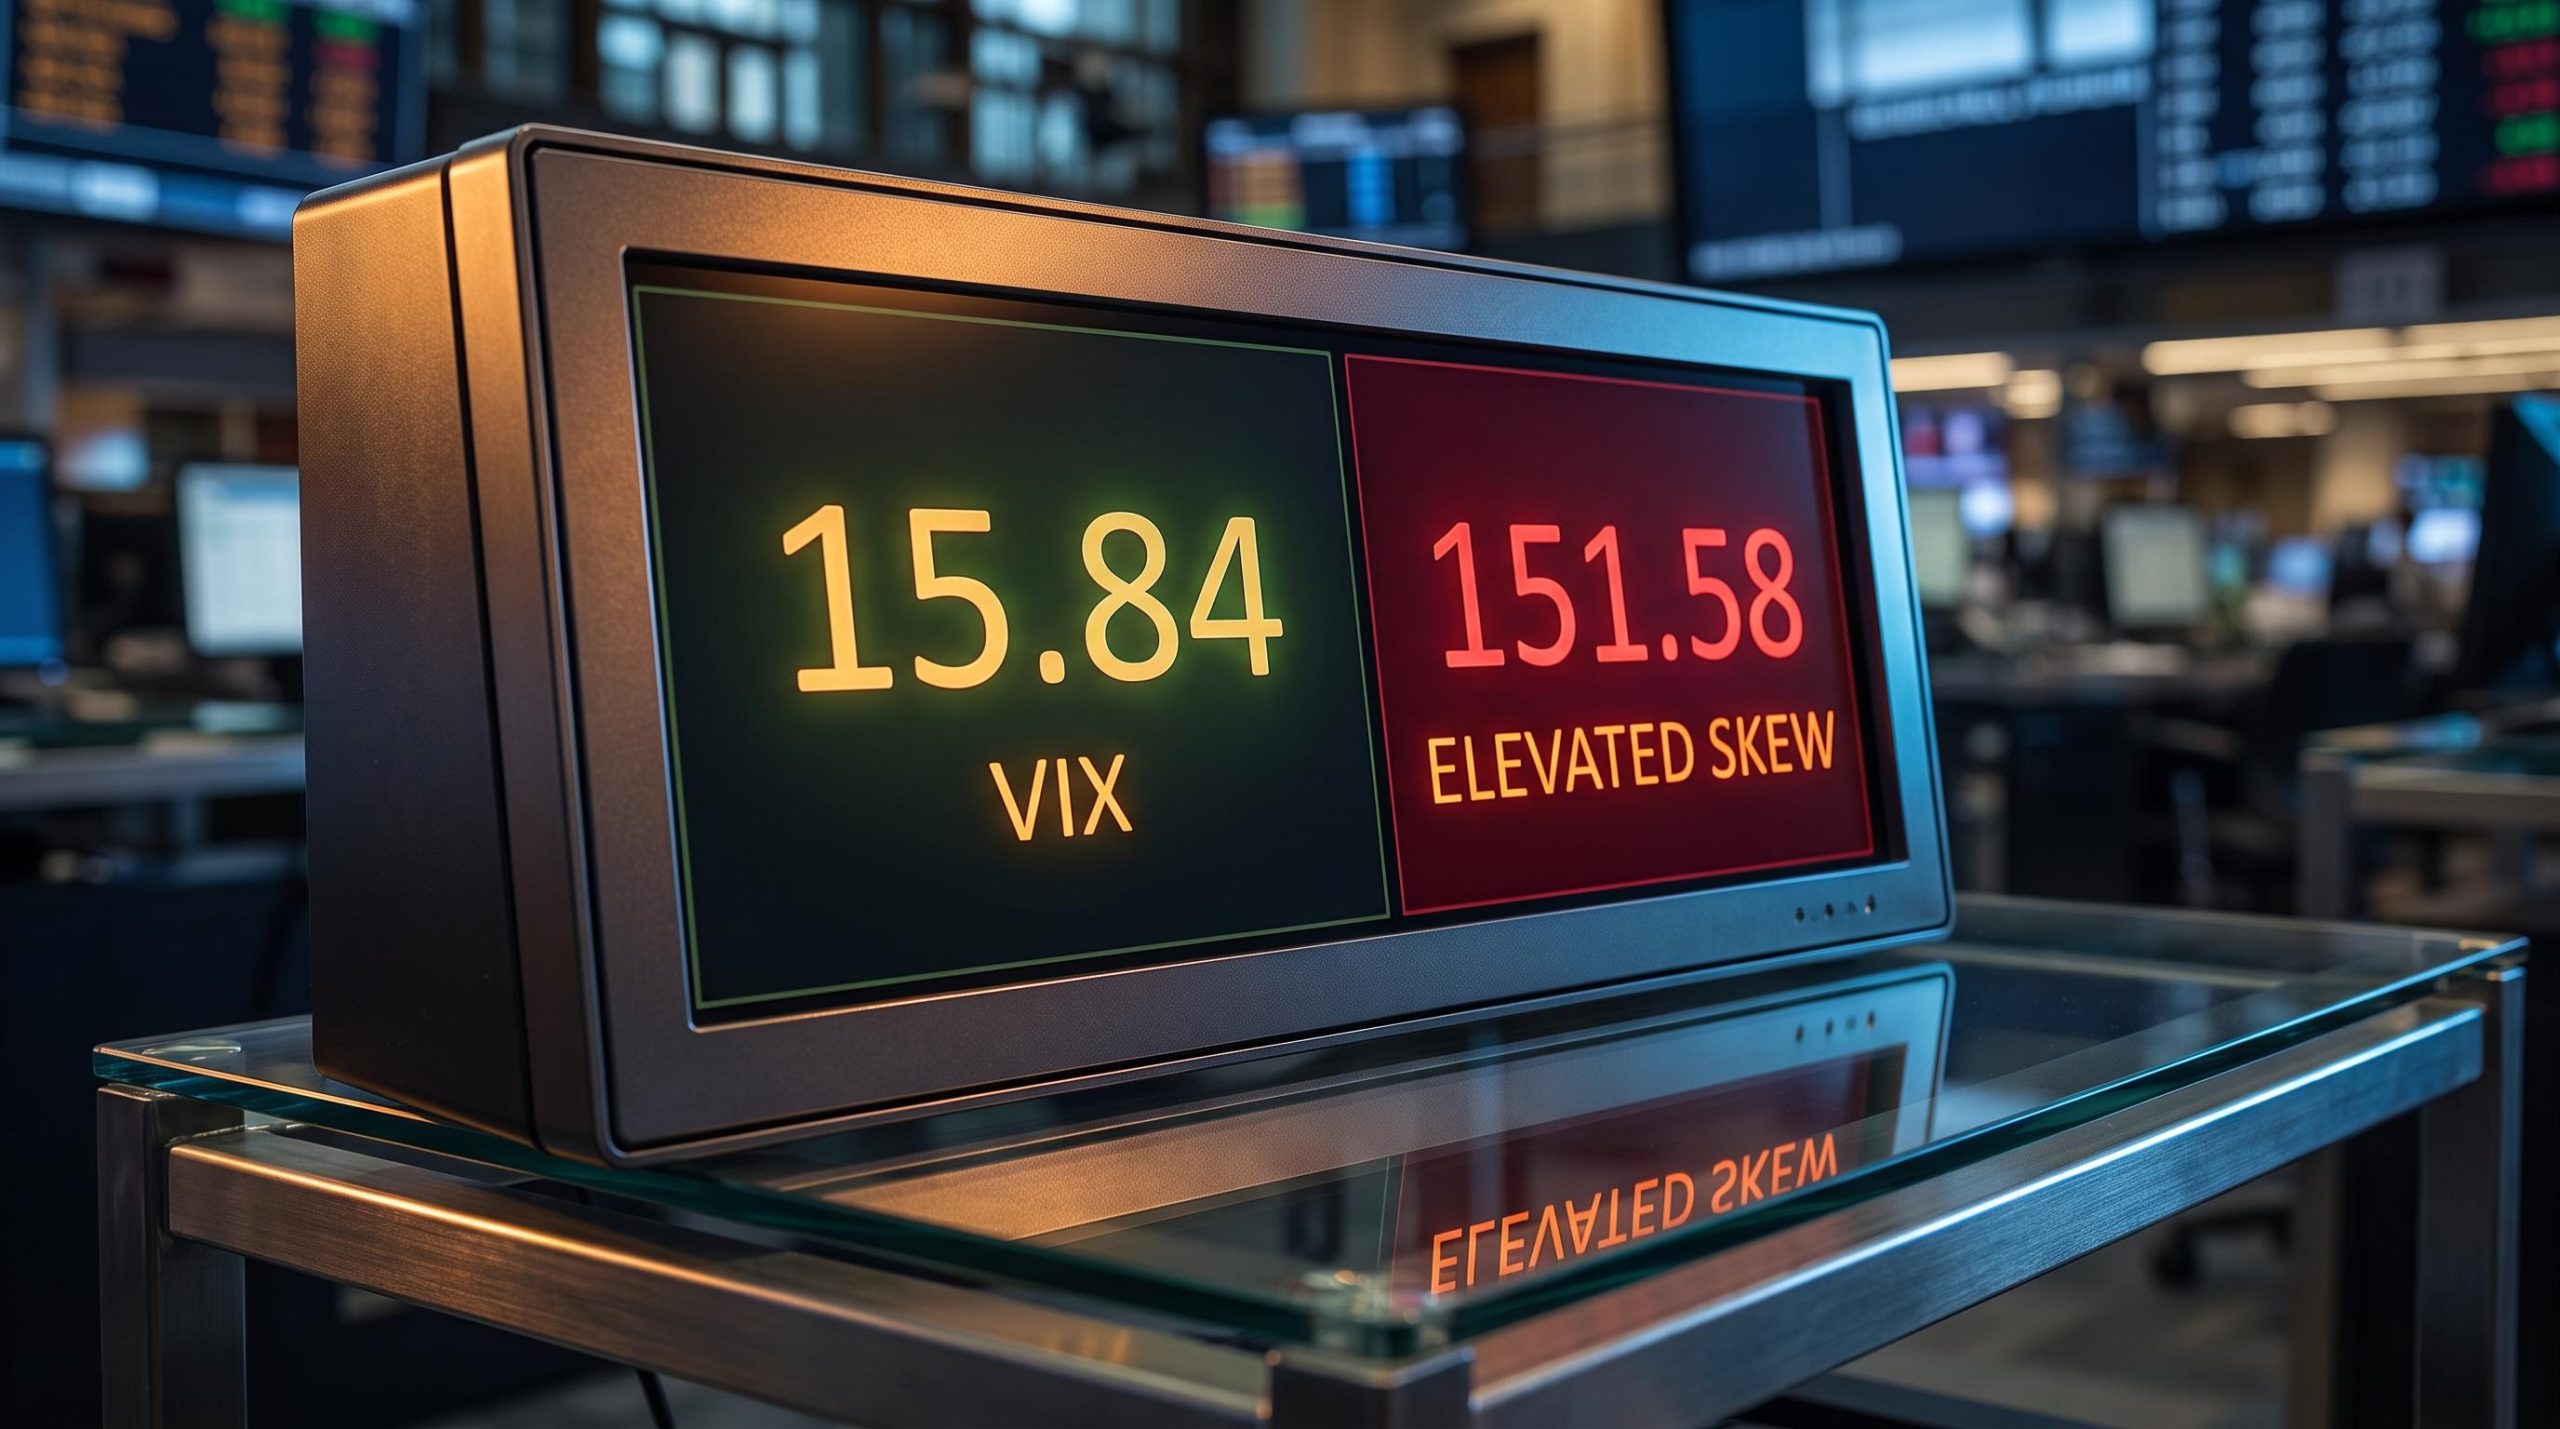
The VIX touched 13.80 earlier this year, at a moment when interest rates sit at levels the market has not seen in decades.
That juxtaposition is the puzzle worth sitting with. In ordinary conditions, a subdued volatility gauge signals a calm market and confident investors. But when the calm persists through a high-rate environment that should, by every historical logic, lift borrowing costs, squeeze margins, and rattle equity valuations, the calm itself starts to look like something other than reassurance.
This is an analysis of what the volatility signals are actually saying, rather than what the headline number appears to say. After reading it, you will know which metrics to trust, which to treat with scepticism, and which specific configurations should prompt you to raise your guard rather than lower it.
What the volatility dashboard is actually showing right now
Start with the number everyone quotes. The VIX closed at 15.84 on 11 September 2026, down sharply from 17.84 the prior session, according to Cboe Global Markets, YCharts, and MarketWatch. Earlier in 2026, it dipped to roughly 13.80 before rebounding. On its own, that reading tells a story of a market at ease.
The story gets more complicated the moment you look past the headline.
Consider the S&P 500’s implied volatility rank, which measures where current volatility sits relative to its own recent range. Derek Iswell, chief investment officer of Shelton Options Management, put the figure at approximately 27.7, placing realised volatility in the 27th percentile of the prior year. That is genuinely low, and it reinforces the calm reading.
Skew tells a different story. Skew measures how much more investors are paying for downside protection (out-of-the-money puts) versus upside bets. Saxo’s Options Brief recorded S&P 500 skew at 151.58 on 7 September and 148.86 on 9 September, labelling both readings explicitly “ELEVATED.” Investors are quietly paying up for crash insurance even as the VIX naps.
Skew sits on top of implied volatility basics: without a working understanding of how IV is extracted from live market prices rather than historical data, the gap between a calm VIX and elevated skew readings can look like a contradiction rather than two instruments measuring different things.
Saxo’s regime label: “LOW VOL BULL / ELEVATED SKEW”
That combination is the tension the rest of this analysis unpacks. Two further signals fill in the picture. Put-call ratios sit in neutral territory, with no extremes in either direction, per Iswell. And the VIX term structure is in contango, meaning longer-dated volatility futures cost more than near-term ones: on 9 September, front-month futures traded at 18.45 against a spot VIX of 15.72. Contango is the normal shape and does not, by itself, flag stress.
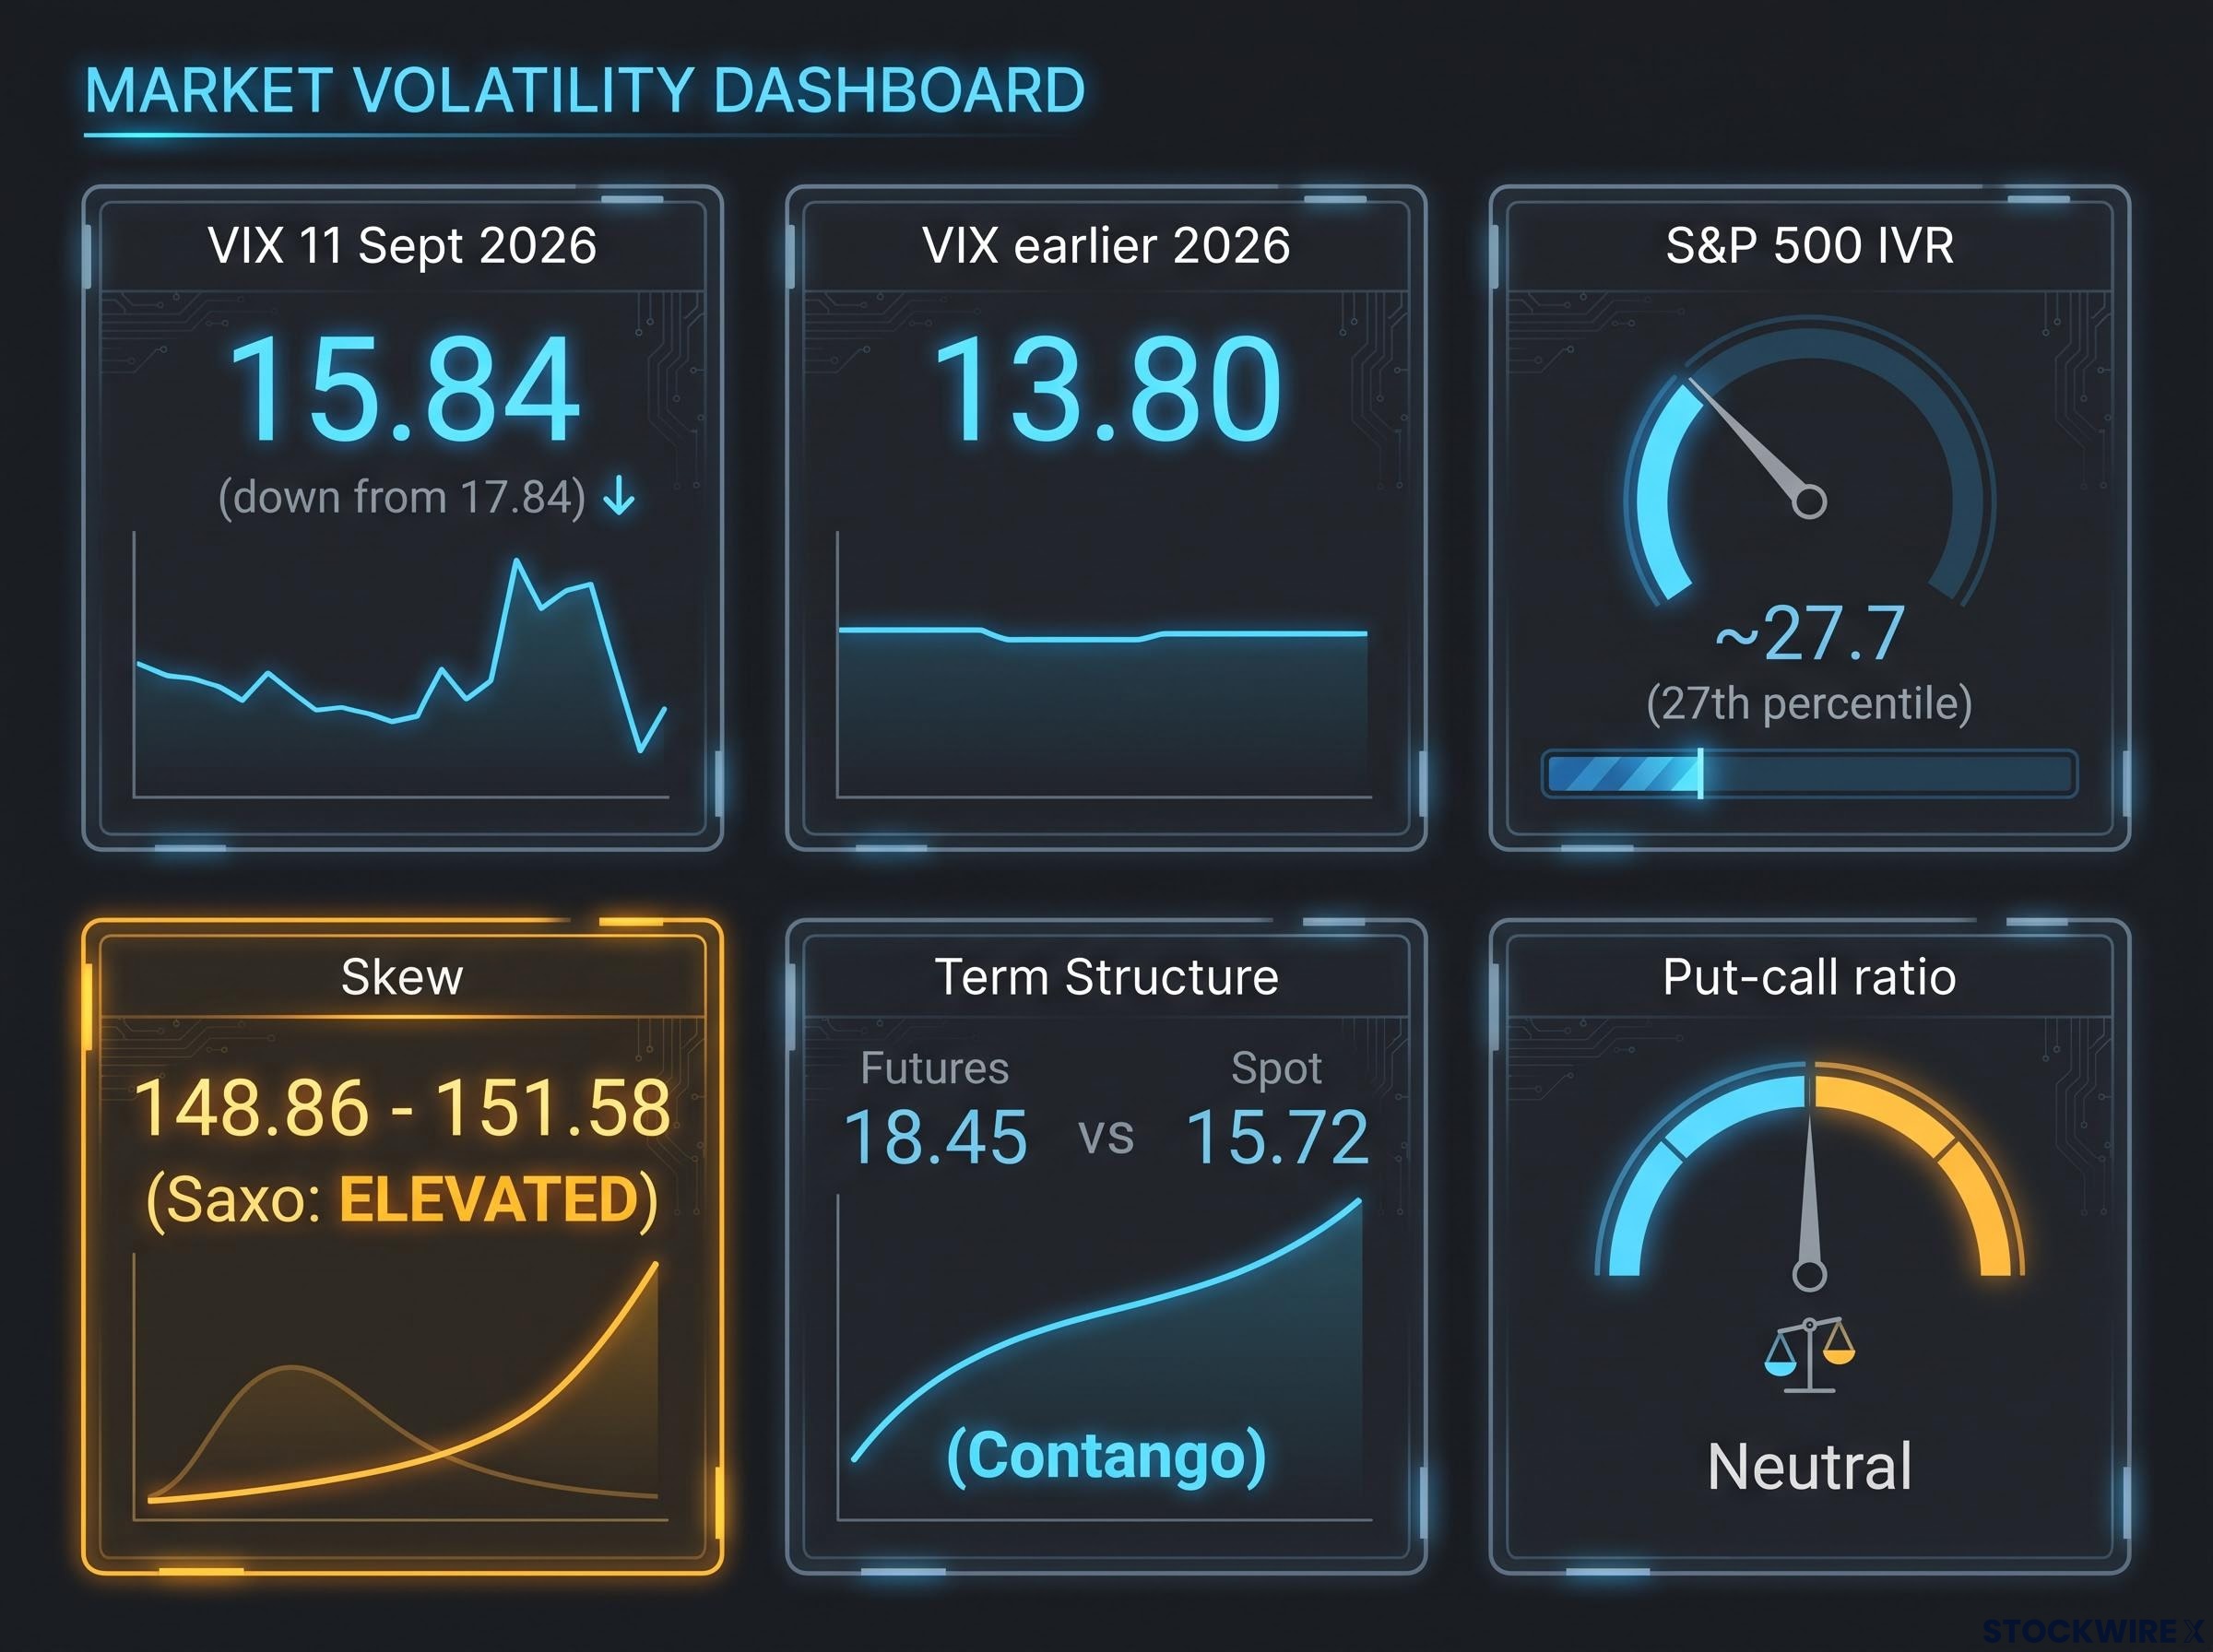
| Metric | Current Reading | Context | Signal |
|---|---|---|---|
| VIX spot | 15.84 (11 Sep 2026) | Below long-run median of ~17.6 | Calm |
| S&P 500 IVR | ~27.7 | 27th percentile of prior year | Low |
| Skew | 148.86-151.58 | Saxo labels “ELEVATED” | Latent concern |
| Term structure | Contango (18.45 vs 15.72) | Normal upward slope | No clear signal |
| Put-call ratio | Neutral | No extremes | Balanced |
The gap between a sleepy VIX and an elevated skew tells you something specific: sophisticated participants are paying for crash protection while keeping their equity exposure on. That is the signature of latent concern, not genuine calm. If you stop at the VIX headline, you are reading one instrument on a dashboard that has five.
When big ASX news breaks, our subscribers know first
Why high rates and low volatility can coexist, and why that is not necessarily comforting
The stability case deserves genuine weight before it is dismantled. It is not flimsy.
RoboMacro’s data classifies the current regime as “Very Low,” at the 15th percentile over 252 days with a z-score of -0.83. The MOVE index (which tracks Treasury volatility) and the VIX both sit near their 10-year averages, while corporate credit spreads are historically tight, according to CreditSights via CNBC. Credit markets, in other words, are not flashing warning lights.
Layer in resilient corporate earnings and the fact that high rates have been telegraphed for months, which compresses the “policy shock” component of volatility, and you have a coherent argument that this calm is earned. A market absorbing restrictive rates without funding stress is a functioning market.
But there is a structural layer beneath the macro story, and it operates independently of whether the economy is healthy. Several mechanisms mechanically suppress measured volatility:
- Persistent volatility selling by systematic strategies and target-volatility funds increases the supply of option premium and drags implied volatility lower.
- Corporate buybacks cushion drawdowns and dampen realised volatility, which feeds back into lower implied readings.
- Central bank forward guidance reduces policy uncertainty even at restrictive rate levels.
- Option overwriting by structured product issuers adds a steady stream of premium supply that pins volatility gauges down.
Systematic volatility selling by target-volatility funds and structured product issuers is not a passive backdrop: with roughly $1.5 trillion in short-volatility exposure outstanding, the same mechanism suppressing the VIX today carries a feedback loop that can force simultaneous unwinding precisely when the market needs liquidity most.
When structural calm diverges from underlying risk
Here is the distinction that matters. These mechanisms suppress the volatility you can measure without reducing the economic risk you actually carry. The gauge and the reality can drift apart, and when the drift is technical rather than fundamental, it can reverse with no warning.
Iswell sharpened this point directly. He described the near-absence of protective options buying as inconsistent with the prevailing macroeconomic environment, specifically the return of interest rates to decades-long highs. When rates are this restrictive and investors still are not buying insurance, that is a disconnect worth taking seriously, not dismissing.
For anyone holding equities, the read is uncomfortable but clear: low implied volatility produced by structural selling rather than genuine macro calm means portfolio insurance is cheap precisely when the risks it covers may not have gone anywhere. Cheap hedges and quiet gauges are not the same thing as reduced danger.
The mega-cap effect: what index concentration is doing to the VIX you see
There is a structural reason to distrust the VIX as a whole-market signal, and it has nothing to do with sentiment. It has to do with arithmetic.
The VIX is derived from options on the S&P 500, which is capitalisation-weighted. That means a small number of enormous, liquid, relatively stable companies contribute a disproportionate share of index variance. The gauge is priced off expectations for index-level movement, not the average movement of the 500 underlying stocks.
How concentrated? Iswell estimates that passive investors in S&P 500 products effectively hold 7 to 10 stocks accounting for a dominant share of portfolio weight. A handful of mega-caps, in practice, set the tone for what the headline volatility gauge reads.
Index concentration risk extends well beyond how the VIX is calculated: five companies now control roughly 30% of total U.S. equity market capitalisation, a level Goldman Sachs and Morgan Stanley describe as extreme, which means a shock to any one of those names carries index-level implications that a diversified historical volatility reading would not anticipate.
That matters more now because the market’s leadership has been shifting. Small- and mid-cap stocks have shown better relative performance as the rally has broadened, with the so-called MAG7 mega-caps underperforming in the first half of 2026, per Iswell. The concentration that suppressed the VIX for years is loosening at the edges.
Which opens a genuinely counter-intuitive scenario.
Major indices could post flat or negative returns while the average individual stock and smaller-cap indices remain positive, an inversion of the usual assumption that index performance reflects the health of the broad market.
Read that again, because it upends a default assumption. Index return is normally treated as shorthand for market health. When weight is this concentrated, the two can point in opposite directions.
Saxo’s elevated skew readings (149-152) reinforce the point: even index-level options participants are hedging tail risk the VIX does not fully capture. And RoboMacro’s breadth data shows 0% of assets above their one-year median volatility, consistent with a calm that is concentrated rather than universal.
Relying on the VIX alone is like watching the six largest rocks in a river. They tell you about the rocks you can see, not the ones moving downstream. To see the rest, consult these alongside it:
- The percentage of stocks trading above their 200-day moving average.
- Cross-sectional dispersion, or how differently individual stocks are moving.
- Sector-level volatility rather than index-level.
- Single-stock implied volatility in smaller constituents.
If you benchmark against or hold heavy weight in S&P 500 index products, this is a structural reframe with real consequences. The headline gauge reflects mega-cap stability, not whole-market health.
When this regime has broken before, and what broke it
History does the argument here, because this configuration has appeared twice before and both times it ended the same way.
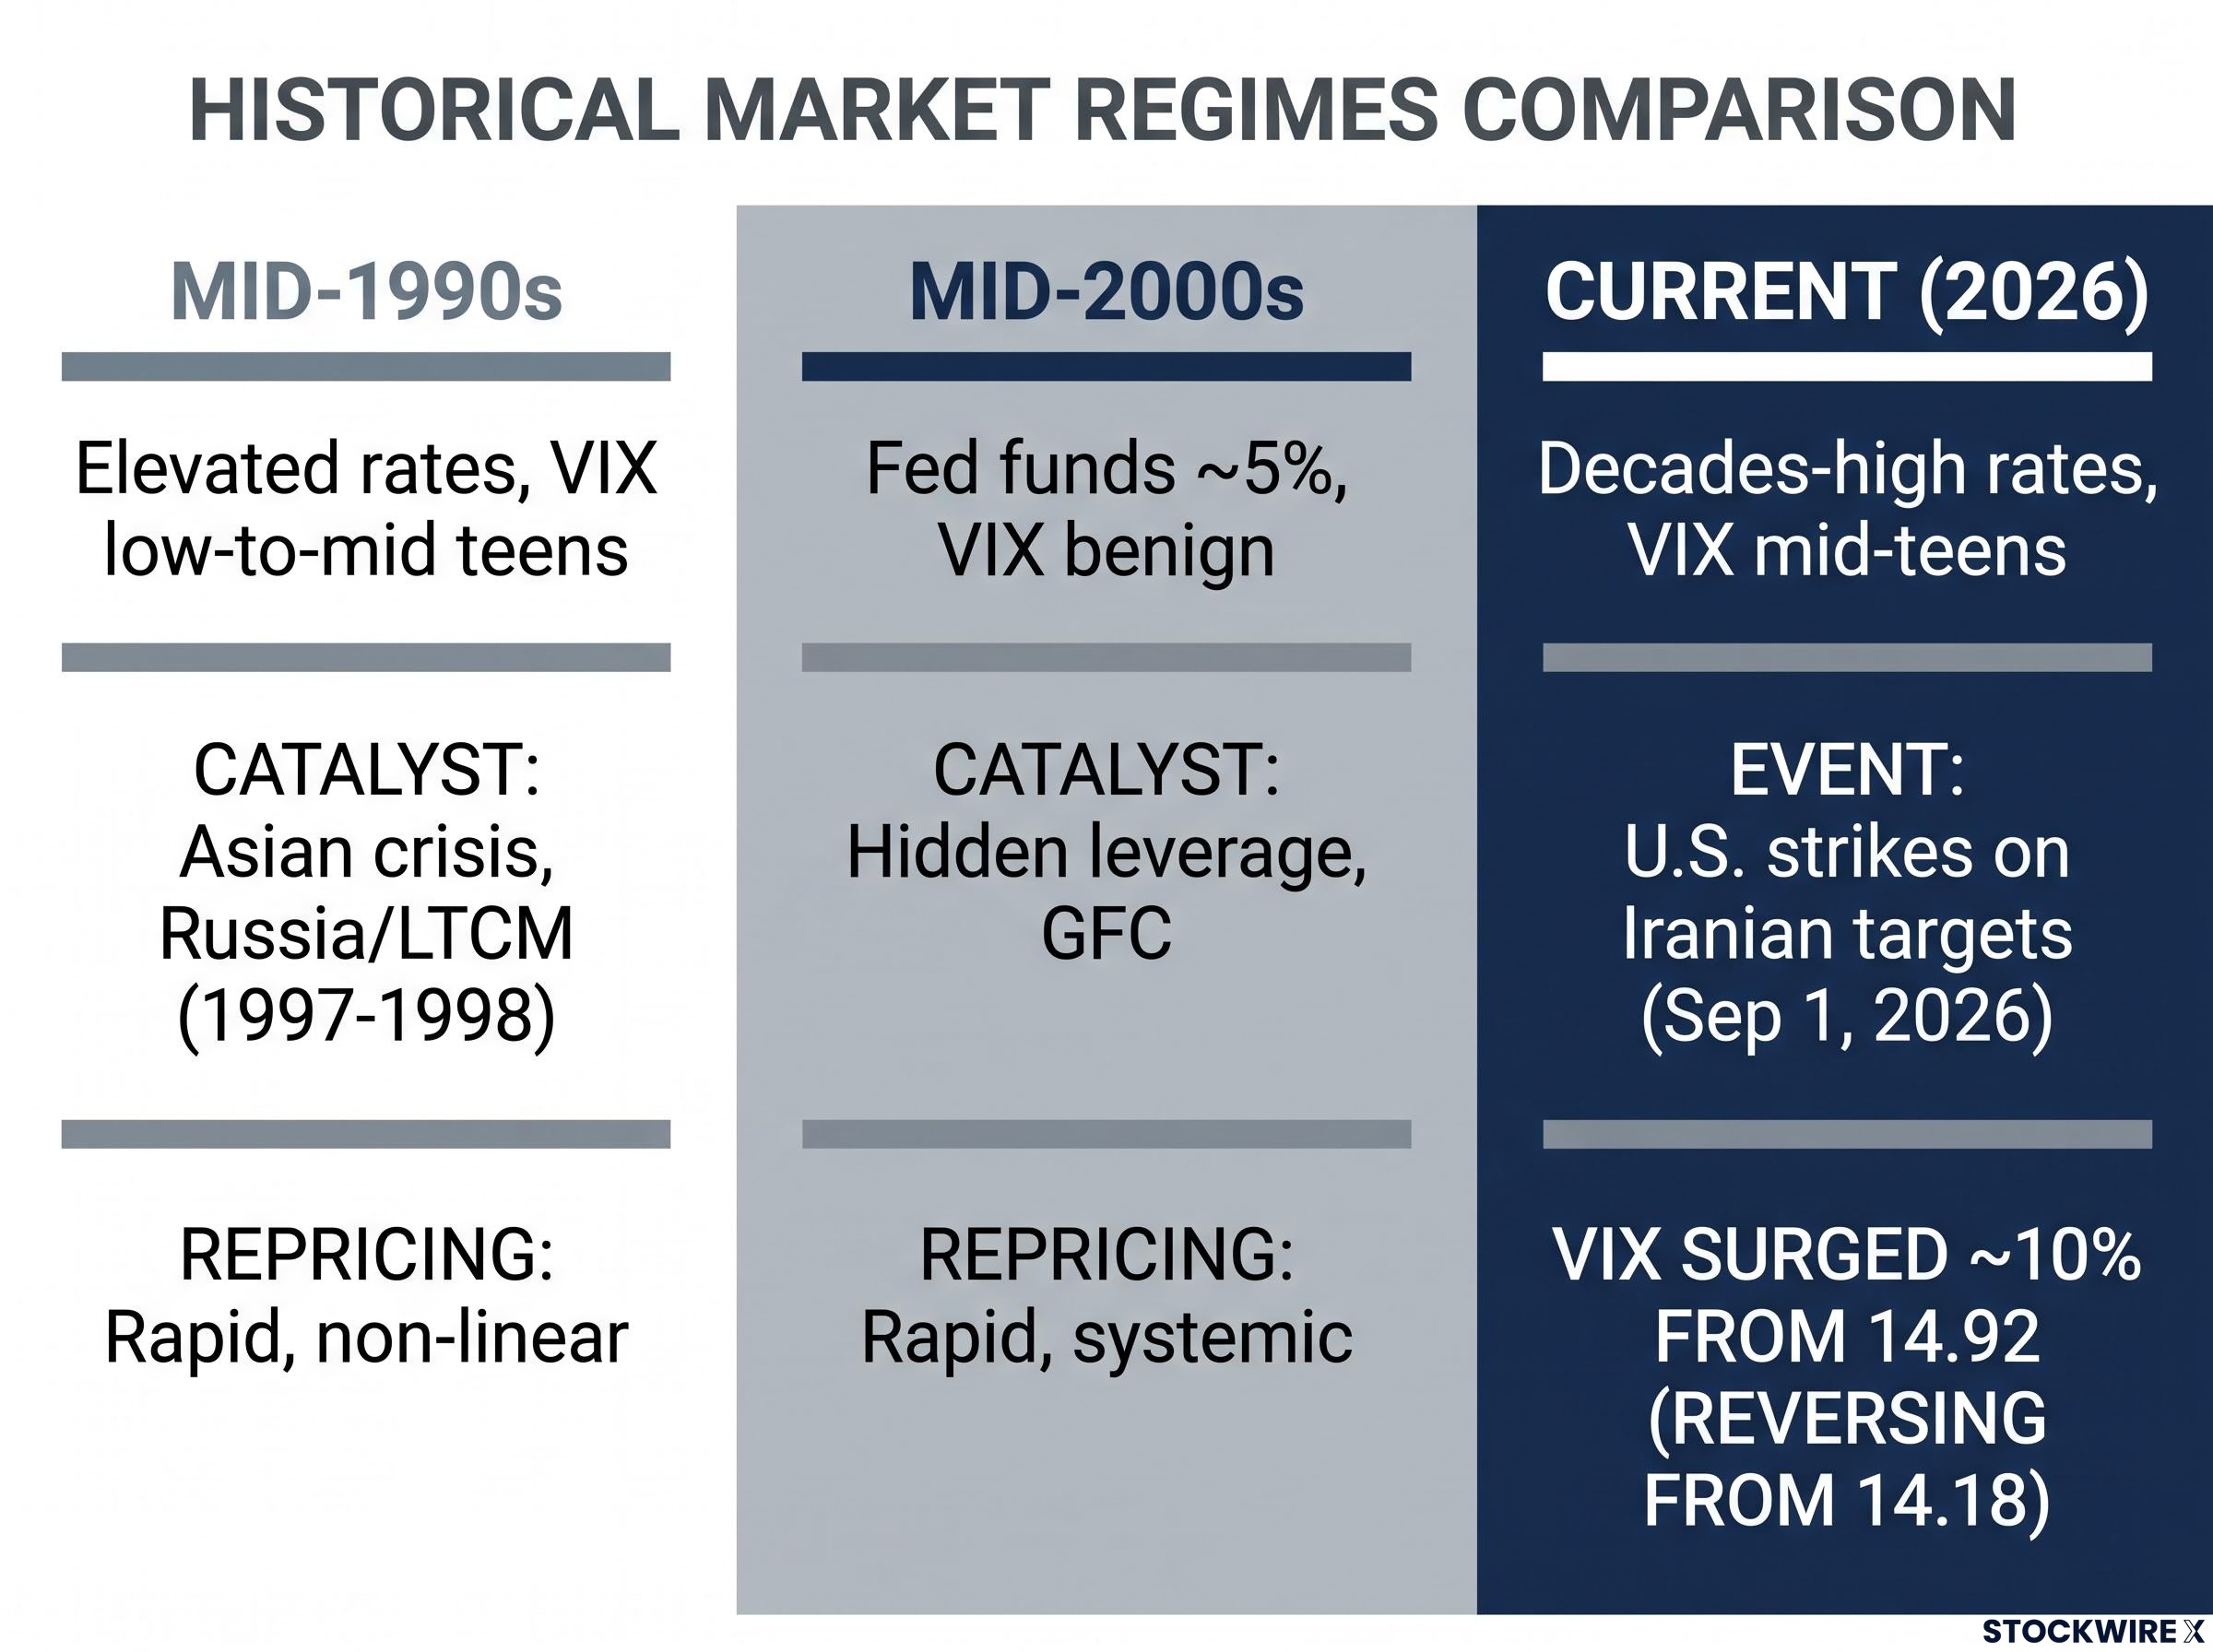
The mid-1990s came first. Policy rates were elevated by post-financial-crisis standards, yet the VIX traded in the low-to-mid teens, anchored by stable growth, easing inflation, and credible Federal Reserve communication. The regime held until it did not. The Asian financial crisis and then the Russian default and Long-Term Capital Management collapse in 1997-1998 arrived as external shocks, raised cross-asset correlations abruptly, forced de-leveraging, and repriced volatility sharply higher.
The mid-2000s rhymed. The Fed funds rate sat around 5%, the VIX stayed benign, and markets read strong earnings and financial innovation as justification for low volatility. That regime did not end from a visible shock. It ended when hidden leverage and credit complexity turned a contained housing downturn into the Global Financial Crisis.
The pattern across both is the same: the regime was durable right up until a catalyst changed correlations or exposed hidden leverage, and then the shift from low volatility to high volatility was rapid and non-linear.
VIX seasonality patterns add a third dimension to the historical comparison: three independent datasets spanning 27-34 years converge on September as the month with the single largest average monthly VIX increase at +6.29%, a recurring tendency that has historically resolved the kind of low-volatility, elevated-skew configuration this analysis describes.
| Episode | Rate Environment | VIX Level | What Broke It | Repricing Speed |
|---|---|---|---|---|
| Mid-1990s | Elevated by post-GFC norms | Low-to-mid teens | Asian crisis, Russia/LTCM (1997-98) | Rapid, non-linear |
| Mid-2000s | Fed funds ~5% | Benign | Hidden leverage, GFC | Rapid, systemic |
| Current (2026) | Decades-high rates | Mid-teens | Live risk (see Iran episode) | Single-session (Sep 1) |
That last row is not theoretical. On 1 September 2026, following U.S. military strikes on Iranian targets, the VIX surged roughly 10% from a prior close of 14.92, reversing from a year-low near 14.18 set only about two weeks earlier.
That is the whole lesson in one session. The repricing from cheap insurance to expensive insurance happened before markets could adjust, and any investor under-hedged at that moment had no window to react. The catalyst was unpredictable; the fragility was not.
The task is not to forecast the next catalyst. It is to watch the configurations that historically precede a break:
- Sudden steepening of the VIX term structure at the front end.
- Rapid widening of credit spreads.
- Persistent divergence between elevated skew and a subdued VIX.
- Deteriorating market breadth alongside continued mega-cap stability.
Reading volatility signals without falling into the complacency trap
The core principle is simple to state and easy to ignore: no single volatility metric tells the full story. The quality of any reading depends entirely on what you check alongside it.
Treat the signals as one system rather than a menu. Here is that system in priority order:
- VIX spot and its percentile, to establish the baseline level of implied volatility.
- IVR, to see where realised volatility sits within its own recent range.
- Skew level and direction, to detect demand for downside protection the VIX misses.
- VIX term structure shape, to spot a near-term shock premium building at the front end.
- Credit spreads and market breadth, to check whether the calm is broad or concentrated.
Saxo’s “LOW VOL BULL / ELEVATED SKEW” label is this framework in practice: two signals read together tell a fuller story than either alone. RoboMacro’s cross-asset regime classification (Very Low, 15th percentile, z-score -0.83) does the same job from the breadth side.
The complacency trap is not that volatility is low. Low volatility is a fine present-state description. The trap is treating that reading as a guarantee of safety rather than a snapshot of price with a fragility profile attached.
The asymmetric cost of getting complacency wrong in a high-rate regime
The asymmetry is the point Iswell keeps returning to, and it deserves the last word. In a high-rate environment, the cost of being wrong about complacency is structurally higher. There is less monetary policy cushion to soften a shock, refinancing conditions are tighter, and the market has already absorbed multiple shocks without a circuit-breaker. A rapid, non-linear repricing hits harder when there is nothing underneath to catch it, which makes maintaining hedges through a quiet market the cheaper mistake by far.
The habit change is concrete: check skew and IVR before you conclude the market is calm, because calm describes price, not risk.
This article is for informational purposes only and should not be considered financial advice. Investors should conduct their own research and consult with financial professionals before making investment decisions. Past performance does not guarantee future results.
The signals worth watching as the rate plateau holds
None of this makes the current environment obviously dangerous or obviously safe. It is a low-volatility regime with identifiable fragility points, and an informed investor can monitor those points without pretending to predict the catalyst. That is the whole practical shift this analysis exists to produce: from watching one number to watching a handful of specific relationships.
Three variables matter most as the rate plateau holds:
- Whether skew and credit spreads keep diverging from the VIX headline (currently skew at 149-152 per Saxo) or begin to converge, which would tell you tail-risk demand is either persisting or easing.
- Whether the broadening of breadth beyond mega-cap tech holds under macro pressure or reverses back into concentration, which would shift index-level volatility conditions materially.
- Whether the VIX term structure steepens suddenly at the front end (currently contango, with spot at 15.72 versus front-month futures at 18.45 on 9 September), which would signal a near-term shock premium being priced in.
Staying informed about what these signals are actually saying, versus what the headline number appears to say, is not optional in a high-rate regime with structural suppression mechanisms in play. The investor watching three specific variables rather than one has already moved from passive observation to active signal reading. In this environment, that is the difference that counts.