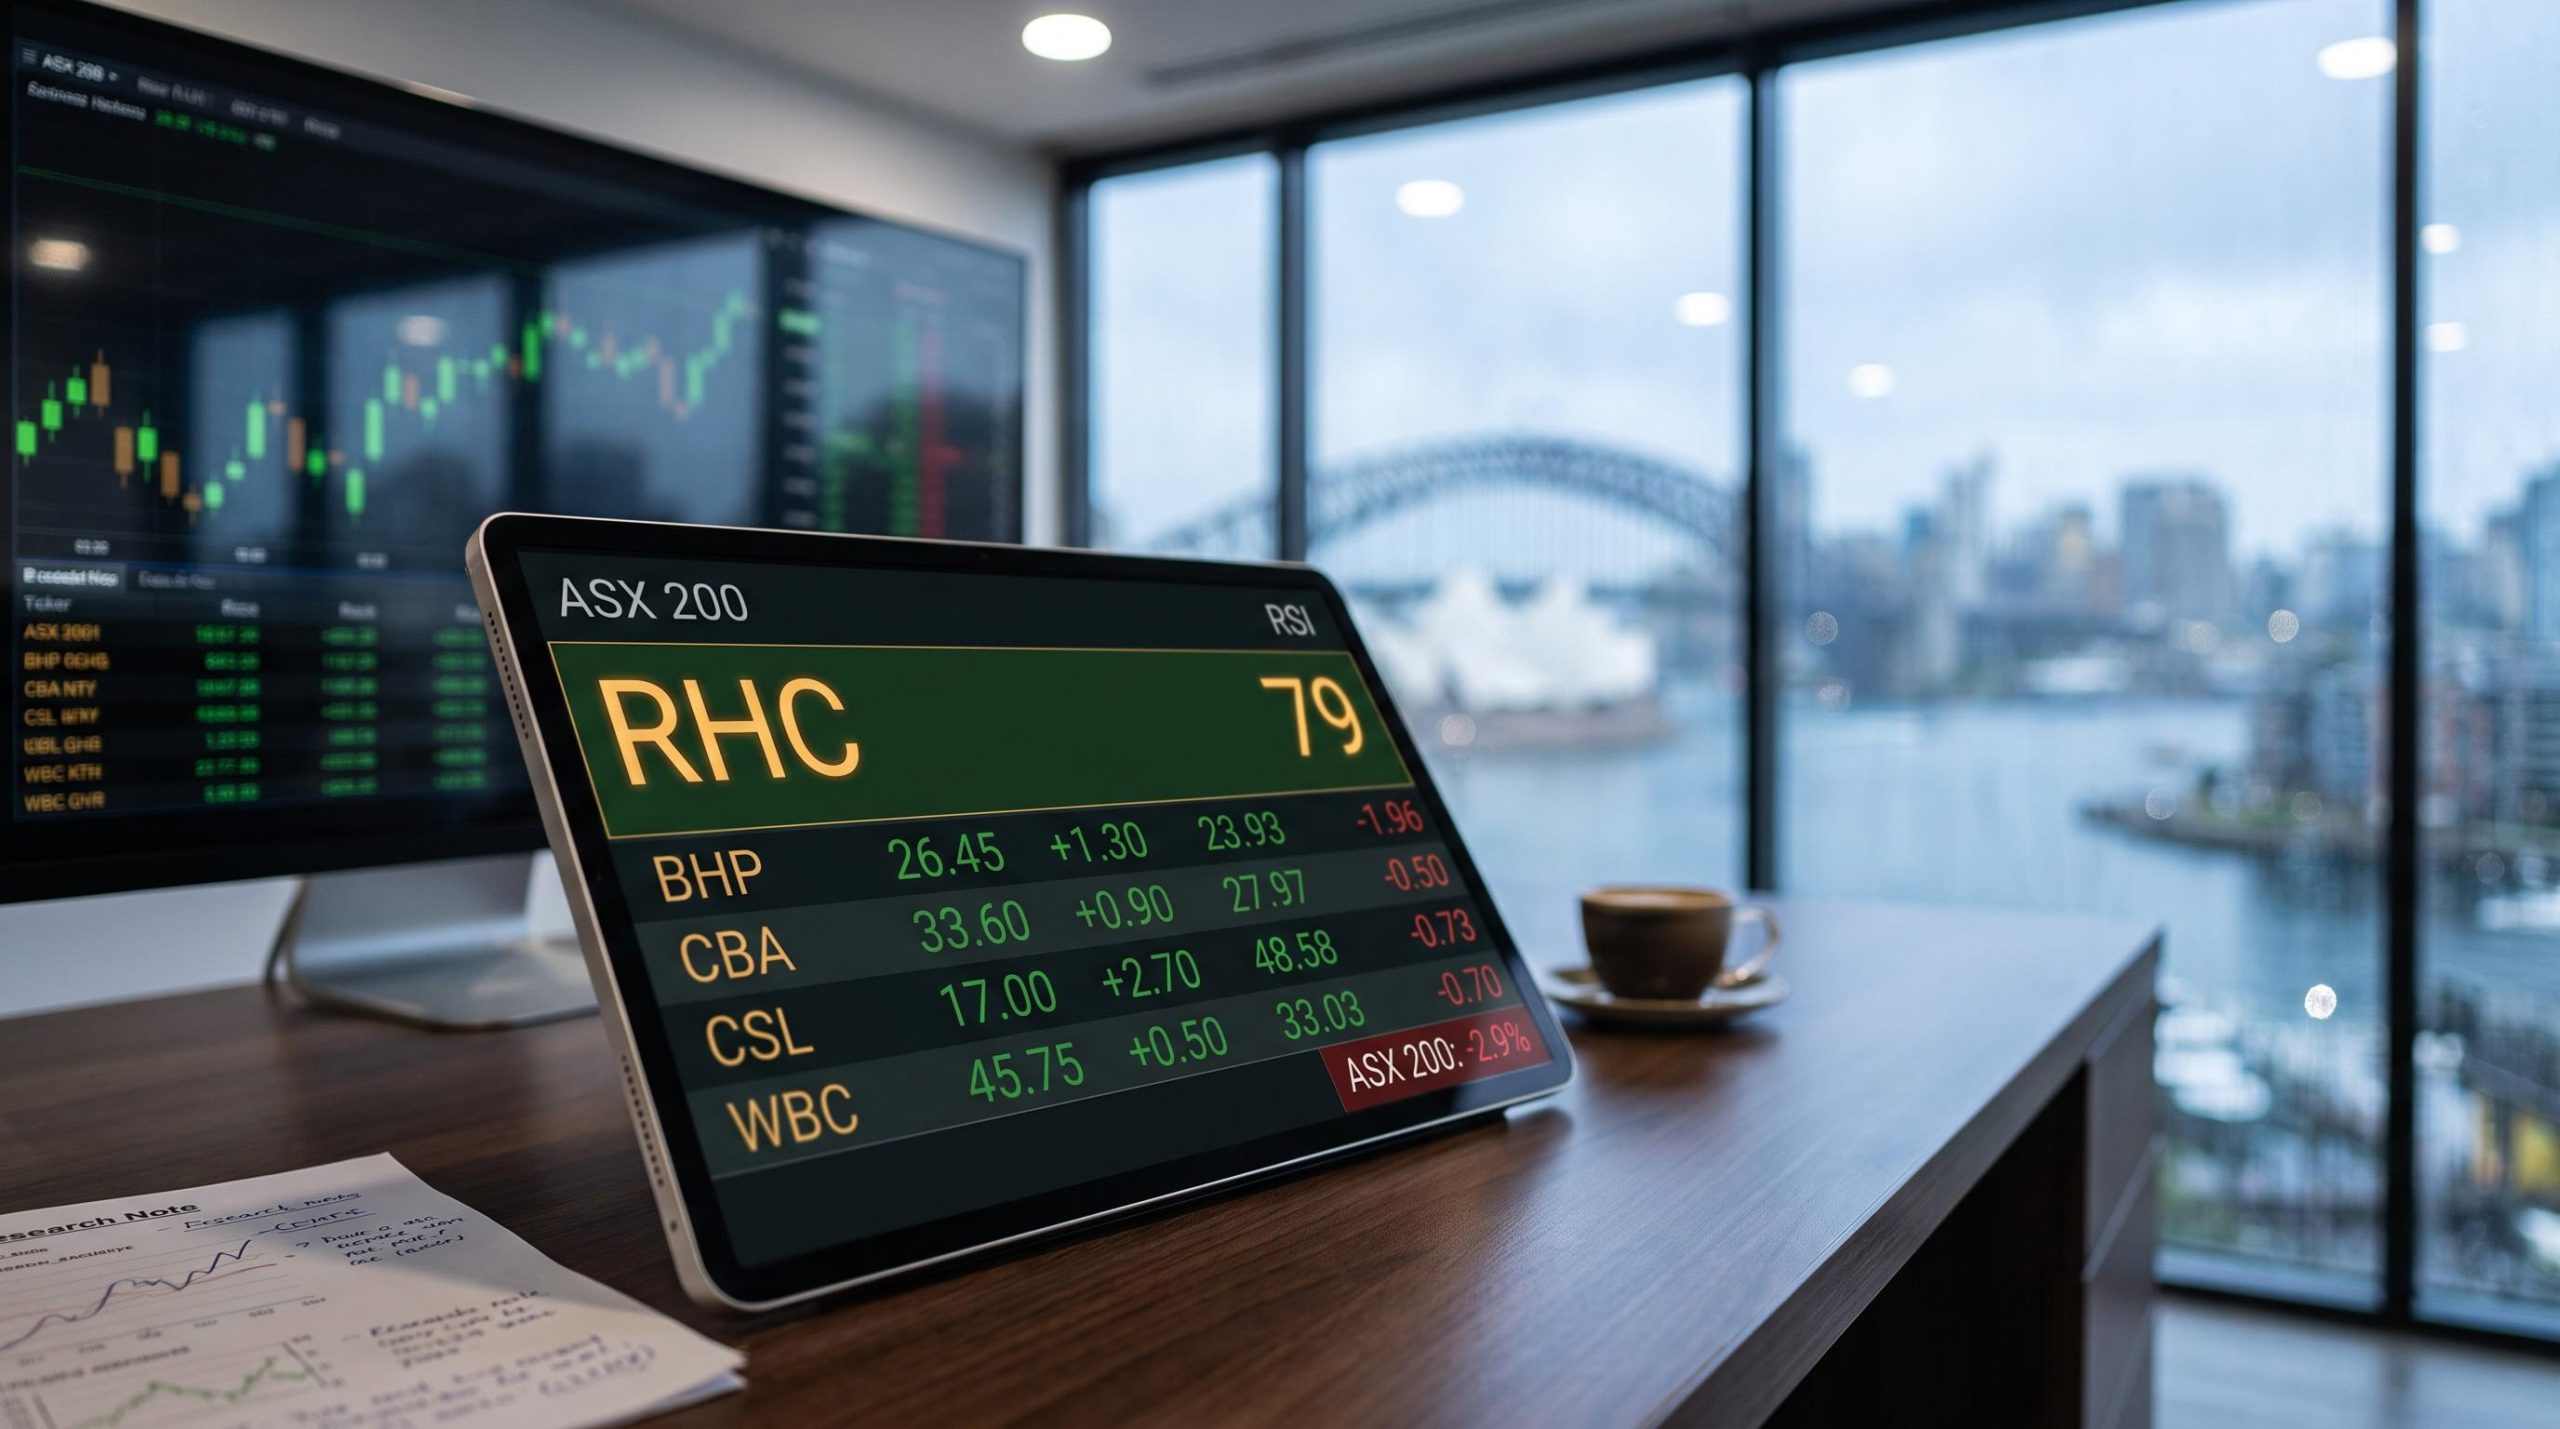
The ASX 200 lost close to 2.9% last week, yet a small cluster of stocks refused to follow the index down. Some did more than hold their ground; they pushed further into overbought territory. Sitting at the top for a third consecutive week was Ramsay Health Care, carrying an RSI of 79.
When the broad market falls and a handful of specific names climb, an overbought reading stops being a routine technical footnote. It starts carrying information about where capital is deliberately rotating, and that changes how you should read it.
This piece does three things with that data. It shows what is actually driving the current overbought names, it audits how last week’s overbought list performed once the following week played out, and it draws out what that track record tells you about acting on an RSI signal in a falling market rather than a rising one.
Which ASX 200 stocks are most overbought right now
The Week 38 rankings, current as at Friday 11 September 2026, read less like a random scatter of momentum plays and more like two distinct stories sitting side by side. Healthcare persistence at the top. An energy surge filling out the middle.
| Stock (Ticker) | RSI | Weekly Return | 1-Month Return | Close (11 Sep 2026) |
|---|---|---|---|---|
| Ramsay Health Care (RHC) | 79 | +2.4% | +19.3% | $53.55 |
| New Hope (NHC) | 72 | +3.8% | +17.9% | $6.33 |
| Santos (STO) | 69 | +4.6% | +6.8% | $8.59 |
| Ansell (ANN) | 67 | -2.2% | +18.0% | $41.34 |
| Viva Energy Group (VEA) | 66 | +4.8% | +11.4% | $3.04 |
| APA Group (APA) | 65 | +0.1% | +8.3% | $10.92 |
| AMP (AMP) | 64 | -0.8% | +5.6% | $2.46 |
| Reliance Worldwide (RWC) | 64 | +2.6% | +16.0% | $4.28 |
| Steadfast Group (SDF) | 62 | +0.4% | +8.4% | $5.71 |
| Graincorp (GNC) | 61 | -3.8% | +20.6% | $6.55 |
What overbought means here An RSI reading at or above 70 signals an overbought condition, suggesting price appreciation may be excessive relative to recent momentum.
Only two names, Ramsay at 79 and New Hope at 72, actually cross that threshold. Everything below sits between 61 and 69, approaching the line rather than sitting on it. That in itself is worth noting: momentum is building through the list, not concentrated at a single extreme.
The clustering of Santos (+4.6%), Viva Energy (+4.8%) and New Hope (+3.8%) with big weekly gains in a week the index fell 2.9% is not noise. It is a deliberate sector rotation, and recognising that matters before you draw any conclusion from an individual RSI figure.
ASX sector rotation of the kind visible this week, where energy names surged more than 4% while the index fell close to 3%, tends to reflect institutional portfolio rebalancing rather than retail momentum, and that distinction matters because the flows driving Santos, Viva Energy, and New Hope are not the same flows that might chase a technical breakout.
Two patterns inside this week’s list
The first cluster is post-earnings momentum: Ramsay, Ansell, Reliance Worldwide and AMP, all names that ran hard through the recent reporting season and have kept their elevated readings since.
The second is commodity-driven energy: New Hope on coal, Santos on oil and gas, Viva Energy as a refiner, and APA Group on gas infrastructure.
One nuance on APA. Its inclusion reflects exposure to gas transmission infrastructure rather than direct commodity production, so grouping it uncritically with upstream producers like Santos misreads what is actually supporting the price.
When big ASX news breaks, our subscribers know first
Why Ramsay Health Care has held the top position for three straight weeks
Ramsay’s spot at the top of these rankings is not arbitrary technical drift. It traces directly to an FY26 earnings result on 27 August 2026 that beat analyst expectations across the metrics that matter most to the market.
The numbers investors received landed comfortably ahead of what they had priced in:
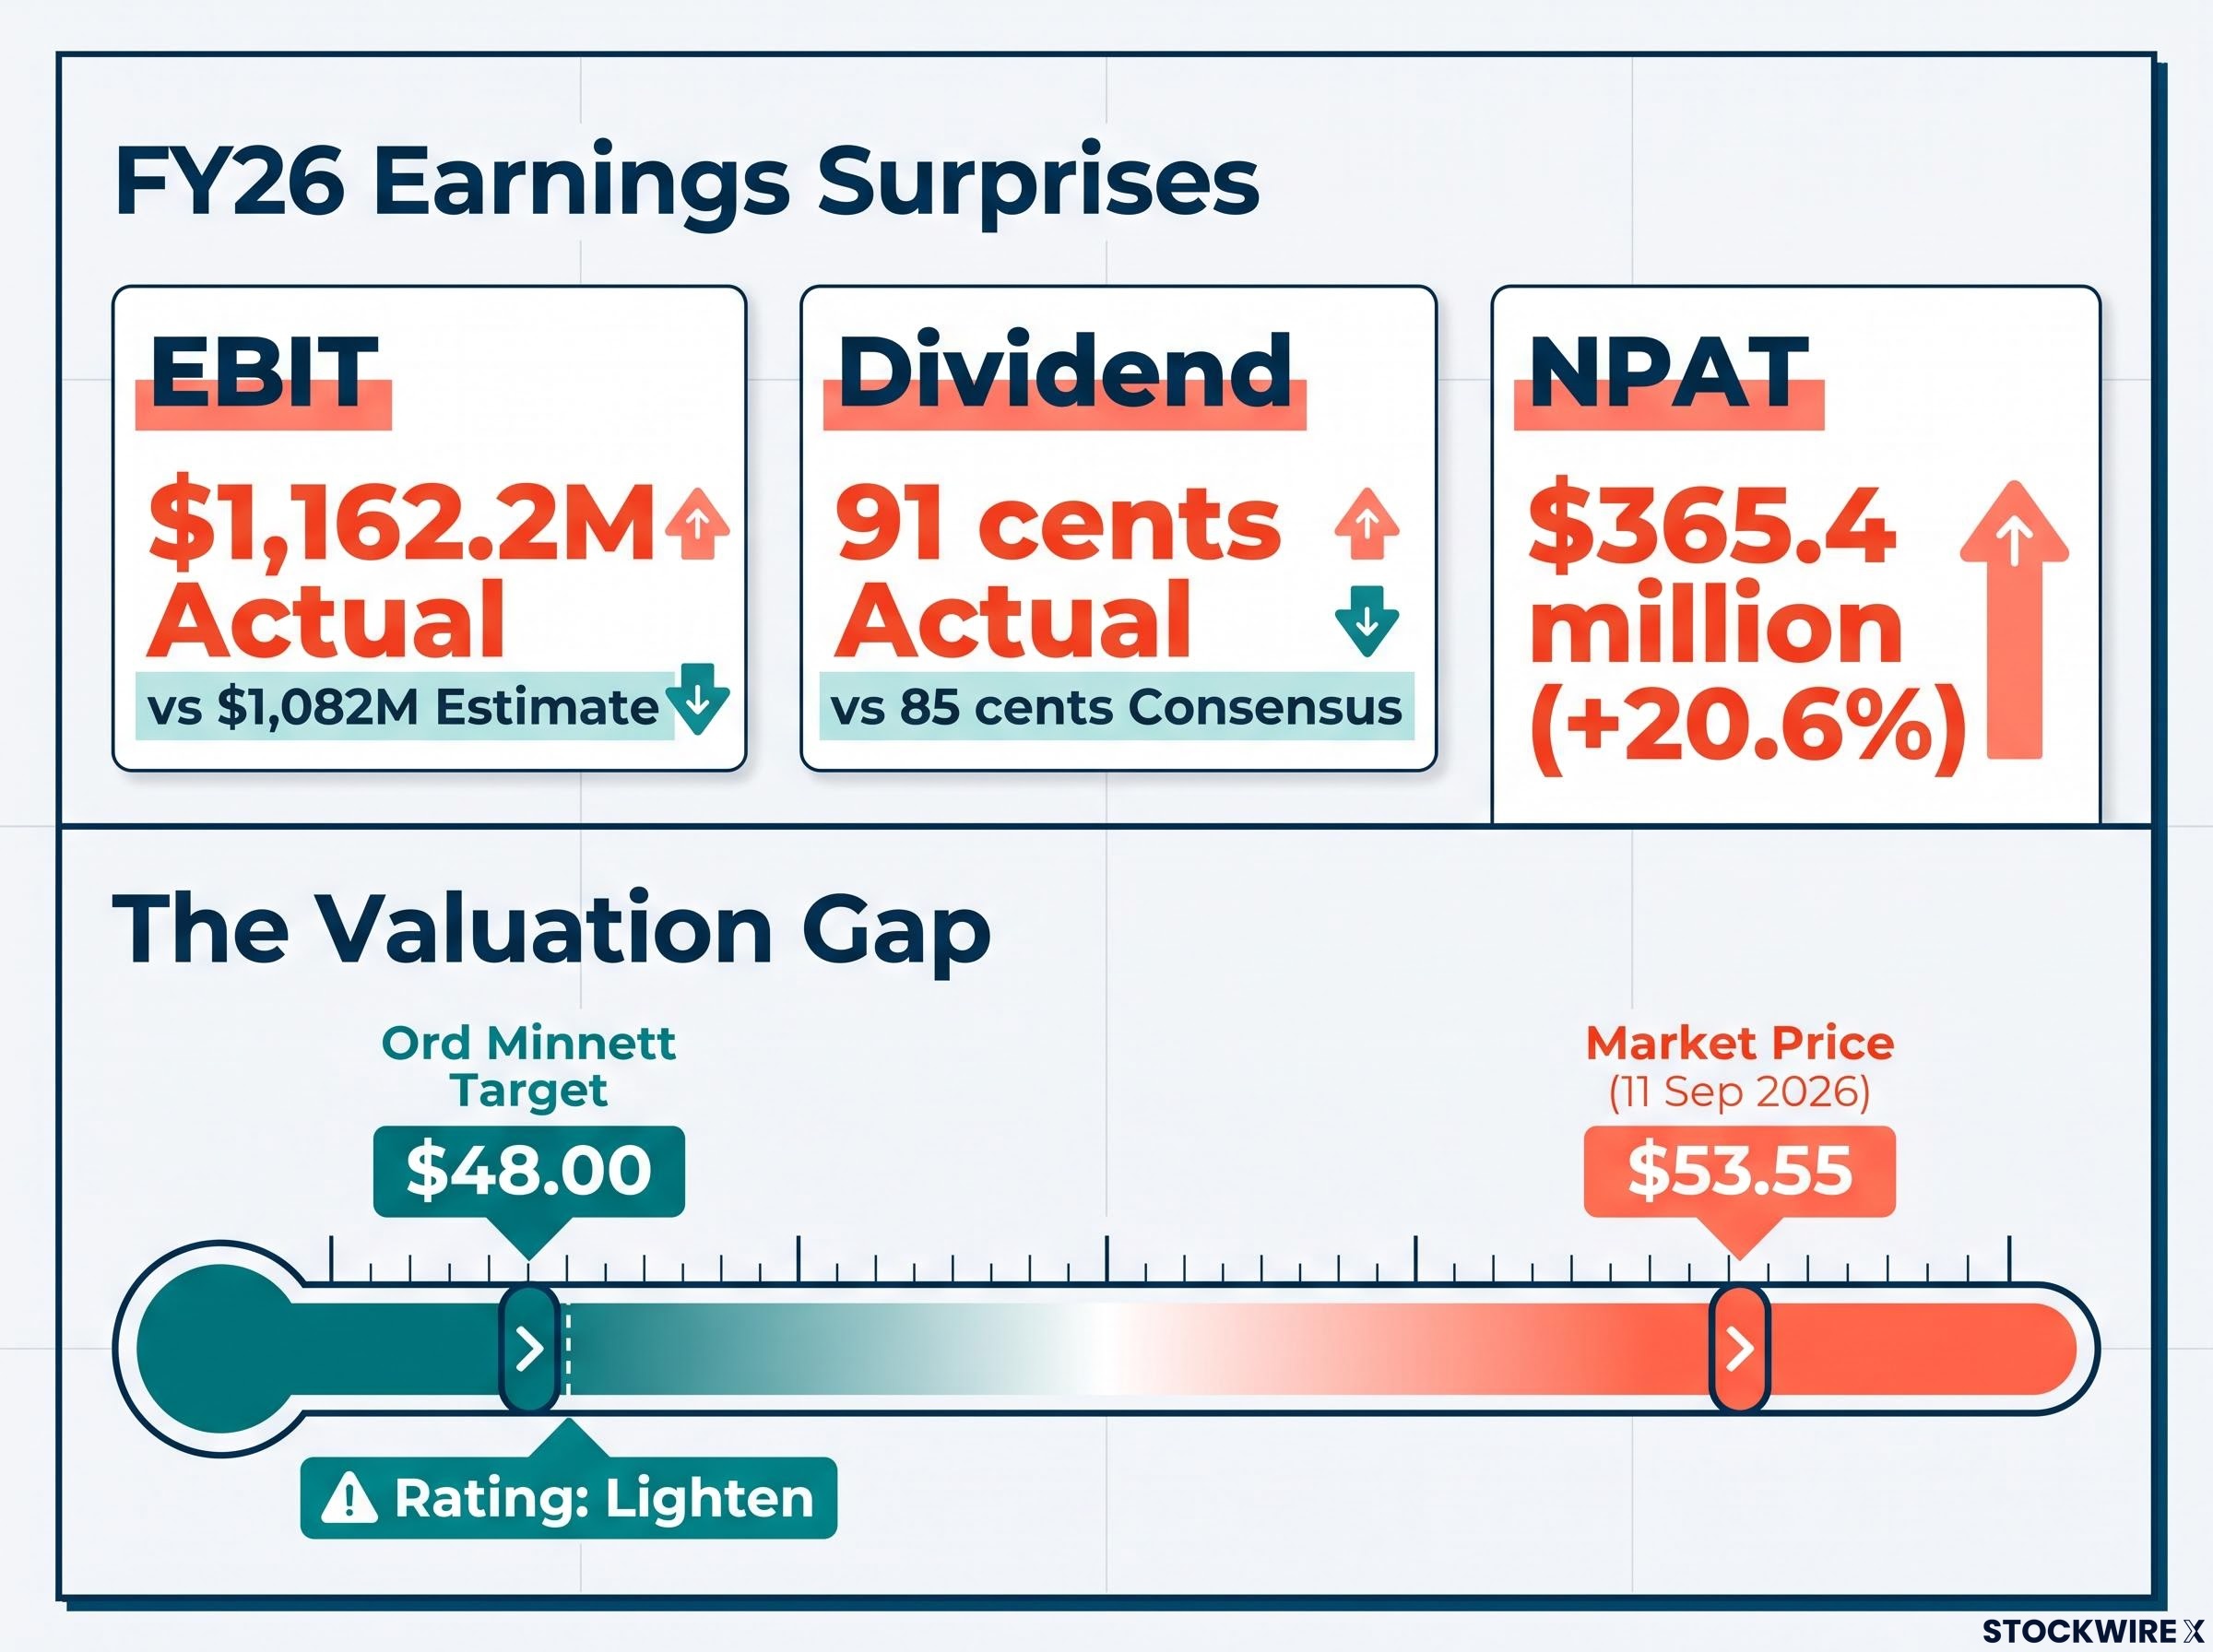
- Group underlying EBIT rose 11.5% to $1,162.2 million, against analyst estimates near $1,082 million, a beat of roughly 7%.
- Underlying net profit after tax climbed 20.6% to $365.4 million.
- The full-year dividend was lifted 13.8% to 91 cents per share, versus consensus of 85 cents.
- Ord Minnett estimated the normalised Australian EBIT margin improved 35 basis points to 9.6%, with a 60-basis-point lift in the second half.
The share price responded immediately, though the two sources tracking that day diverge slightly: Dow Jones Newswires reported a jump of around 13%, while Investing.com put it at 15.54%. Either way, the move was decisive, and it did not stop there.
Post-earnings price moves are never simply a function of how strong the reported numbers are; they reflect the gap between results and the expectations already embedded in the share price, which is why Ramsay’s 13-15% jump on 27 August came despite the stock having already recovered materially from its 2022 lows.
By 11 September 2026, the stock had reached $53.55, a one-month gain of 19.3%. This is a sustained, fundamentals-driven re-rating rather than a single-day spike that faded.
Impressive across the board Jarden analyst Steve Wheen characterised the FY26 result as “impressive across the board,” pointing to cost control, operating leverage, and Australian margin expansion.
Here is the tension that makes Ramsay genuinely interesting rather than a straightforward momentum story. Ord Minnett raised its FY27-FY29 EPS estimates by roughly 2% and lifted its target price to $48.00 from $46.30, yet retained a “Lighten” rating on valuation grounds.
Read that carefully. A broker is upgrading its forecasts and its target while simultaneously telling clients the current $53.55 price has overshot the fundamentals.
That alignment is the most important single fact in this section. An Ord Minnett Lighten call at $48.00 against a market price of $53.55 is a valuation warning, and an RSI of 79 is a momentum warning. Both are pointing at the same thing from different angles: the good news, and then some, is already in the price.
For long-run context, the stock remains roughly 30% below its April 2022 record high even after this run, and a shareholder vote on the Ramsay Santé demerger is targeted for November 2026. Neither changes the near-term picture, but both frame the debate about where the next move comes from.
What RSI actually tells you, and what it misses after an earnings catalyst
The Ramsay situation is exactly why an RSI reading cannot be read as an instruction on its own. To use this week’s rankings responsibly, you need the interpretive framework the number sits inside.
The 14-day RSI measures the pace and scale of recent price movement over a rolling two-week window. Readings at or above 70 flag overbought conditions; readings at or below 30 flag oversold. The number tells you a move has been strong. It does not tell you whether the move is finished.
Academic research cited in a 2024 study of Nifty 50 equities found that RSI divergence at structural confluence levels achieved an 87.61% success rate across three eight-year windows, a meaningfully different result from the threshold-crossing approach that most retail screens, including a straight overbought flag at 70, actually rely on.
That gap matters most after an earnings beat, because of a well-documented pattern called post-earnings announcement drift (PEAD). Academic work, most notably by Ball and Brown and later Bernard and Thomas, found that markets are slow to fully absorb strong earnings surprises, so those stocks often keep outperforming for months as the information filters in.
This is why an overbought RSI following a genuine earnings beat is not automatically a sell signal. The overbought reading can simply be the market catching up to a new, higher earnings base.
- Overbought readings can persist in strong uptrends, particularly in the weeks and months after an earnings beat.
- An overbought RSI is more informative without fundamental support, such as a speculative rally, than with it.
- Acting on RSI alone risks exiting too early, or misreading a genuine re-rating as an overextension due for a correction.
The practical distinction is this: an overbought reading driven purely by speculation reads very differently from one driven by a broker consensus that is actively raising EPS forecasts. Ramsay is the live illustration, with an RSI of 79, rising earnings estimates, and continued institutional buying. The signal is ambiguous without the fundamental overlay.
When an overbought reading is a warning versus a confirmation
If earnings revisions are still rising and institutional positioning is still increasing, an overbought signal is more likely confirming a trend than flagging a reversal.
If the RSI is elevated with no fundamental catalyst behind it, no earnings beat, no commodity tailwind, no visible sector rotation, then the warning interpretation deserves more weight.
Ramsay makes the point cleanly. Its RSI of 79 and Ord Minnett’s Lighten rating are both correct at the same time. One describes momentum; the other describes valuation. If you understand that they measure different things, you are far better placed to decide what to do with the stock than someone treating either number as a verdict.
How last week’s overbought list actually performed
An RSI screen is only as useful as its track record, so here is the audit. These are the ten stocks that appeared on the overbought list dated 4 September 2026, tracked through to 11 September 2026.
| Stock (Ticker) | Entry Price (4 Sep 2026) | Exit Price (11 Sep 2026) | Weekly Return |
|---|---|---|---|
| Ramsay Health Care (RHC) | $52.29 | $53.55 | +2.4% |
| New Hope (NHC) | $6.10 | $6.33 | +3.8% |
| Elders (ELD) | $6.21 | $6.33 | +1.9% |
| APA Group (APA) | $10.91 | $10.92 | +0.1% |
| AMP (AMP) | $2.48 | $2.46 | -0.8% |
| Ansell (ANN) | $42.26 | $41.34 | -2.2% |
| Graincorp (GNC) | $6.81 | $6.55 | -3.8% |
| CSL (CSL) | $174.50 | $167.10 | -4.2% |
| Perseus Mining (PRU) | $6.77 | $6.41 | -5.3% |
| Resolute Mining (RSG) | $1.48 | $1.37 | -7.1% |
The track record The prior week’s overbought list returned an average of -1.5% over the following week, against an ASX 200 decline of approximately 2.9%.
That average decline is the headline, but the composition is where the real lesson sits. Only three names finished positive, and each had a specific catalyst behind it:
- Ramsay Health Care: carried by its FY26 earnings momentum.
- New Hope: supported by coal prices.
- Elders: lifted by rising agricultural commodity prices.
At the other end, four names fell hard: CSL down 4.2%, Perseus Mining down 5.3%, and Resolute Mining down 7.1%. Overbought status did not protect them.
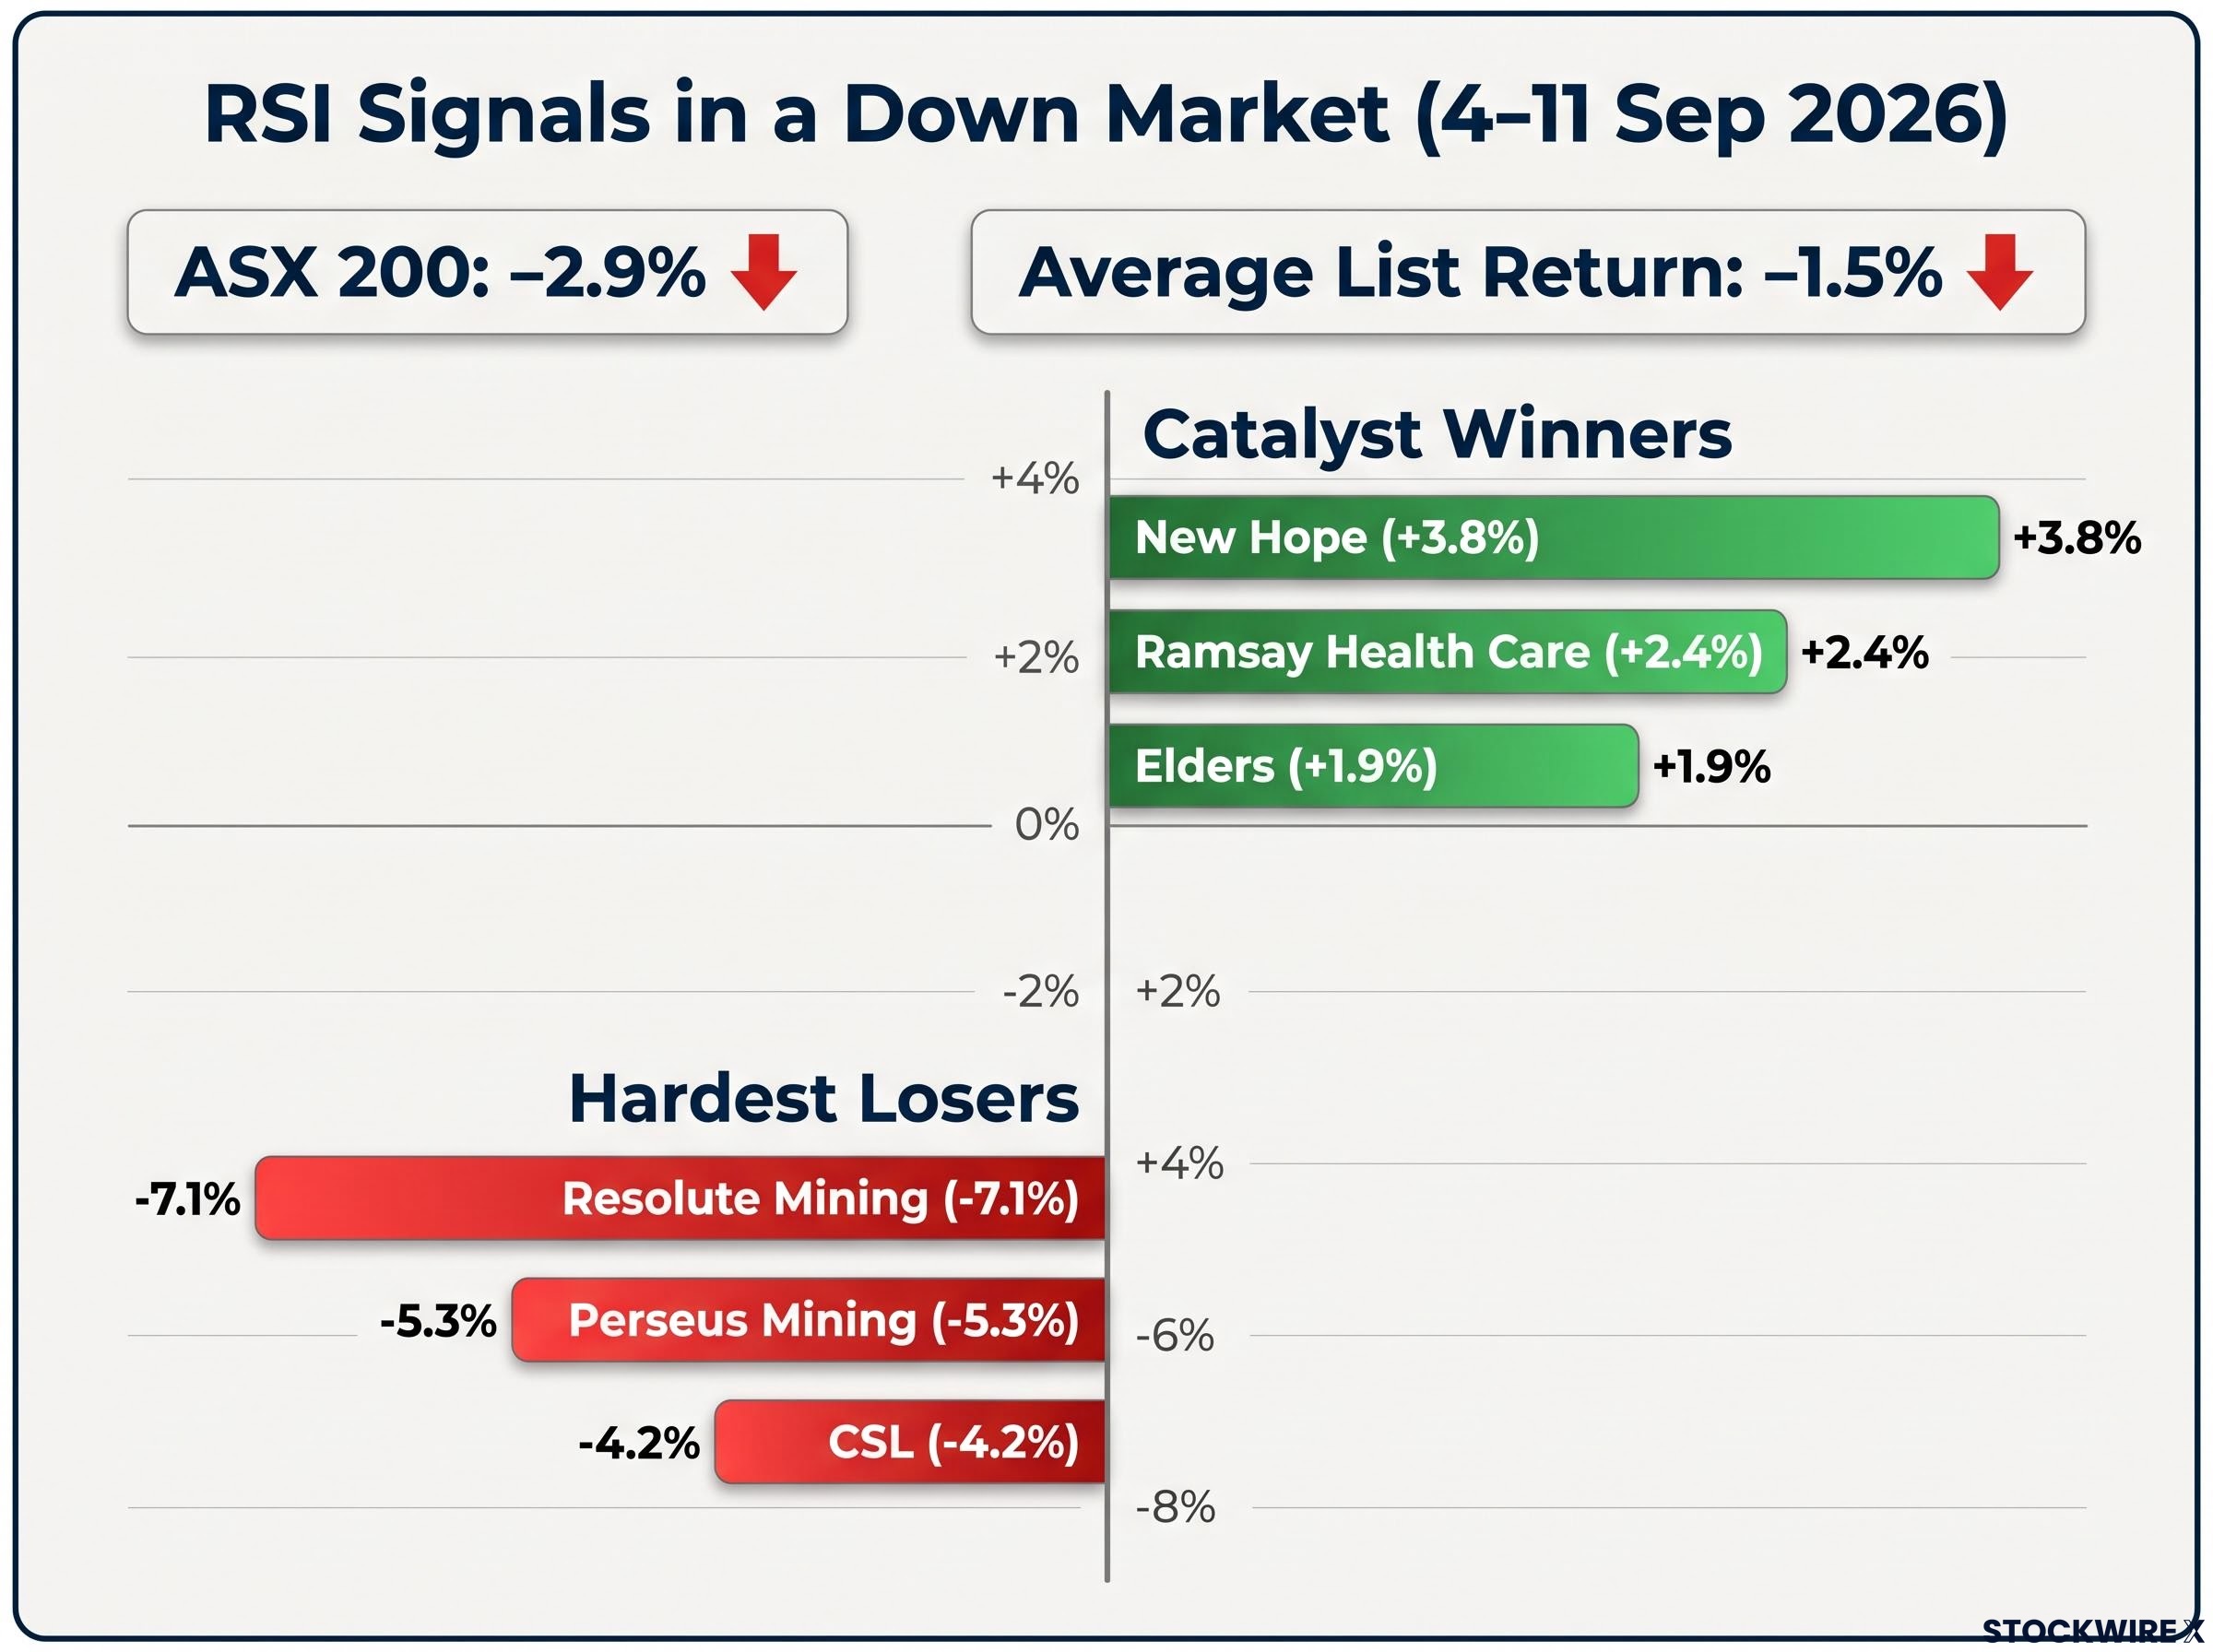
One nuance worth flagging. The two gold miners, Perseus and Resolute, fell despite gold being a traditional defensive holding, so the assumption that all commodity names benefit equally in a selloff simply did not hold.
The read for you is straightforward. In a week the index fell 2.9%, an overbought reading was not a uniform predictor of anything. The stocks that held their ground were the ones with a live earnings or commodity catalyst underneath the technical signal, which is precisely why the average matters less than the composition.
What the data changes, and what it does not
Pull the three threads together and the picture sharpens. Ramsay pairs genuine fundamental momentum with an explicit broker valuation warning. The energy names diverged from the market on commodity support, not technicals. And last week’s audit showed overbought status alone did nothing to shield stocks from the selloff.
None of that resolves into a decision for you. What it does is tell you where to look, and what to watch before the next list lands.
Three variables will shape how these names read a week from now:
- Ramsay Santé demerger progress, with the shareholder vote targeted for November 2026 and carrying execution and re-rating risk.
- Commodity price trajectory for the energy cohort, across coal, oil and gas, which determined this week’s surge and will determine whether it lasts.
- The direction of analyst earnings revisions across the overbought cohort, the single most important overlay on any RSI reading.
The mean reversion mechanics behind sector leadership changes are quantified in FY26 data showing the 10 worst-performing ASX top-100 stocks returned an average 25.2% the following year versus 10.3% for the index, context that frames why chasing this week’s overbought energy cohort without examining what drove their prior underperformance carries a specific category of risk.
The Ramsay gap quantifies the whole tension. At $53.55 against Ord Minnett’s $48.00 target, the market is paying a premium for continued momentum. Whether that premium holds depends on Australian execution, the Santé separation outcome, and whether investors keep favouring defensive healthcare. The stock is still roughly 30% below its April 2022 peak, which is context, not a target.
Next week’s list will show whether this week’s energy surge was a one-off or the start of a sustained rotation. Until then, treat these rankings as a starting point for investigation, not a decision rule. This week’s data shows exactly why that distinction is worth keeping.
This article is for informational purposes only and should not be considered financial advice. Investors should conduct their own research and consult with financial professionals before making investment decisions.
Past performance does not guarantee future results. Financial projections are subject to market conditions and various risk factors.