On low-news trading sessions through 2025, the S&P 500 kept doing something strange. It would drift toward a specific price level, stall there, and reverse at oddly predictable intervals, with no earnings report or economic release to explain any of it.
The clearest example came on 12 December 2025. The heaviest concentration of same-day SPX options activity that morning sat at the 6,900 strike. The index closed at 6,901, one point above it. That was not a coincidence, and it was not fundamentals.
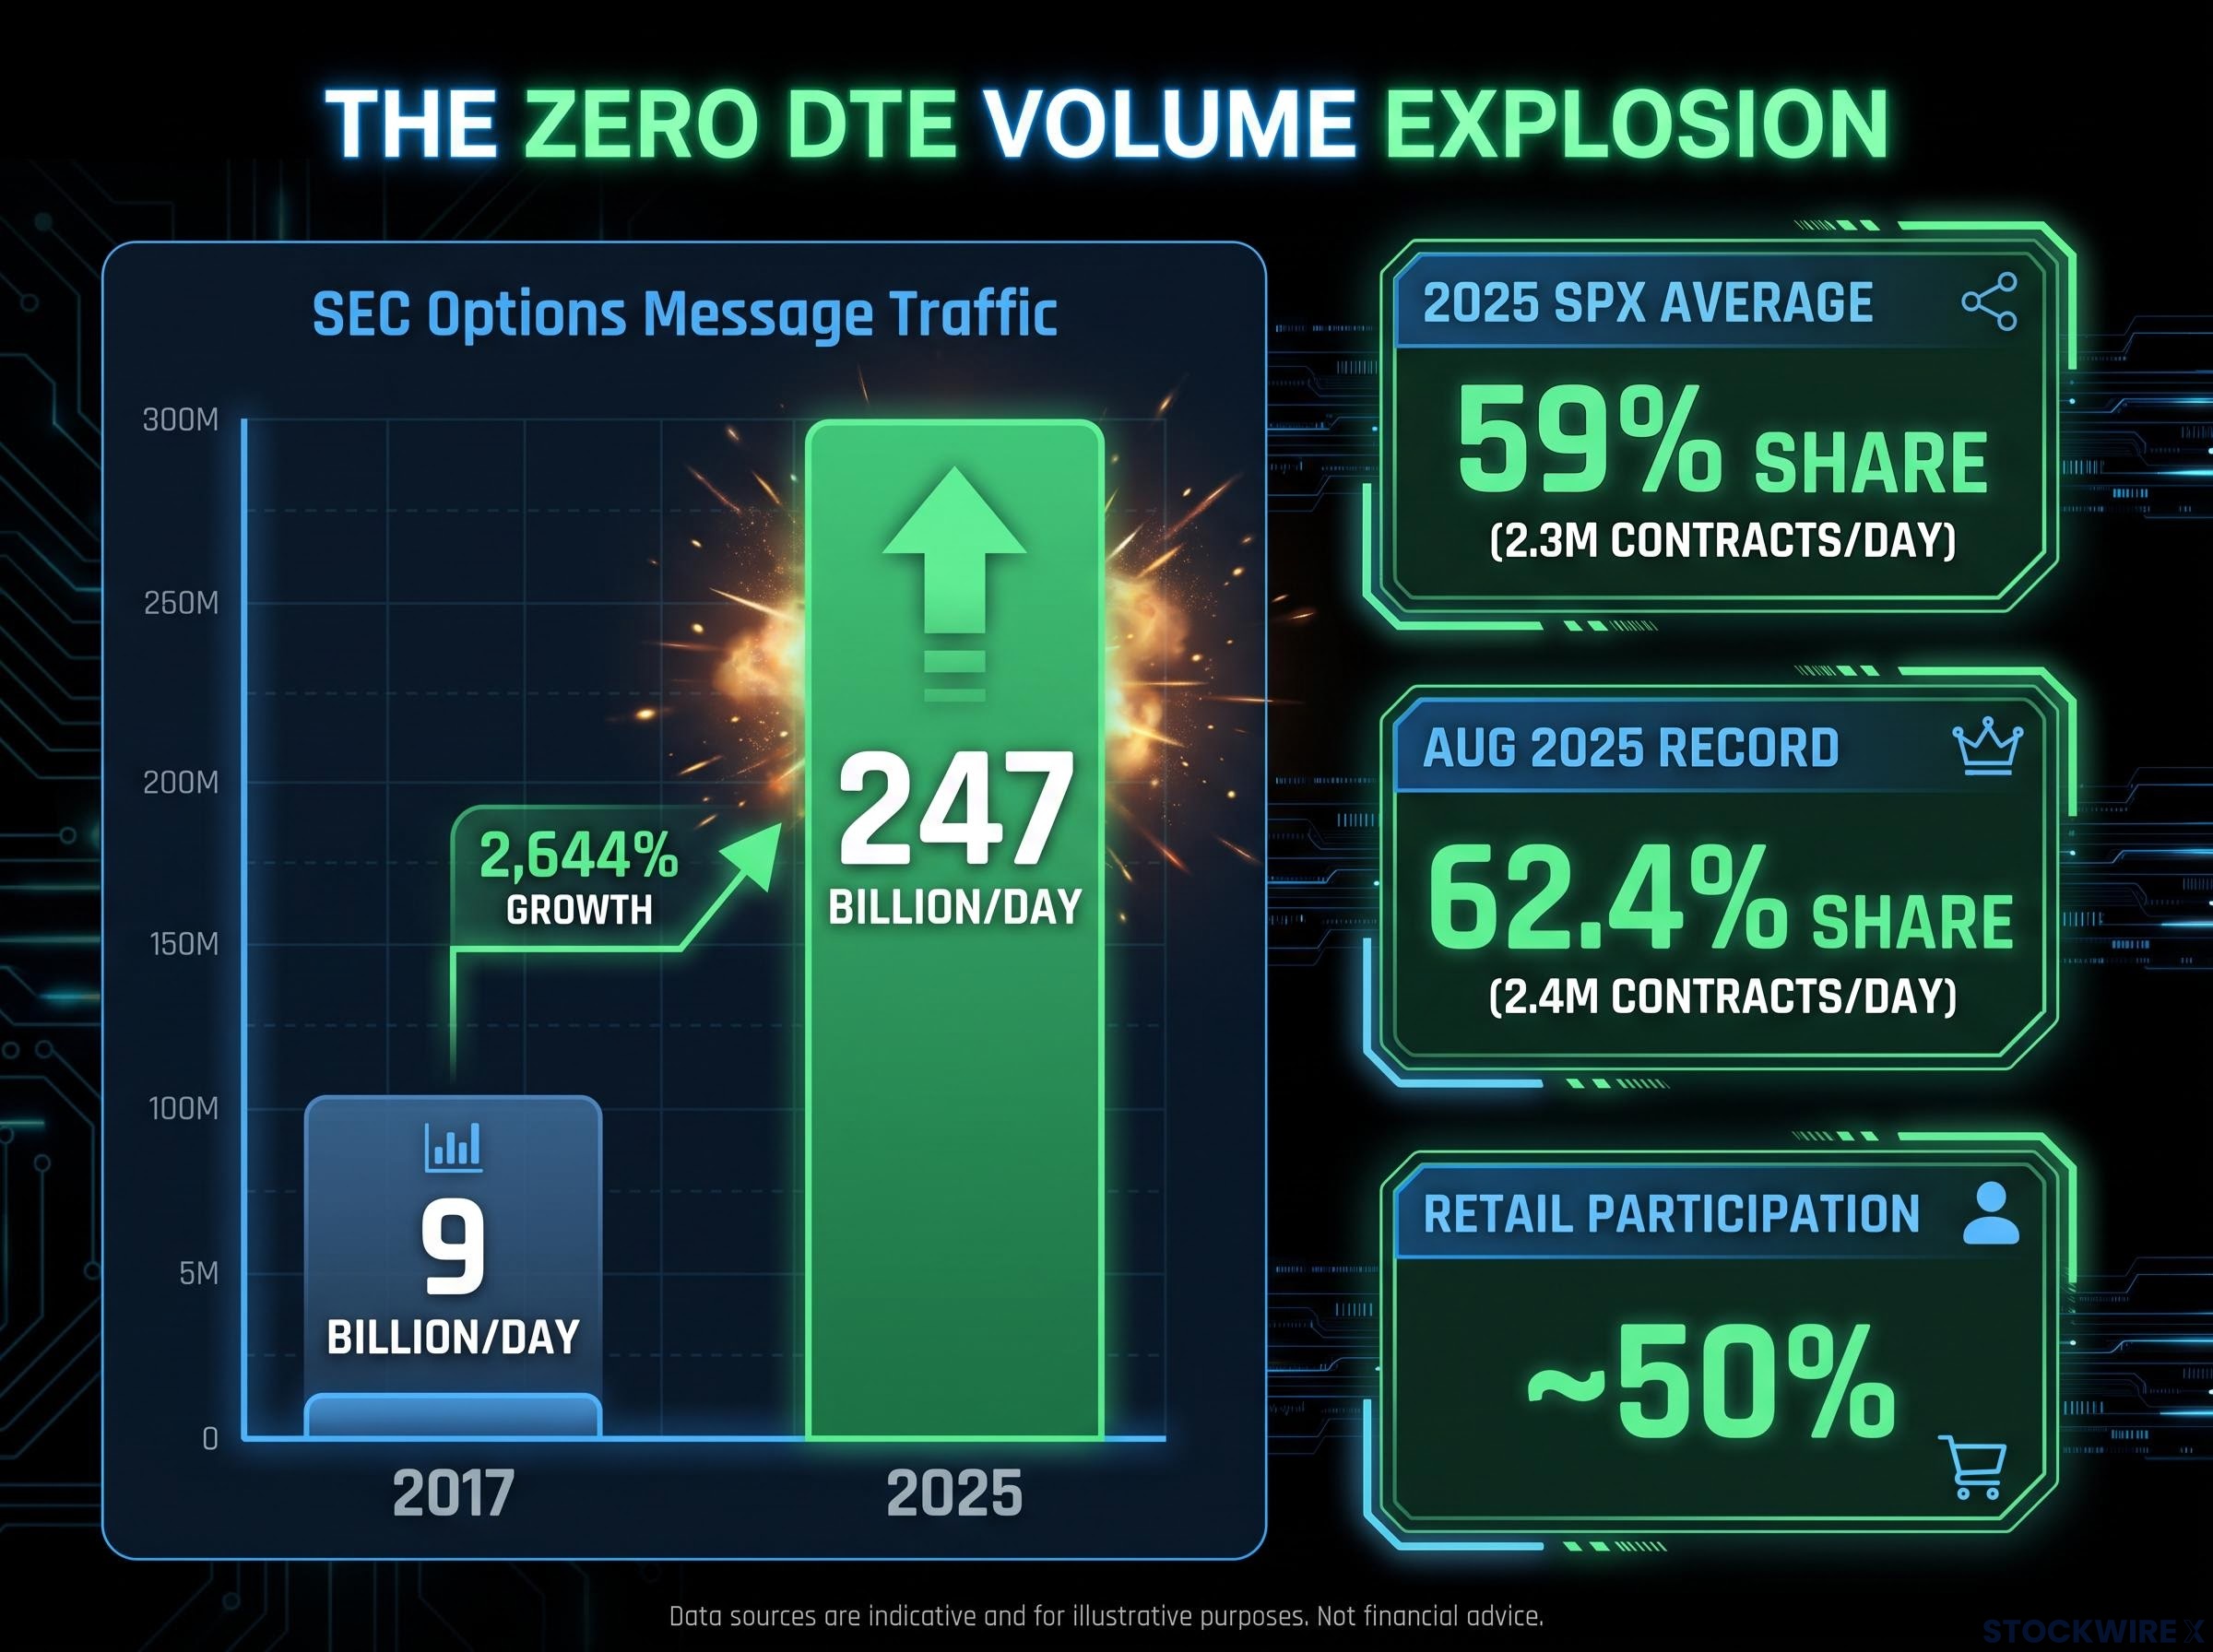
Same-day expiring options, known as zero DTE options, now account for roughly 59% of all SPX options volume by daily contract count, averaging 2.3 million contracts per session in 2025 according to Cboe data. This is no longer a niche corner of the derivatives market. It is a structural feature of how the index behaves hour to hour.
Read this, and you will be able to look at an intraday S&P 500 chart and recognise the signatures that same-day options positioning leaves behind. More importantly, you will know when those signatures point to a market being held stable and when they warn of a sudden, amplified move.
From niche product to market-moving force: how zero DTE options took over SPX
A zero DTE option is a contract that expires the same trading session you buy it. Every bit of its time value, the portion of an option’s price tied to the possibility of movement before expiry, decays within hours rather than days or weeks. That compression is the entire point, and it is what makes these instruments behave so differently from ordinary options.
The structural trigger came in 2022, when the Cboe expanded SPX options to daily expirations, Monday through Friday. Before that, traders wanting same-day exposure had limited windows. After it, every single trading day became a same-day expiry day, creating a continuous on-ramp that simply did not exist previously.
The volume figures since then tell you how completely traders took that on-ramp.
Cboe’s 2025 options industry report confirms that zero DTE SPX contracts averaged 2.3 million daily and captured 59% of total SPX options volume across the year, with August 2025 setting a record monthly share of 62.4%.
- SPX zero DTE options averaged 59% of total SPX options volume across 2025, at roughly 2.3 million contracts per day, according to Cboe.
- August 2025 set a record monthly share of 62.4%, with about 2.4 million contracts traded daily.
- Extend the window to five days or fewer, and roughly 80% of SPX and QQQ flow falls into that short-duration bucket.
- Across the entire US listed options market, zero DTE contracts made up 24.1% of total volume in 2025, with SPX showing the highest concentration of any product.
The plumbing underneath this has scaled just as dramatically.
According to the SEC, total options message traffic exploded from 9 billion messages per day in 2017 to 247 billion per day in 2025.
Retail participation is estimated near 50% of zero DTE activity, which means this is not purely an institutional phenomenon. Ordinary self-directed traders are a substantial share of the flow.
Here is what those numbers actually mean for you. The S&P 500’s intraday price behaviour is now substantially co-authored by same-day options positioning. What looks like random chop on a quiet afternoon frequently has a structural explanation rooted in where that day’s strikes are clustered, and if you are trying to interpret index moves without this lens, you are working with an incomplete picture.
When big ASX news breaks, our subscribers know first
What dealers must do when they sell you a same-day option
The moment a market maker sells you a zero DTE option, they inherit a problem. They are now exposed to the direction of the market, and they do not want to be. So they immediately take an offsetting position in the underlying index or futures to stay directionally neutral, a process called delta hedging.
Delta hedging is the mechanism that converts options positioning into real index flows, and the speed at which a dealer must re-hedge accelerates sharply as expiration approaches, because the same underlying price move forces a proportionally larger adjustment when time value has nearly expired.
The catch is that this hedge is never a set-and-forget trade. As the index moves, the dealer’s exposure shifts, and they must continuously adjust the hedge throughout the session. Whether that adjustment calms the market or feeds a move depends entirely on which side of gamma the dealer sits on.
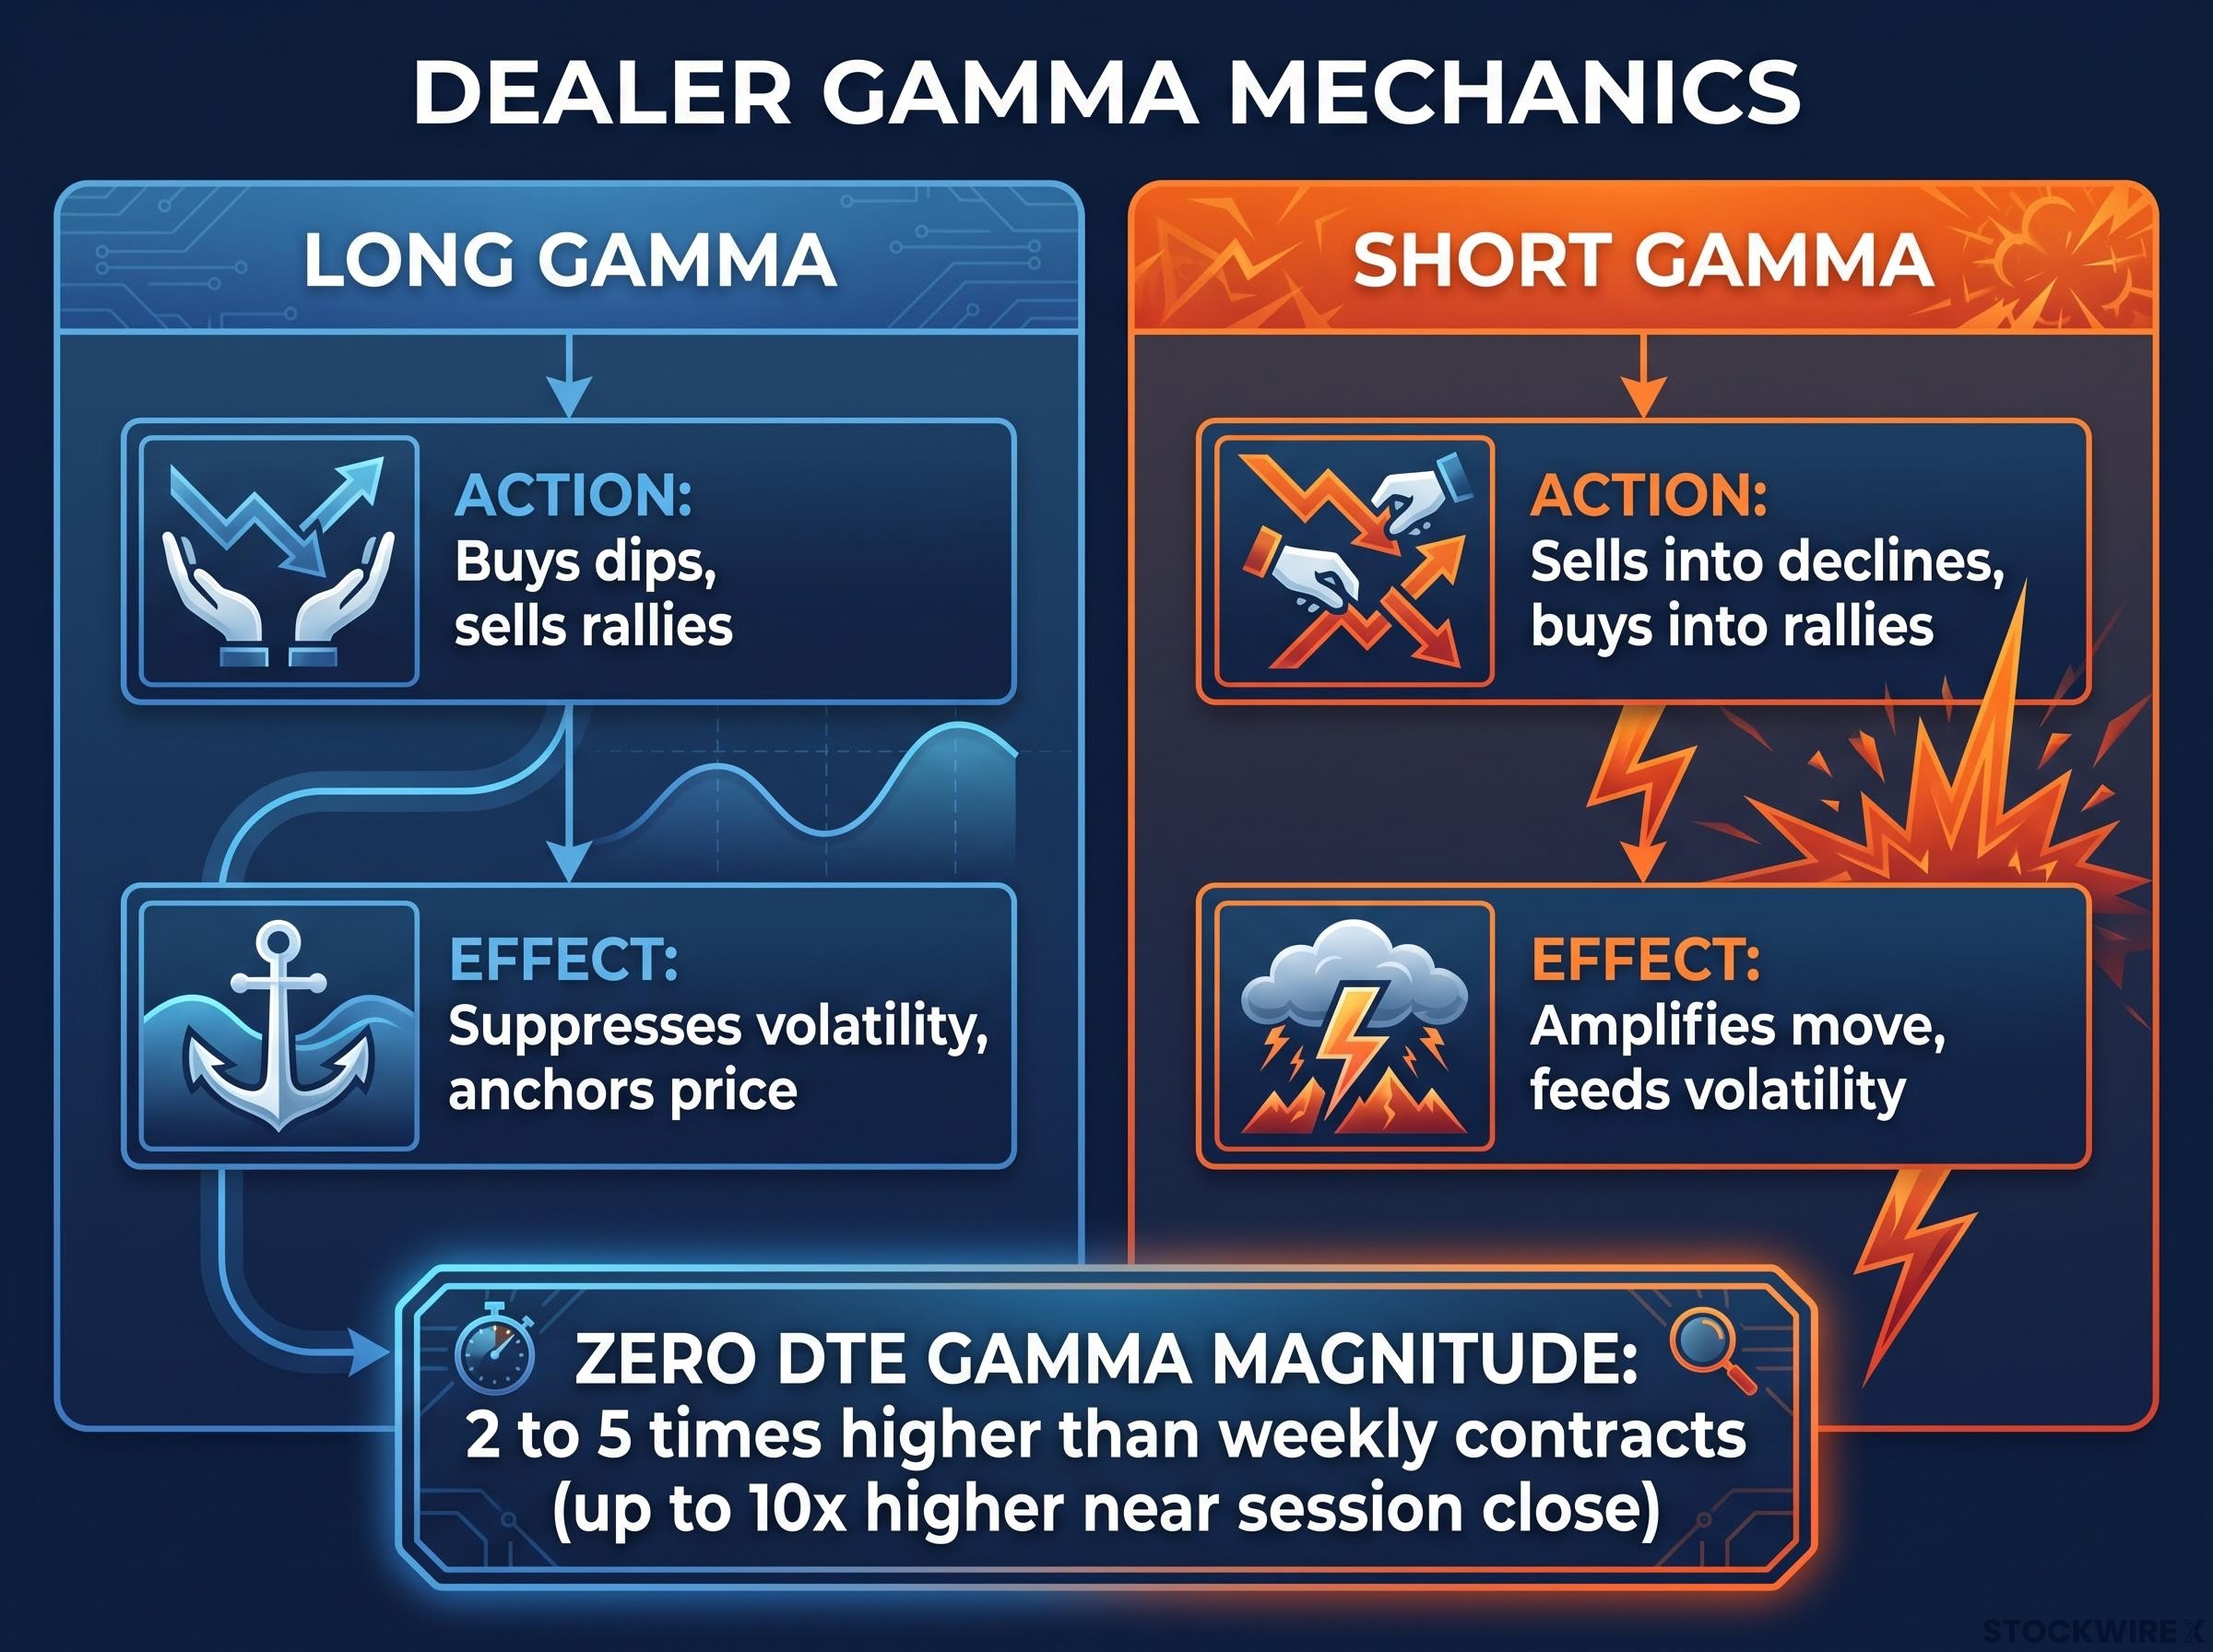
Gamma measures how fast a dealer’s hedging need changes as the underlying moves. It comes in two states, and the difference between them is the single most useful concept for reading intraday behaviour.
| Dealer positioning | Hedging action | Market effect |
|---|---|---|
| Long gamma | Buys dips, sells rallies | Suppresses volatility, anchors price near strikes |
| Short gamma | Sells into declines, buys into rallies | Amplifies the move, feeds volatility |
Now the part that makes zero DTE options genuinely different. Gamma for these contracts runs 2 to 5 times higher than equivalent weekly contracts, and potentially 10 times higher near the session close. Even a small spot move can therefore force dealers into disproportionately large hedging trades in the final hour.
The aggregate effect stays modest under normal conditions. Cboe estimates net market-maker gamma from SPX zero DTE trading averages just 0.04% to 0.17% of daily S&P futures liquidity when flows are balanced.
That balance is the key qualifier. On 8 September, real-time flow monitoring showed a symmetric structure taking shape: a large put spread around the 7,650 to 7,655 strikes, roughly 10,000 contracts, matched against a call spread near the 8,000 level. This two-sided condor-style position anchors the index between its wings, a live example of long gamma holding a market in place.
The takeaway for you is direct. The gamma magnitude differential is what separates zero DTE from ordinary short-dated options, and hedging flows near the close can overwhelm genuine price discovery on any given afternoon. If you see the S&P 500 grinding toward a specific level in the final hour, check where the zero DTE strikes sit before assuming the move is fundamental.
Why rolling positions adds noise, not just adjustments
Traders holding condor or put spread positions rarely leave them untouched all day. As the index moves, they roll their strikes, adjusting the levels to keep the structure centred. Rolling a put spread downward, for instance, introduces additional negative delta into dealer books.
Each of those adjustments sends a fresh ripple of hedging flow through the market. It is a steady drip of delta changes rather than a single event, and this is where the everyday market noise comes from. The tricky part is that it is not random, but it is also not driven by any external fundamental event, which makes it genuinely hard to distinguish from real directional flow unless you have access to live positioning data.
Do zero DTE options stabilise or destabilise the S&P 500?
Ask whether zero DTE options make the market safer or more dangerous, and you will find serious evidence pointing in both directions. The honest answer is that both camps are right, just under different conditions.
Start with the stabilising case, which has real academic support.
- A February 2026 SSRN paper by Adams et al. found that index return volatility is lower by 60 to 90 annualised basis points on days when zero DTE trading is present.
- An August 2026 SSRN paper found that market-maker net gamma is, on average, positive and negatively related to future intraday volatility, meaning it strengthens reversals rather than trends.
- Cboe’s own impact studies conclude aggregate customer flow is extremely balanced under normal conditions, keeping net dealer gamma at that minimal 0.04% to 0.17% of futures liquidity.
Now the destabilising and tail-risk case, which comes largely from systemic-risk monitors and institutional quant desks.
- A January 2025 SSRN study using proprietary options market-maker gamma data estimated the maximum impact of that gamma at an increase of +3.3 percentage points in annualised realised daily volatility, and a 6.4 percentage point jump in 30-minute volatility.
- JPMorgan modelled an extreme stress scenario in which an intraday S&P 500 drop could be amplified by short-volatility sellers rushing to hedge simultaneously.
JPMorgan’s stress scenario warns that intraday amplification could reach 4 to 20 percentage points as short-volatility sellers in zero DTE options unwind on massive notional volumes at the same time.
So which is it? The synthesis is conditional, and that conditionality is the whole insight. Under balanced customer flows and positive net dealer gamma, the effect is stabilising, exactly what the August 2025 record share showed when it aligned with a compressed range and constant reversals. When those conditions break, particularly around major expiration events or in fast-moving markets, the same mechanism flips to amplification.
For you, this resolves the most common framing error in public coverage. Zero DTE options are neither inherently dangerous nor inherently calming. If you have seen either the “these are suppressing volatility” or the “these will cause a crash” narrative, both are correct under different conditions, which is why identifying the current gamma environment matters far more than picking a side.
Real sessions, real pinning: episodes where zero DTE left a visible mark
The mechanics are not theoretical. They show up in the historical record, and once you know what to look for, the pattern becomes legible session after session.
- March 2025 (intraday dominance): Reuters reported that intraday S&P 500 moves exceeded overnight moves by the largest margin in over two years, featuring multiple selloffs of more than 2% within single sessions. The action was happening during the day, not between them.
- April 2025 (short gamma under stress): As tariff volatility surged, zero DTE activity soared to 8.5 million contracts, a 23% year-to-date increase. Dealer hedging intensified intraday swings that were largely invisible in close-to-close metrics, a live demonstration of the amplification case.
- August 2025 (positive gamma suppression): The record 62.4% zero DTE share aligned with a highly compressed trading range and frequent intraday reversals, the stabilising mechanics working exactly as the theory predicts.
- 12 December 2025 (flow-driven pinning): With the heaviest activity concentrated at the 6,900 strike, the index closed at 6,901. Flow dynamics overrode fundamental price discovery almost completely.
That December pinning episode is worth sitting with. The index did not close at 6,901 because of any news. It closed there because of where the options sat, and once you internalise that distinction, you will read similar sessions very differently in future.
When the tail risk is personal, not systemic
Most zero DTE discussion focuses on aggregate effects, but the risk picture looks entirely different for an individual participant. The same condor and put spread strategies that generate stabilising dealer flows carry severe personal tail risk.
Condor and put spread strategies are the specific structures responsible for generating the stabilising dealer flows the academic literature documents, because their two-sided premium collection creates symmetric gamma that pulls the index toward strike concentrations rather than pushing it away.
A trader widely known for large condor-style zero DTE positions reportedly suffered major losses during a prior Christmas Eve session, when a fast move blew through the structure’s wings. The detail that stands out is that the participant reportedly continued running similar positions afterwards, which is itself a data point about the risk culture surrounding these strategies. Stabilising for the market does not mean survivable for the individual holding the short volatility.
What the regulatory and systemic risk picture looks like heading into late 2026
Regulators have shifted from watching to worrying. The institutional response now frames how you should think about the months ahead, and one date in particular stands out.
The oversight activity has stacked up quickly.
- SEC data shows options message traffic climbing from 9 billion messages per day in 2017 to 247 billion in 2025, straining market plumbing.
- At a May 2026 SEC roundtable, Commissioner Hester Peirce reportedly noted zero DTE trading had grown from roughly 20% of volume in 2022 to around 28% more recently, though this specific figure has not been independently confirmed.
- A June 2026 FINRA investor bulletin warned that these options are exceptionally sensitive to underlying price changes and can magnify losses rapidly.
- SEC-filed fund prospectuses now include dedicated zero DTE Options Risk sections detailing liquidity vacuums and wider bid-ask spreads.
The most actionable item is structural rather than regulatory. The September 2026 quarterly expiration, known as triple witching because stock index futures, stock index options and single-stock options all expire together, falls on 18 September 2026.
Current dealer gamma positioning shows a supportive cushion of positive gamma near current S&P 500 levels through that date, with a gap near the 7,900 level and negative gamma extending toward 8,000. After the expiration, that cushion is projected to largely dissipate, leaving a lighter, potentially negative gamma environment that could enable faster and more amplified swings.
Fall volatility signals from the options market are already converging independently of zero DTE flows: December SPX puts approximately 460-470 points out of the money are priced at roughly $12,000 against $9,400 for equivalent calls, a $2,600 skew premium that institutional hedgers are paying above the norm for downside protection through the post-September expiration window.
The European Central Bank’s Financial Stability Review warned explicitly about amplified leverage in short-term equity options, citing systemic channels during stress unwinds where price formation becomes entirely flow-driven rather than fundamentally driven.
Individual names such as Tesla are already showing earlier directional moves than the broader index, which remains anchored by the options structure. That contrast is a preview: what this tells you is that the stable, positive-gamma-anchored market of mid-September 2026 has a defined expiry date, and the weeks that follow could look structurally very different.
After September 18: reading the market with a zero DTE lens
Everything above collapses into one practical tool: identify which gamma state the market is in, then read intraday behaviour accordingly.
| Environment | Intraday behaviour signature | What to watch for |
|---|---|---|
| Positive gamma | Compressed range, frequent reversals near strike concentrations | Index pinning near large open-interest levels at expiration |
| Negative gamma | Trend extension in the direction of the initial move | Dealers selling into declines or buying into rallies, feeding momentum |
The post-September 18 transition is your near-term test case. As the positive gamma cushion dissipates after the quarterly expiration, you get a real-time chance to watch whether the mechanics described here actually produce the predicted shift. The symmetric condor structure seen on 8 September, that 7,650 to 7,655 put spread against the 8,000 call spread, is exactly the kind of anchor that fades once the surrounding positioning resets.
Watch for three signals that the environment is turning.
- Intraday ranges begin expanding rather than compressing.
- Dealer hedging becomes visible as directional pressure in the futures tape.
- Strike concentrations stop acting as reliable support or resistance.
One asymmetry is worth carrying with you. The same flows that stabilise the index at an aggregate level create severe tail risk for anyone personally holding short-volatility positions, so interpreting index behaviour and trading these strategies require entirely different risk frameworks. Zero DTE positioning is now a primary input to intraday S&P 500 interpretation, not a secondary one, and treating unexplained intraday moves as noise rather than structure is increasingly a mistake in 2026.
For readers wanting to understand how the gamma pinning described here produces a structurally suppressed VIX even when individual stocks are swinging sharply, our full explainer on dealer gamma and VIX decoupling examines how roughly $200 billion in annual structured product issuance leaves dealers long enough SPX gamma to mechanically hold the index steady while single-stock dispersion runs high.
This article is for informational purposes only and should not be considered financial advice. Investors should conduct their own research and consult with financial professionals before making investment decisions.
Past performance does not guarantee future results. Financial projections are subject to market conditions and various risk factors, and forward-looking statements about post-expiration gamma conditions are speculative and subject to change based on market developments.