Right now, if you hold a broad US index fund inside your portfolio, roughly a third of that American exposure is sitting in just ten companies. Most of them are the same handful of AI-adjacent technology names, and you probably did not consciously decide to make that bet.
That is the quiet problem with cap-weighted investing, and it has become harder to ignore in late 2026. After a stretch where equal-weight and quality strategies lagged the mega-cap surge, concentration risk has shifted from a theoretical talking point to a genuine portfolio construction concern.
Betashares has built three funds on the ASX that each apply a different non-market-cap methodology, and you can buy all three through an ordinary brokerage account. This guide walks you through what each Betashares alternative ETF actually does differently, where each one fits in a portfolio, and what the real trade-offs look like once you strip away the marketing.
Why cap-weighted index funds create hidden concentration risk
Most index funds weight their holdings by market capitalisation, meaning the bigger a company gets, the larger its slice of the fund becomes. As a stock’s price climbs, the fund automatically buys more of it, which pushes the weighting higher still.
That creates a self-reinforcing loop. The winners keep getting a larger share of your money precisely because they have already won, and the fund you think spreads your risk across hundreds of companies quietly becomes a concentrated position in a small cluster of them.
The ASX 200 presents the same structural problem in domestic holdings: the top 10 companies account for roughly 48.6% of the index, making the cap-weight vs equal-weight decision just as consequential for your Australian allocation as it is for your US exposure.
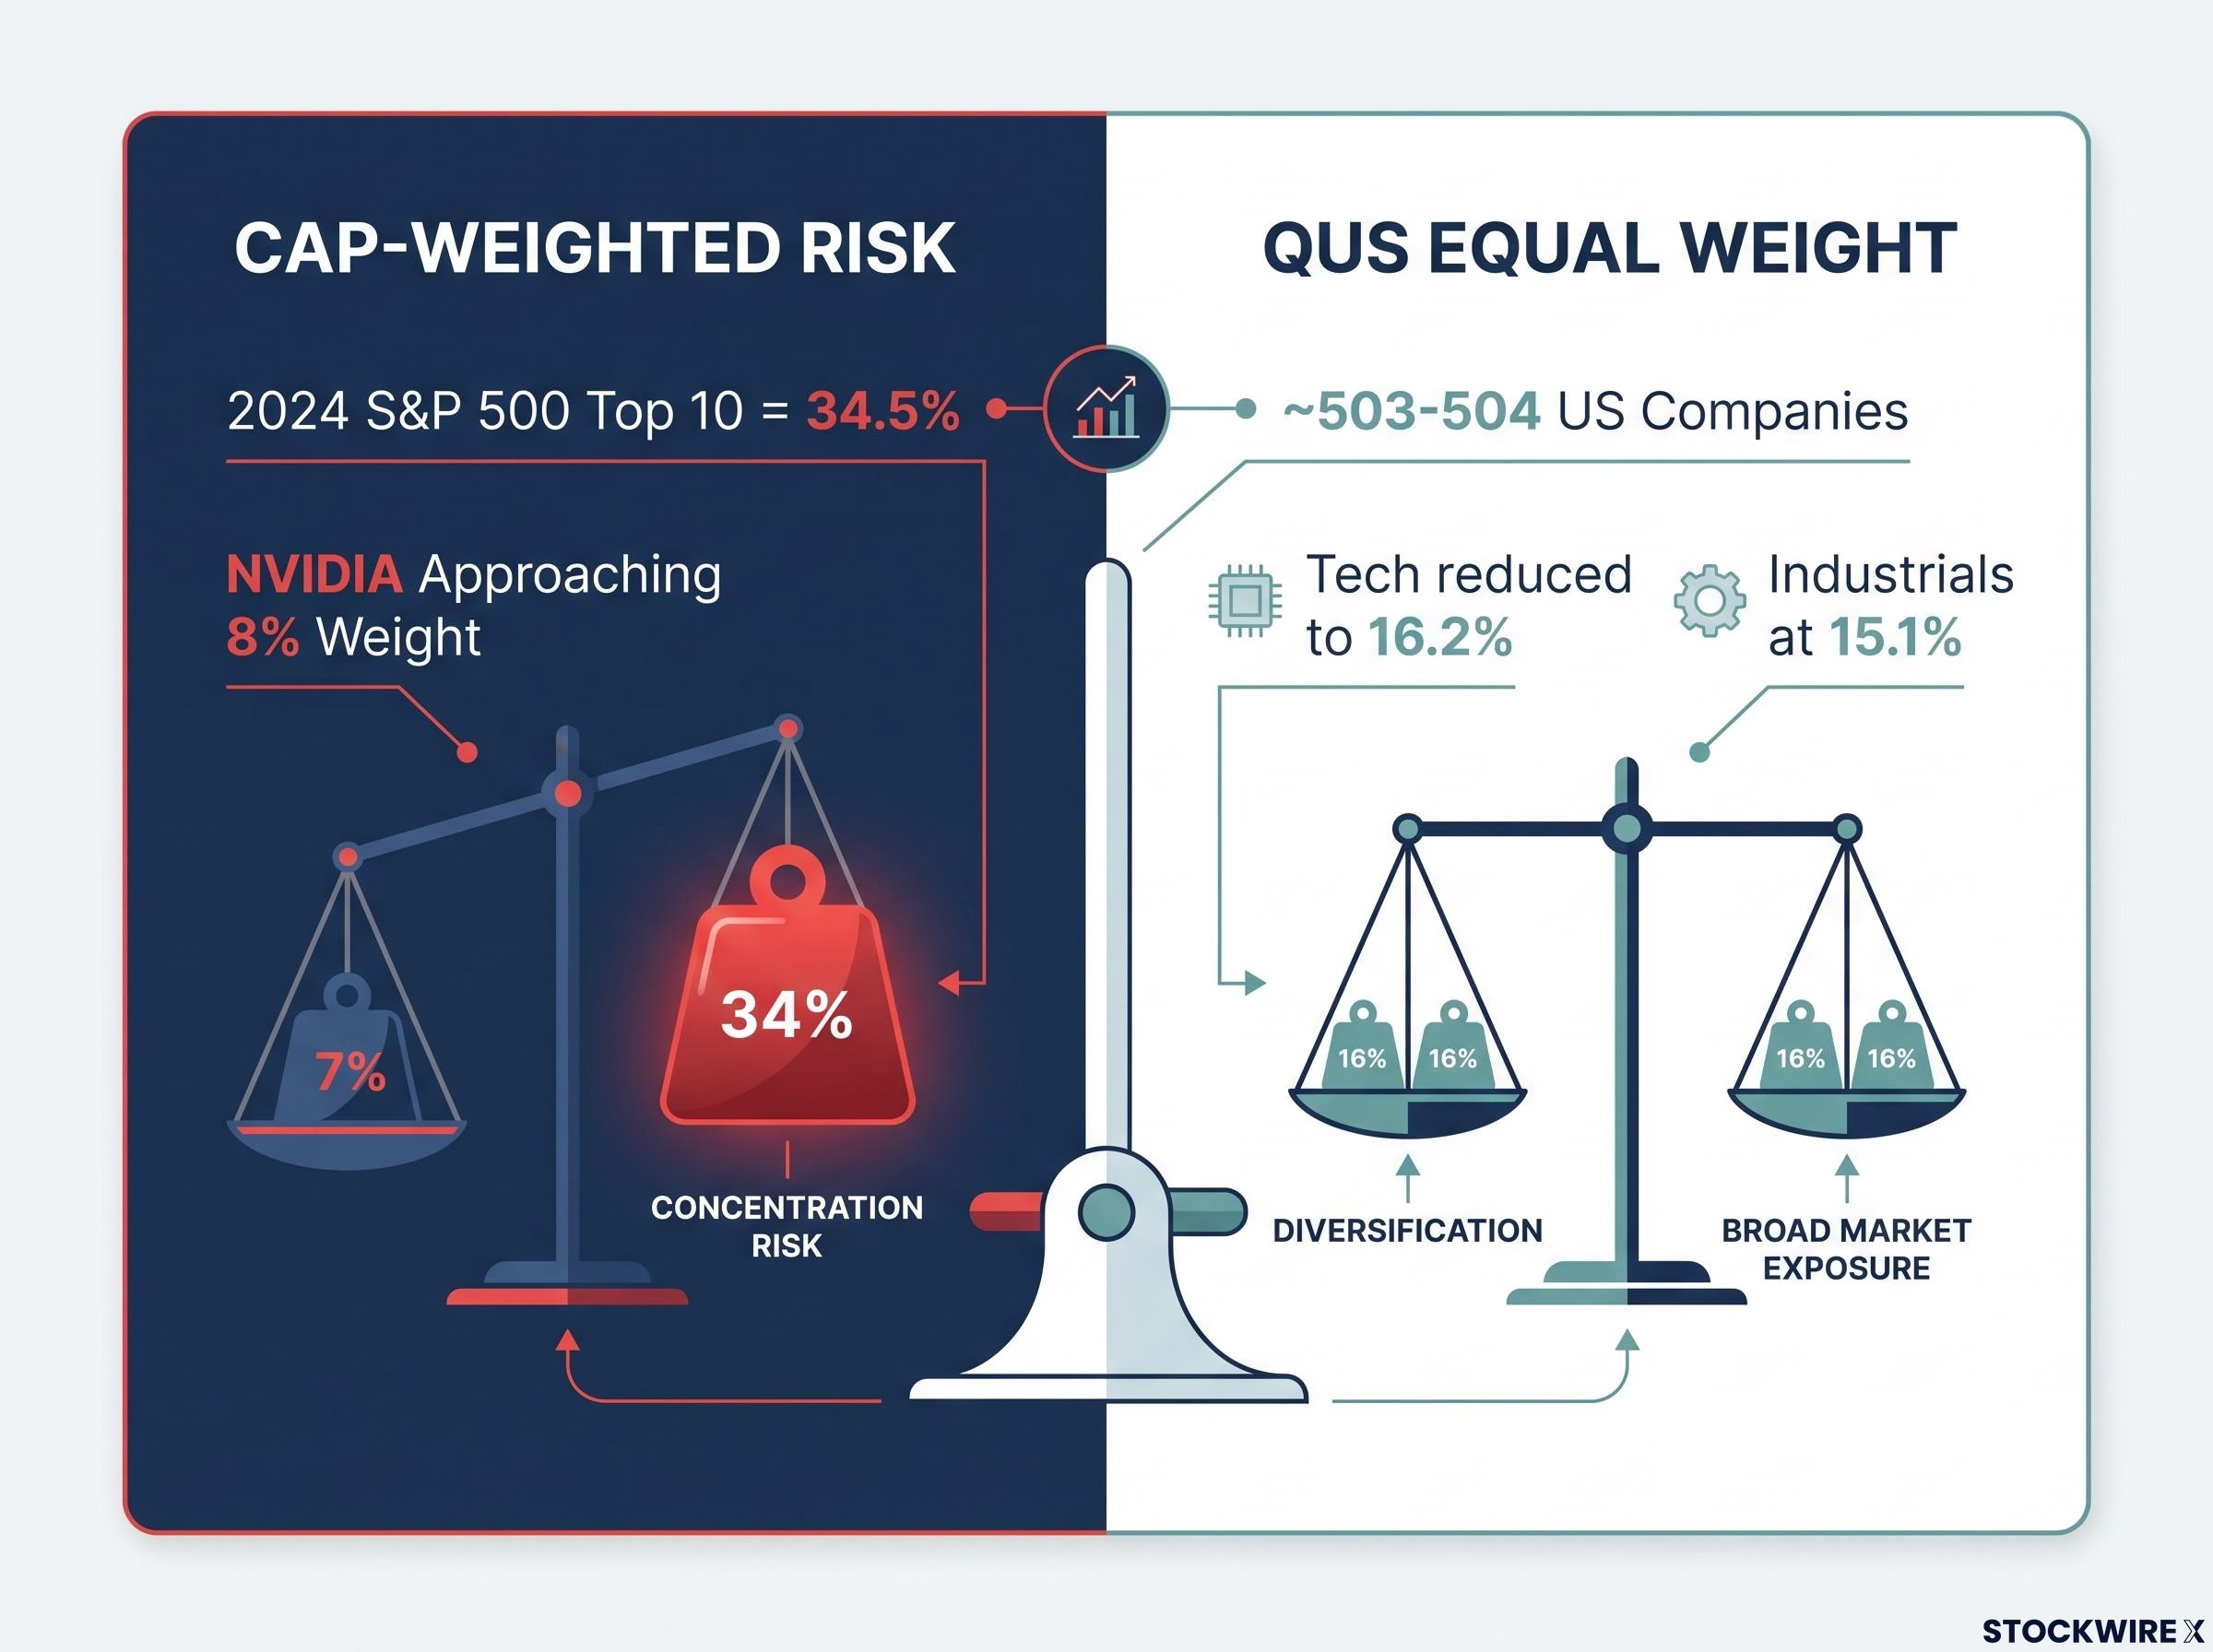
The numbers make this concrete. At one point in 2024, the top 10 names in the S&P 500 accounted for roughly 34.5% of the entire index by market cap.
The concentration reality The 10 largest companies represented roughly 34.5% of the S&P 500’s total market cap. Owning a standard S&P 500 ETF is not the same as owning 500 companies in equal measure.
This concentration produces three distinct structural risks worth naming clearly:
- Concentration risk: A large share of your capital rides on a small number of companies rather than the broad market.
- Correlation risk: Because so much index weight sits in AI-linked technology, your returns are tied heavily to AI adoption rather than the health of the wider economy.
- Idiosyncratic shock risk: A single stock like NVIDIA, at times approaching allocations near 8% in a standard cap-weighted fund, can drag the whole index down on one disappointing earnings surprise.
None of this is a prediction that mega-caps will fall. The point is different and more useful to you: a standard S&P 500 ETF is not a neutral, evenly spread holding. It is a concentrated technology bet.
The question worth asking is whether that is a bet you consciously chose, or one the weighting method made on your behalf.
When big ASX news breaks, our subscribers know first
Three funds, three methodologies: what QUS, IIND, and AQLT actually do
Each of these three funds solves a specific problem rather than offering a different flavour of the same index. Read them as design decisions, not product listings.
Betashares S&P 500 Equal Weight ETF (QUS) is the direct answer to US concentration. Instead of weighting by size, it holds around 503-504 US companies in roughly equal proportions, rebalanced every quarter. The effect on sector balance is significant: Technology drops to around 16.2%, sitting alongside Industrials at roughly 15.1%, rather than towering over everything else.
Betashares India Quality ETF (IIND) takes a different approach entirely. It applies a quality filter to Indian equities, selecting 30 companies on the basis of strong profitability, low debt, and consistent earnings. This gives you access to one of the world’s fastest-growing large economies without the financially weaker or poorly governed companies that populate broad emerging market indices.
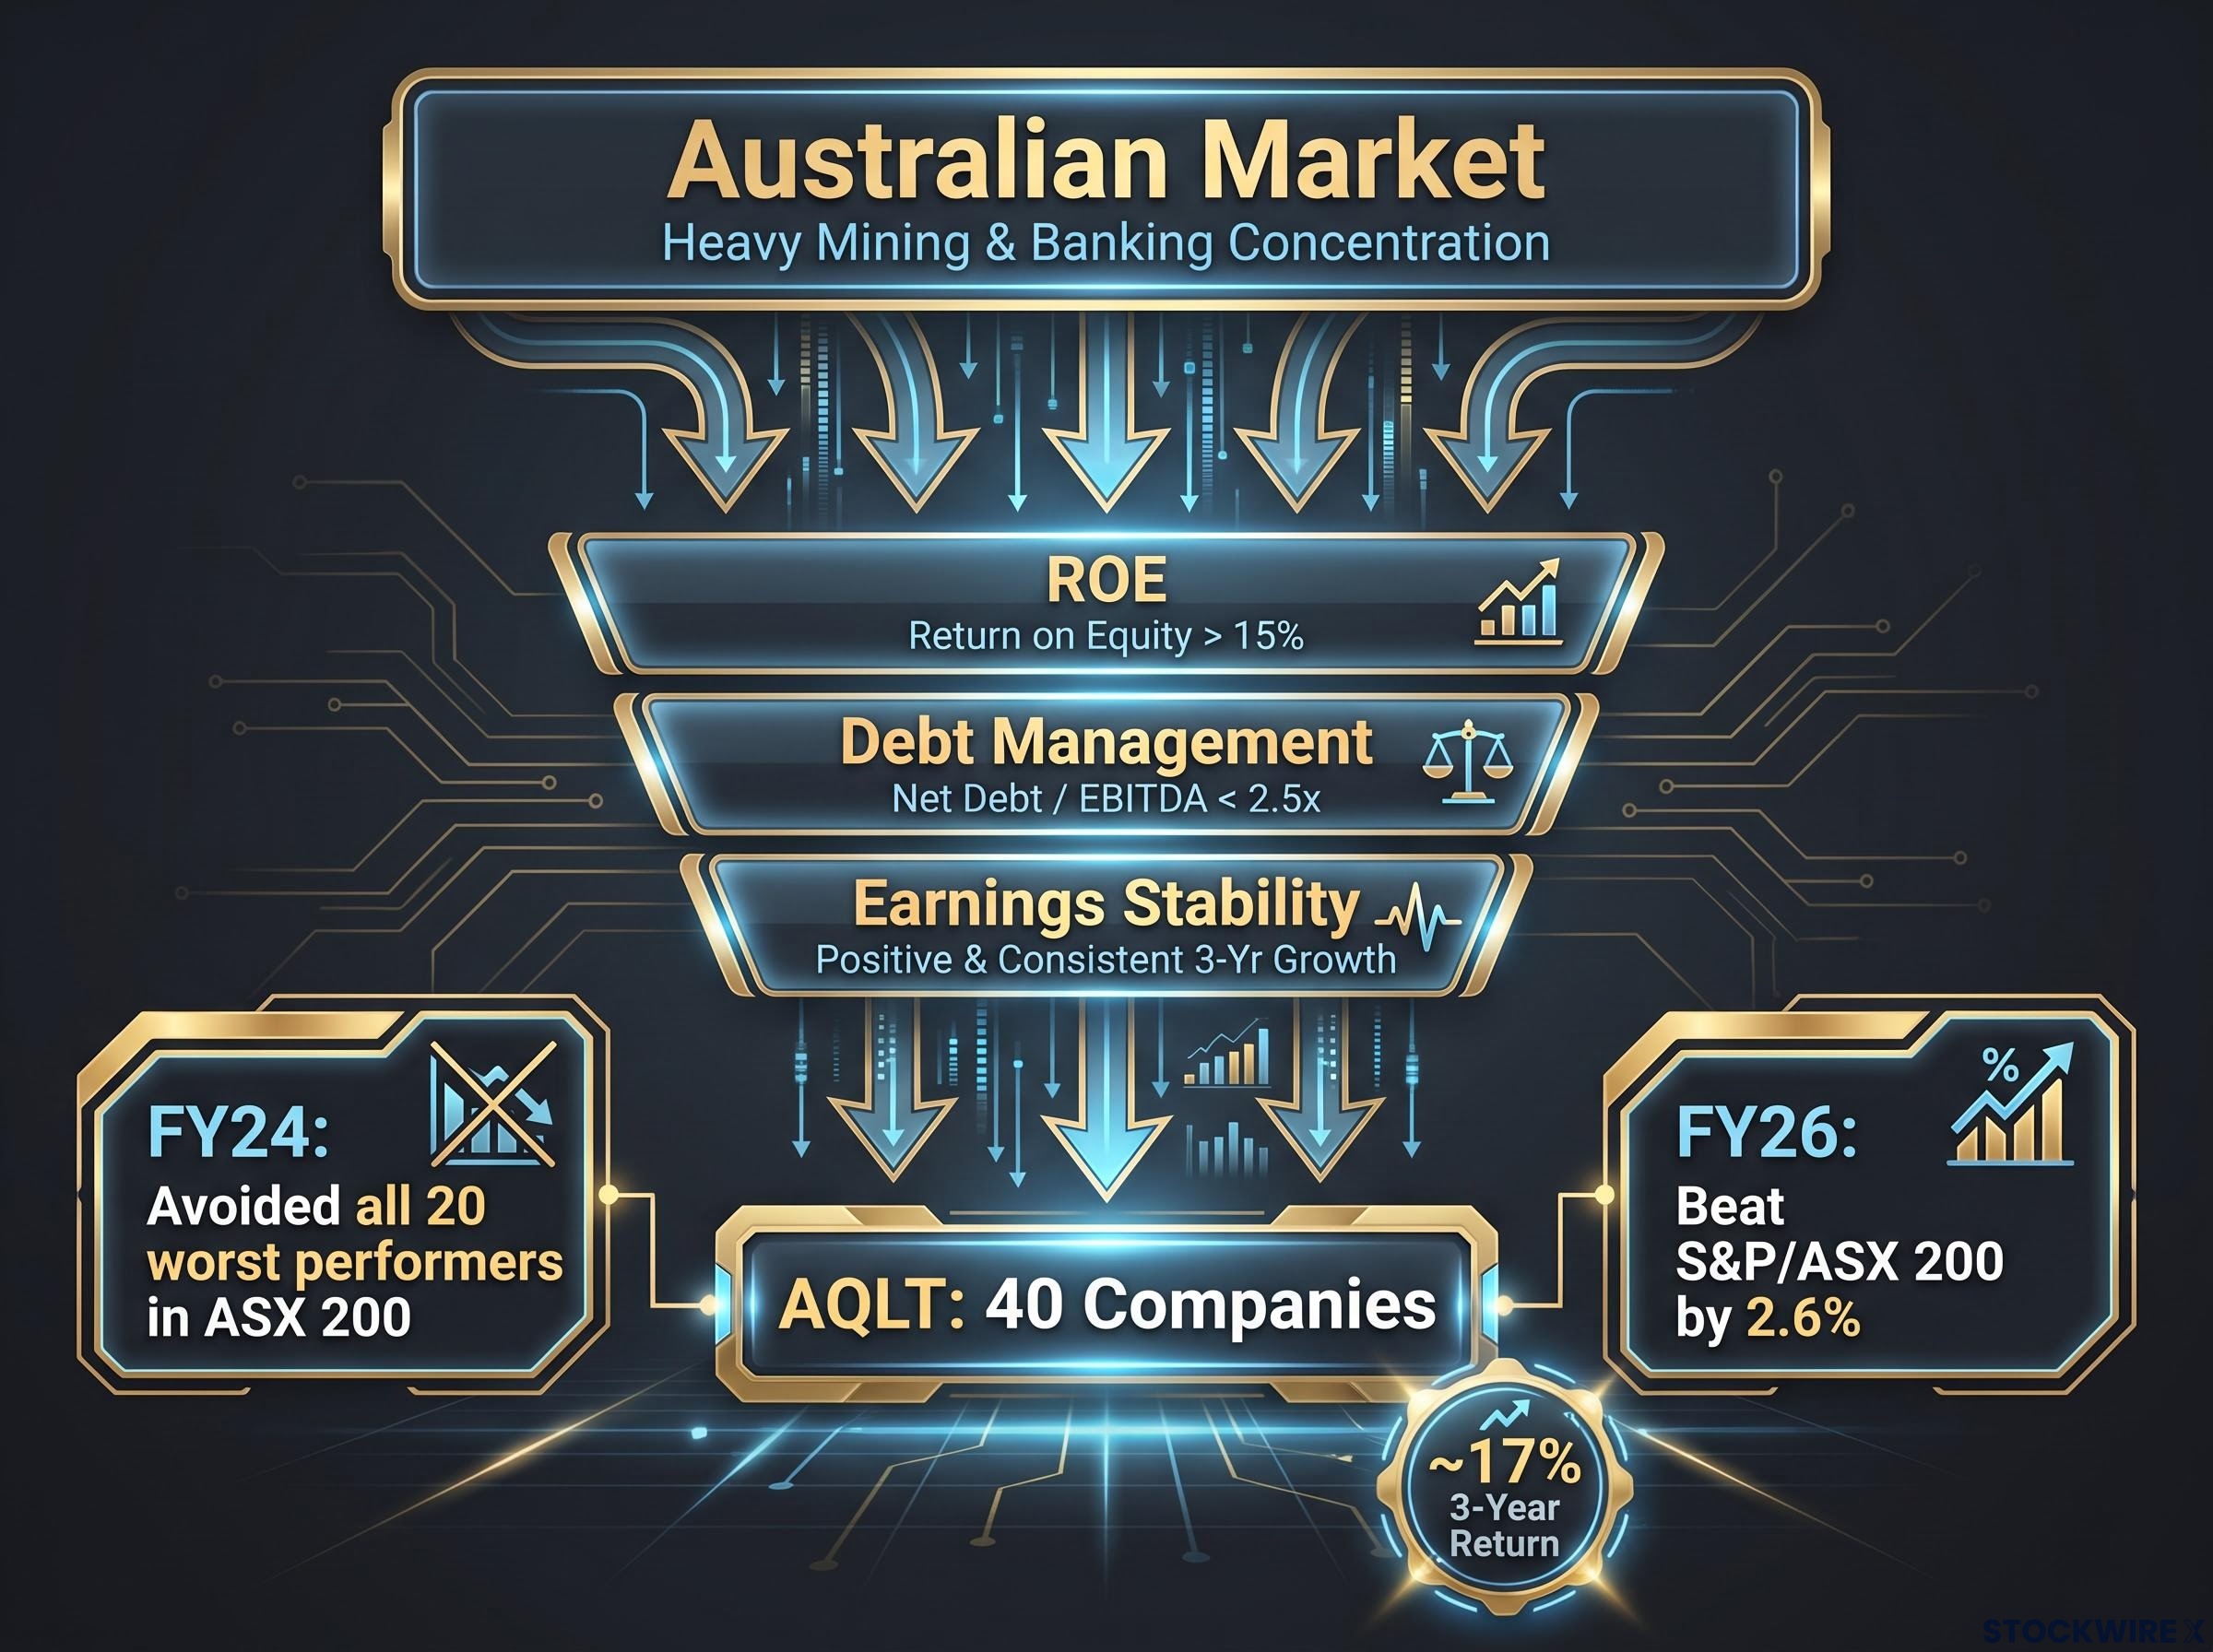
Betashares Australian Quality ETF (AQLT) brings the same quality logic home. It screens 40 large and mid-cap Australian companies on return on equity (how efficiently a company turns shareholder capital into profit), debt management, and earnings stability. The design deliberately steers away from the ASX’s heavy mining and banking concentration.
How well does that screen work in practice? During FY24, AQLT avoided all 20 of the worst performers in the ASX 200. The quality filter did exactly what it was built to do: keep the portfolio’s worst-case names out.
| Fund (ASX) | Geography | Construction Method | Holdings | Fee / FUM |
|---|---|---|---|---|
| QUS | United States | Equal weight, quarterly rebalance | ~503-504 | 0.29% p.a. / ~$1.42B |
| IIND | India | Quality screen (profitability, low leverage, earnings) | 30 | 0.80% p.a. / ~$175M |
| AQLT | Australia | Quality screen (ROE, debt, earnings stability) | 40 | 0.35% p.a. / ~$1.48B |
The fee and size gaps tell you these funds are not interchangeable. QUS launched under its current strategy in December 2020, IIND in August 2019, and AQLT in April 2022, and their costs range from 0.29% to 0.80% a year. Before you ask whether any fee is justified, work out which problem the fund is solving for your portfolio.
One variable the fund comparison table does not fully surface is QUS currency exposure: the fund is unhedged against the AUD/USD rate, a factor that produced a 13-percentage-point return gap between hedged and unhedged strategies over the year to May 2026, entirely separate from any equal-weight performance consideration.
Understanding quality and equal-weight factors: what the academic evidence actually shows
The logic behind these funds rests on two well-studied ideas: the quality factor and equal-weight rebalancing. Both have historical evidence behind them, but both also come with a cyclicality caveat you need to understand before committing.
The quality factor is a systematic preference for companies with strong profitability, low debt, and stable earnings. Academic research suggests this preference earns a persistent premium over time, and it matters most in markets where weaker companies carry real governance and liquidity risk.
Equal-weight works through mechanical discipline. Every quarter, the fund trims the holdings that have run up and tops up the ones that have lagged, which enforces a systematic sell-high, buy-low pattern without any human judgement involved.
Historical outperformance, with a caveat Academic research has suggested the S&P 500 Equal Weight Index outperformed its cap-weighted counterpart by around 1.5% per year from 2003 to 2022. This figure is not independently confirmed and reflects a specific historical window, not a guarantee of future results.
Here is the honest part. These are long-term structural tilts, not short-term return boosters, and they move through predictable phases:
- Early-cycle speculative surge: Quality and equal-weight tend to lag, because strict screens exclude the highly leveraged and speculative names that lead frothy rallies.
- Mid-cycle broadening: As market gains spread beyond a few leaders, equal-weight tends to benefit from its wider exposure.
- Late-cycle or stress environment: Quality screening’s downside protection becomes most valuable, as financially sound companies weather drawdowns better.
The cyclicality is real and can be painful. During the recent mega-cap technology surge, equal-weight reportedly lagged cap-weight by roughly 32% over three years.
Factor cyclicality is not just an abstract caveat: value and low volatility outperformed in 2022, then lagged sharply in 2023 as mega-cap technology dominated cap-weighted benchmarks, and performance chasing into a factor after a strong 3-5 year run has historically coincided with subsequent mean reversion, making entry timing a material risk even for well-constructed strategies.
That number is the single most important thing to sit with. Recent underperformance is not evidence the strategy is broken; it is evidence you need patience and a genuinely long horizon before these tilts express themselves.
The quality factor in India and Australia: why screening matters more in some markets
Quality screening does more work in some markets than others. In the US, high disclosure standards mean weak companies get priced out relatively quickly. In less liquid, less tightly governed markets like India, a screen that filters for financial health is far more consequential.
That is why IIND’s 30-stock concentrated design leans so heavily on its filter. This is not a broad India exposure vehicle; it is a curated set of companies that clear strict financial health criteria, using what researchers call the quality-minus-junk approach to sidestep speculative or fragile firms.
The Australian case is different again. Because the ASX is so concentrated in mining and banking, a quality screen naturally tilts AQLT away from cyclical commodity exposure and toward companies with steadier, more consistent earnings. The screen is not just picking winners; it is quietly reshaping your sector mix.
Performance, trade-offs, and where each fund fits in an Australian portfolio
Strategy is one thing. What these funds have actually delivered, and what they cost you, is another. Here is the practical picture.
| Fund | 1-Year Return | 3-Year Annualised | Since Inception | Management Fee |
|---|---|---|---|---|
| QUS | ~7.6% to 8.7% | ~11.1% to 11.4% | ~12.7% p.a. | 0.29% p.a. |
| AQLT | ~4.8% to 6.7% | ~17% | ~12.2% p.a. | 0.35% p.a. |
| IIND | Negative (~-11.6% to -17.2%) | Not shown | Not shown | 0.80% p.a. |
QUS and AQLT have both delivered encouraging medium-term numbers. AQLT’s roughly 17% three-year annualised return stands out, because it tells you a quality-screened fund need not sacrifice returns for safety. It has produced genuine outperformance by systematically avoiding the market’s worst names, beating the S&P/ASX 200 by 2.6% in FY26.
Quality screening in action During FY24, AQLT avoided all 20 of the worst performers in the ASX 200. That is the downside-protection function of a quality screen, made concrete.
IIND requires more honesty. Its one-year return sits between -11.6% and -17.2%, reflecting a rough stretch for Indian equities. Before you buy, you need to be sure you have the horizon and the risk tolerance to hold through that kind of drawdown.
Cost matters too. At 0.80% a year, IIND is far dearer than QUS at 0.29% and AQLT at 0.35%. For an emerging market fund currently in the red, you have to decide whether the quality filter and the India thesis justify that premium.
Each fund plays a distinct role:
- QUS: a core alternative to standard US market-cap exposure, addressing concentration risk directly.
- AQLT: a domestic quality core, tilting your Australian allocation away from banks and miners.
- IIND: a satellite growth allocation to a fast-growing economy, with a quality filter to manage emerging market risk.
What a long-term investor should take from these three funds
The most useful insight here is that these funds do not compete with one another. Each addresses a different construction problem, and their value depends entirely on which problem actually applies to your portfolio right now.
Genuine risks remain even after the clever methodology. IIND’s currency and political risk does not vanish because of a quality screen. QUS’s equal-weight approach carries higher volatility than cap-weight. And all three demand patience, because factor tilts only pay off over long horizons.
Cost deserves a second look for the patient investor. IIND’s 0.80% annual fee compounds into meaningful drag over a decade, so cost-conscious holders need real conviction in the India case to accept it.
AQLT’s since-inception return of roughly 12.2% p.a. and its 17% three-year figure represent a solid premium to the broader ASX. Just remember its April 2022 launch means that record includes the post-COVID recovery, a favourable backdrop worth factoring in.
Before adding any of these funds, ask yourself:
- Do I already hold significant US market-cap index exposure that concentrates me in mega-cap tech?
- Is my Australian allocation dominated by the big banks and miners?
- Do I have any emerging market exposure, and if so, is it quality-filtered or broad-index?
Treat a minimum horizon of five to seven years, plus a genuine tolerance for factor cyclicality, as the entry requirement for all three. The right choice is the one that fills a real gap in your holdings rather than duplicating what you already own.
For readers wanting to run a systematic check on their existing holdings before adding any of these funds, our full explainer on hidden ETF concentration walks through a practical overlap audit using issuer CSV downloads that typically reveals a unique stock count 30-40% lower than investors initially expect.
This article is for informational purposes only and should not be considered financial advice. Investors should conduct their own research and consult with financial professionals before making investment decisions. Past performance does not guarantee future results. Financial projections are subject to market conditions and various risk factors.