Roughly $32,000 invested in one ASX-listed fund buys you about $1,000 a year in passive income. That is a concrete, achievable number, and most people have never actually run the calculation before they see it written down.
The Vanguard Australian Shares Index ETF (ASX: VAS) is a natural first stop for Australian income seekers. It is among the largest exchange-traded funds on the ASX, it pays distributions quarterly with franking credits typically attached, and its trailing yield of 3.1% (Vanguard monthly fund statistics, July 2026) sits structurally higher than most global equity alternatives.
That combination, VAS as an ETF, passive income as the goal, and a low-cost entry point, is why the fund draws so much attention from investors building a domestic income stream.
Here is what the numbers actually tell you, and what they leave out.
What $32,000 in VAS actually buys you each year
Start with the arithmetic. At Vanguard’s reported trailing yield of 3.1%, generating $1,000 in annual gross distributions requires roughly $32,258 invested. At VAS’s net asset value of $112.73 per unit (as at 3 September 2026), that is approximately 286-287 units.
That is the headline answer. The reality is a small range rather than a single figure, because the yield you use depends on which 12-month window you measure.
Independent data provider ETFLens reports a trailing distribution yield closer to 3.3% (as at Q2 2026), based on income paid over the prior year. At that yield, you would need around $30,300 to produce the same $1,000.
| Yield Source | Yield Percentage | Capital Required for $1,000 Income |
|---|---|---|
| Vanguard (July 2026) | 3.1% | ~$32,258 |
| ETFLens (Q2 2026) | 3.3% | ~$30,300 |
At current yields, most investors will need between $30,000 and $33,000 in VAS to generate $1,000 per year in gross distributions.
The income does not arrive in one lump. VAS distributes quarterly, so that $1,000 reaches you as roughly $250 instalments four times a year, tied to the underlying companies’ dividend payments.
There is one more layer the headline yield understates. Because VAS holds Australian companies that attach franking credits to their dividends, the effective income for an eligible domestic investor is worth more than the cash 3.1% suggests.
That matters for planning. If you compare VAS’s cash yield directly against a fixed-income product without accounting for franking credits, you are undercounting the true income value, sometimes materially, depending on your tax position.
When big ASX news breaks, our subscribers know first
Why VAS pays more than most global ETFs
The yield premium is not luck. VAS pays more than a typical global equity ETF for three reinforcing structural reasons, and understanding them tells you that you are not simply being paid more for the same risk.
- Dividend imputation. Australian companies attach franking credits to dividends, passing on corporate tax already paid. This makes fully-franked distributions more valuable to domestic investors and encourages mature companies to maintain high payout ratios.
- Sector composition skewed to banks and miners. VAS is dominated by financials and materials, sectors that pay higher dividends than the technology names that lead global indices.
- An income-oriented market culture. Australian investors have long used domestic shares for income and offshore equities for growth, and the local market reflects that preference.
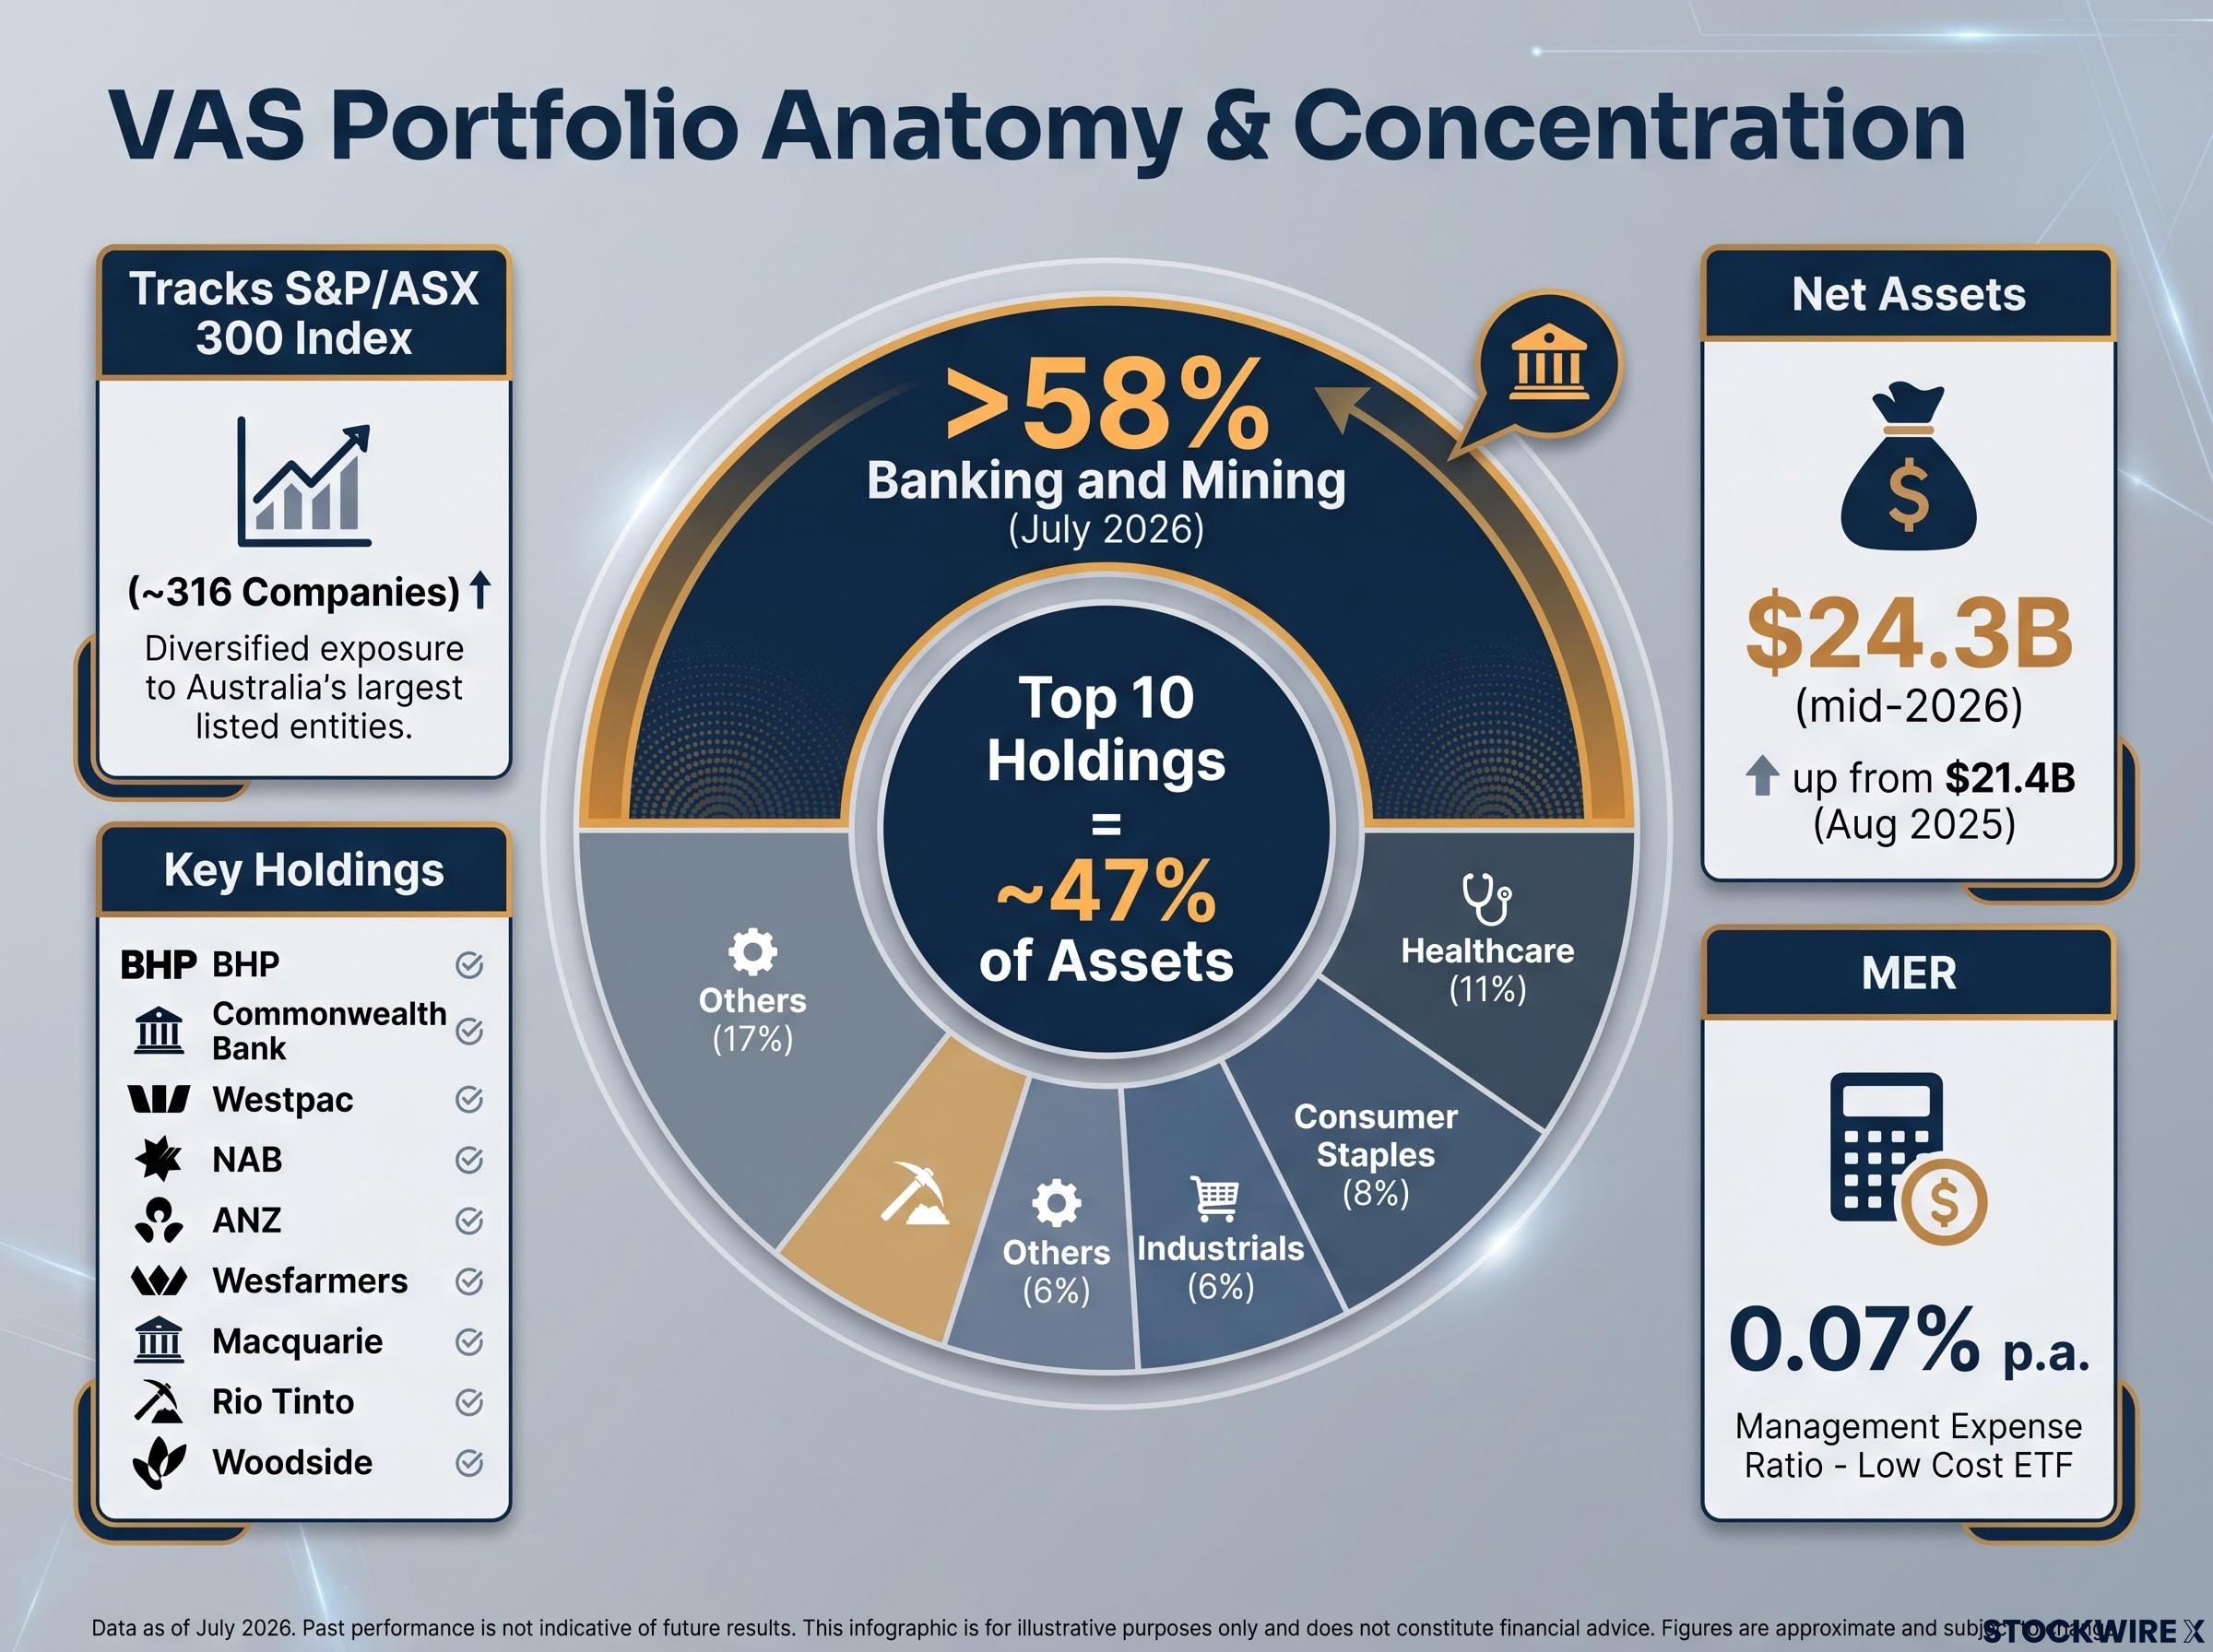
The concentration behind the second point is significant. Banking and mining together account for more than 58% of the fund (Vanguard, July 2026), and the top-10 holdings, dominated by the four major banks and BHP, make up roughly 47% of assets. Names like BHP, Commonwealth Bank, Westpac, NAB, ANZ, Wesfarmers, Macquarie, Rio Tinto and Woodside carry higher payout ratios and lower valuations than the tech-heavy US and global indices, which mechanically lifts VAS’s headline yield.
The read for you is straightforward. The yield premium is structurally tied to a concentrated bet on Australian banks and commodities, and that recognition should shape how much of your portfolio you park here.
How franking credits boost the effective yield
A 3.1% cash yield on a fully-franked ETF is worth more than 3.1% on an unfranked asset. The reason is that franking credits represent a refund of corporate tax the company has already paid on your behalf.
Australia’s dividend imputation system, as documented by the Parliamentary Budget Office, allows shareholders to claim credit for the corporate tax a company has already paid, which is why a fully-franked distribution is worth more to a domestic investor than its cash yield alone implies.
Here is a simple illustration. If VAS distributes fully-franked dividends, an investor on the 30% marginal tax rate receives a credit that offsets their personal tax bill, while a superannuation fund in accumulation phase taxed at 15% may receive a partial refund on top of the cash income.
Vanguard’s own documentation flags “dividend income and franking credits” as a core part of VAS’s return profile, which is exactly why the cash yield alone understates the story.
The value of those credits depends entirely on your personal tax position. Treat this as illustrative, not tax advice, and speak to a professional about your own circumstances before you rely on the franking layer in your income planning.
For SMSF trustees and retirees wanting to quantify the tax uplift precisely, our dedicated guide to franking credit calculations walks through the grossed-up yield formula with worked examples, including how a $1,000 fully franked dividend becomes $1,428.57 of total value for pension-phase funds.
The concentration and cyclicality risks income investors often overlook
The same sector bets that produce VAS’s yield also produce its risks. This income is not passive in the passive-safety sense, because the machinery generating it is cyclical and concentrated in nameable ways.
Consider the exposure. With roughly 47% of assets in the top-10 holdings and more than 58% in banks and miners, VAS’s income is materially tied to two forces: the Australian credit cycle (housing stress, rising defaults) and commodity price cycles (iron ore, energy).
ETF concentration risk is a broader phenomenon than the VAS case alone: across the ASX 200, the top 10 stocks account for roughly half of the entire index, meaning a fund that appears to hold 300 companies can still deliver the return profile of a narrow sector bet.
That concentration feeds directly into distribution stability. Bank dividends can be cut in credit downturns, as happened during the 2020 COVID period, and resource payouts depend on global demand and commodity pricing.
The specific scenarios worth naming are these:
- A deteriorating credit cycle that forces the major banks to trim dividends.
- A commodity price slump that reduces BHP and Rio Tinto payouts.
- Interest rate shifts that pressure bank valuations and net interest margins.
- Regulatory change in the banking sector that alters payout capacity.
The 3.1% yield reflects the past 12 months. The sectors driving it are cyclical. That combination matters for planning.
There is also a total-return trade-off. Vanguard describes VAS as seeking to track the index before fees and taxes, which means distributions are a direct pass-through of underlying dividends, not a smoothed or targeted payout.
Because the fund has limited exposure to global technology and healthcare innovation, its capital growth potential is more modest than a globally diversified fund. ETFLens makes the point plainly: assess total return, not yield alone.
The interpretive takeaway is uncomfortable but useful. The very feature that makes VAS higher-yielding than global alternatives also makes its income the least stable in a financial-system or commodity stress scenario, which argues for holding a cash buffer or blending your income sources rather than leaning entirely on VAS.
What VAS and the Australian share market are, and how they relate to global ETF alternatives
Step back to what VAS is actually doing inside a portfolio. The fund tracks the S&P/ASX 300 Index (ASX: XKO), holding approximately 316 of the largest ASX-listed companies on a market-cap weighted basis, at a management expense ratio (MER) of just 0.07% per annum. Net assets sit at roughly $24.3 billion (ETFLens, mid-2026), up from the $21.4 billion Vanguard reported for the ETF portion in August 2025.
Vanguard positions this deliberately. VAS is framed as the domestic income and capital growth building block (dividends plus franking credits), while VGS, the Vanguard MSCI Index International Shares ETF, supplies the global sector diversification and growth potential the bank- and miner-heavy local market cannot provide on its own.
| Attribute | VAS | VGS | Key Difference |
|---|---|---|---|
| Primary use case | Domestic income | Global growth | Income vs growth focus |
| Trailing yield | 3.1-3.3% | Typically lower | VAS pays more cash income |
| Sector tilt | Banks and miners | Diversified, tech-heavy | VAS concentrated, VGS broad |
| MER | 0.07% p.a. | Higher than VAS | VAS is lower cost |
The practical pattern that follows is a blend. Domestic ETFs like VAS supply franked cash flow and local income yield, while global ETFs broaden sector and geographic exposure and improve long-term total-return potential.
A detailed VAS and VGS comparison shows that over the five years to mid-2026 a $10,000 investment in VGS grew to approximately $18,775 versus roughly $14,399 in VAS, a gap driven by US technology performance rather than a permanent structural advantage, and one that franking credits can partially close for investors in lower tax brackets.
Using VAS as one income source, not the whole portfolio
If you hold VAS alone for income, you are making a concentrated bet on Australian banks and miners. Understanding that tells you whether you need to pair it with global exposure to balance the portfolio’s sector mix.
Investors chasing both income and growth typically hold VAS for franked domestic income and add a global ETF for diversification. Given VAS’s thin exposure to technology and healthcare, relying on it alone may underperform a blended portfolio over a long horizon.
This is a framework, not a formula. The right split depends on your goals, your time horizon, and how much bank-and-miner concentration you are comfortable carrying.
What this means for income investors considering VAS right now
VAS is a low-cost, high-yield-by-Australian-standards income vehicle with a clear structural reason for its yield, a clear concentration risk, and a defined role inside a broader portfolio. The $30,000-$33,000 figure is a planning anchor for $1,000 of gross annual income, not a guarantee.
Yield will move as bank profitability, commodity prices, and the credit cycle shift. Plan around a sustainable income range rather than a fixed 3.1% number, and you will be better positioned when a weak quarter arrives.
Before you commit capital, weigh three things:
- Whether your available capital sits in the $30,000-$33,000 range, or whether a partial investment with proportionally reduced income is your realistic starting point.
- Whether you can tolerate quarterly income variability tied to bank and commodity cycles.
- Whether VAS as a standalone income vehicle, or as the domestic component of a blended portfolio, better matches your goals.
At an MER of just 0.07%, the cost of holding VAS is not the question. The question is whether it is the right income engine for your specific portfolio, or whether you need to pair it with global exposure to balance the very concentration that creates the yield.
Income investing structures beyond the ETF wrapper, including listed investment companies (LICs) and direct share ownership, each handle franking credits, income smoothing, and management costs differently, and the choice between them becomes increasingly material as portfolio size and super phase transitions approach.
This article is for informational purposes only and should not be considered financial advice. Investors should conduct their own research and consult with financial professionals before making investment decisions. Past performance does not guarantee future results, and yield figures reflect a specific trailing period and are subject to market conditions and various risk factors.