Leverage is supposed to be for traders. That is the received wisdom: borrow to amplify your bets, hold for days or weeks, and get out before the maths turns against you. Most financial education treats leveraged ETFs as a fast-twitch instrument that quietly destroys anyone who holds them too long.
The trouble is that a growing body of product data and academic research tells a more complicated story. A new generation of moderately leveraged index funds, geared at 1.5x to 2x rather than the notorious 3x, has emerged with cost structures and rebalancing mechanics that behave very differently over a decade or more. For patient investors in broad global indices, the evidence suggests these products may not deserve the blanket condemnation.
This question has become live because the product category itself has changed. In Australia, ASIC’s Regulatory Guide RG 282, published on 7 November 2025, has formalised these instruments, drawing a sharp line between the daily-reset structures that earned leveraged ETFs their reputation and the range-rebalancing funds now reaching long-term investors.
After reading this, you will know whether a moderately leveraged index ETF belongs in your specific portfolio, what conditions it needs to work, and how to size and position it if you decide to proceed. Treat this as a decision tool, not a summary.
Why most of what you know about leveraged ETFs is about the wrong product
Your scepticism is well founded. The horror stories are real, and the maths behind them is genuine. Investors who bought triple-leveraged funds and held them through choppy markets watched their capital erode even when the underlying index went nowhere.
Here is the catch: almost all of that accurate knowledge is about a product that behaves nothing like the one under discussion here. The funds responsible for most retail wreckage are 3x daily-reset ETFs, which reset their leverage to a fixed multiple every single trading day. The moderate-leverage index funds now available for long-term holding, geared at 1.5x to 2x, use a fundamentally different mechanism.
The daily reset mechanism rebalances a 3x fund’s positions every evening to restore its fixed multiple, which is why path dependency means two investors starting and ending at the same index level can achieve materially different returns depending on the sequence of daily moves between those points.
Instead of snapping back to a fixed multiple each day, these newer products target a leverage range and only rebalance when the exposure drifts outside that range. That single design change reduces the mechanical drag that makes daily-reset products so hostile to long-term holders. Take GGBL, the BetaShares Wealth Builder Global Shares Geared ETF, as a concrete example: as at early September 2026 it carried a gearing multiple of 1.51x and a loan-to-value ratio (LVR) of 33.6%. That means roughly a third of the fund’s exposure is funded by debt.
For many investors, that is a level of structural borrowing they already accept elsewhere. Owning an investment property with a 33% LVR is leverage most people consider reasonable, even prudent. The mechanics of a moderately geared index fund are closer to that than to a day-trader’s plaything.
The regulatory framework now reflects this distinction. ASIC’s RG 282 permits leveraged products with a defined target range that reset only on deviation, while treating strict daily-reset structures differently.
ASIC’s RG 282 on exchange-traded products draws a formal distinction between daily-reset structures and range-rebalancing funds, permitting the latter for retail access under a ‘Complex ETF’ or ‘Complex Structured’ label while excluding the highest-risk daily-reset mechanics from the Australian market entirely.
ASIC RG 282 (November 2025): Leveraged or inverse ETPs with daily resets are not currently permitted in the Australian framework. Products with a defined target range of leveraged performance may be considered, provided they are clearly labelled “Complex ETF” or “Complex Structured”.
| Feature | 3x daily-reset ETF | 1.5x-2x range-rebalancing ETF |
|---|---|---|
| Leverage multiple | Fixed 3x every day | Target range around 1.5x-2x |
| Rebalancing trigger | Daily reset | Only when exposure drifts outside target range |
| Typical management fee | 0.75%-1.00% | Around 0.35% |
| Annual volatility drag | High (roughly 3x the 2x level) | Materially lower |
| Primary use case | Short-term trading | Long-term accumulation |
The point is not semantic. The risk profiles of these two products are separated by an order of magnitude in volatility drag. Conflating them is the single most common error in retail reasoning about this category, and correcting it is the precondition for any honest assessment of whether moderate leverage belongs in your portfolio.
When big ASX news breaks, our subscribers know first
The mathematics of volatility decay and why the leverage multiple is the key variable
Start with a simple observation about how any leveraged fund behaves in a jumpy market. When prices swing up and down without going anywhere, a fund that rebalances to maintain its leverage is forced to buy after gains and sell after losses. Do that repeatedly and you bleed value, even if the index finishes exactly where it started.
This effect is called volatility decay, sometimes beta decay. It is the central mechanical reason leveraged ETFs underperform their stated multiple in choppy, directionless conditions. And it does not grow in a straight line with leverage.
The formal approximation is worth understanding because it explains everything that follows. Annual decay is roughly equal to L(L-1) multiplied by the variance of daily returns (sigma squared), multiplied by 252, divided by 2, where L is the leverage factor and sigma is the daily standard deviation of index returns.
Notice the L(L-1) term. Decay grows with the square of the leverage factor, which means the gap between a 2x fund and a 3x fund is far larger than the gap between a 1x fund and a 2x fund. That is the whole game.
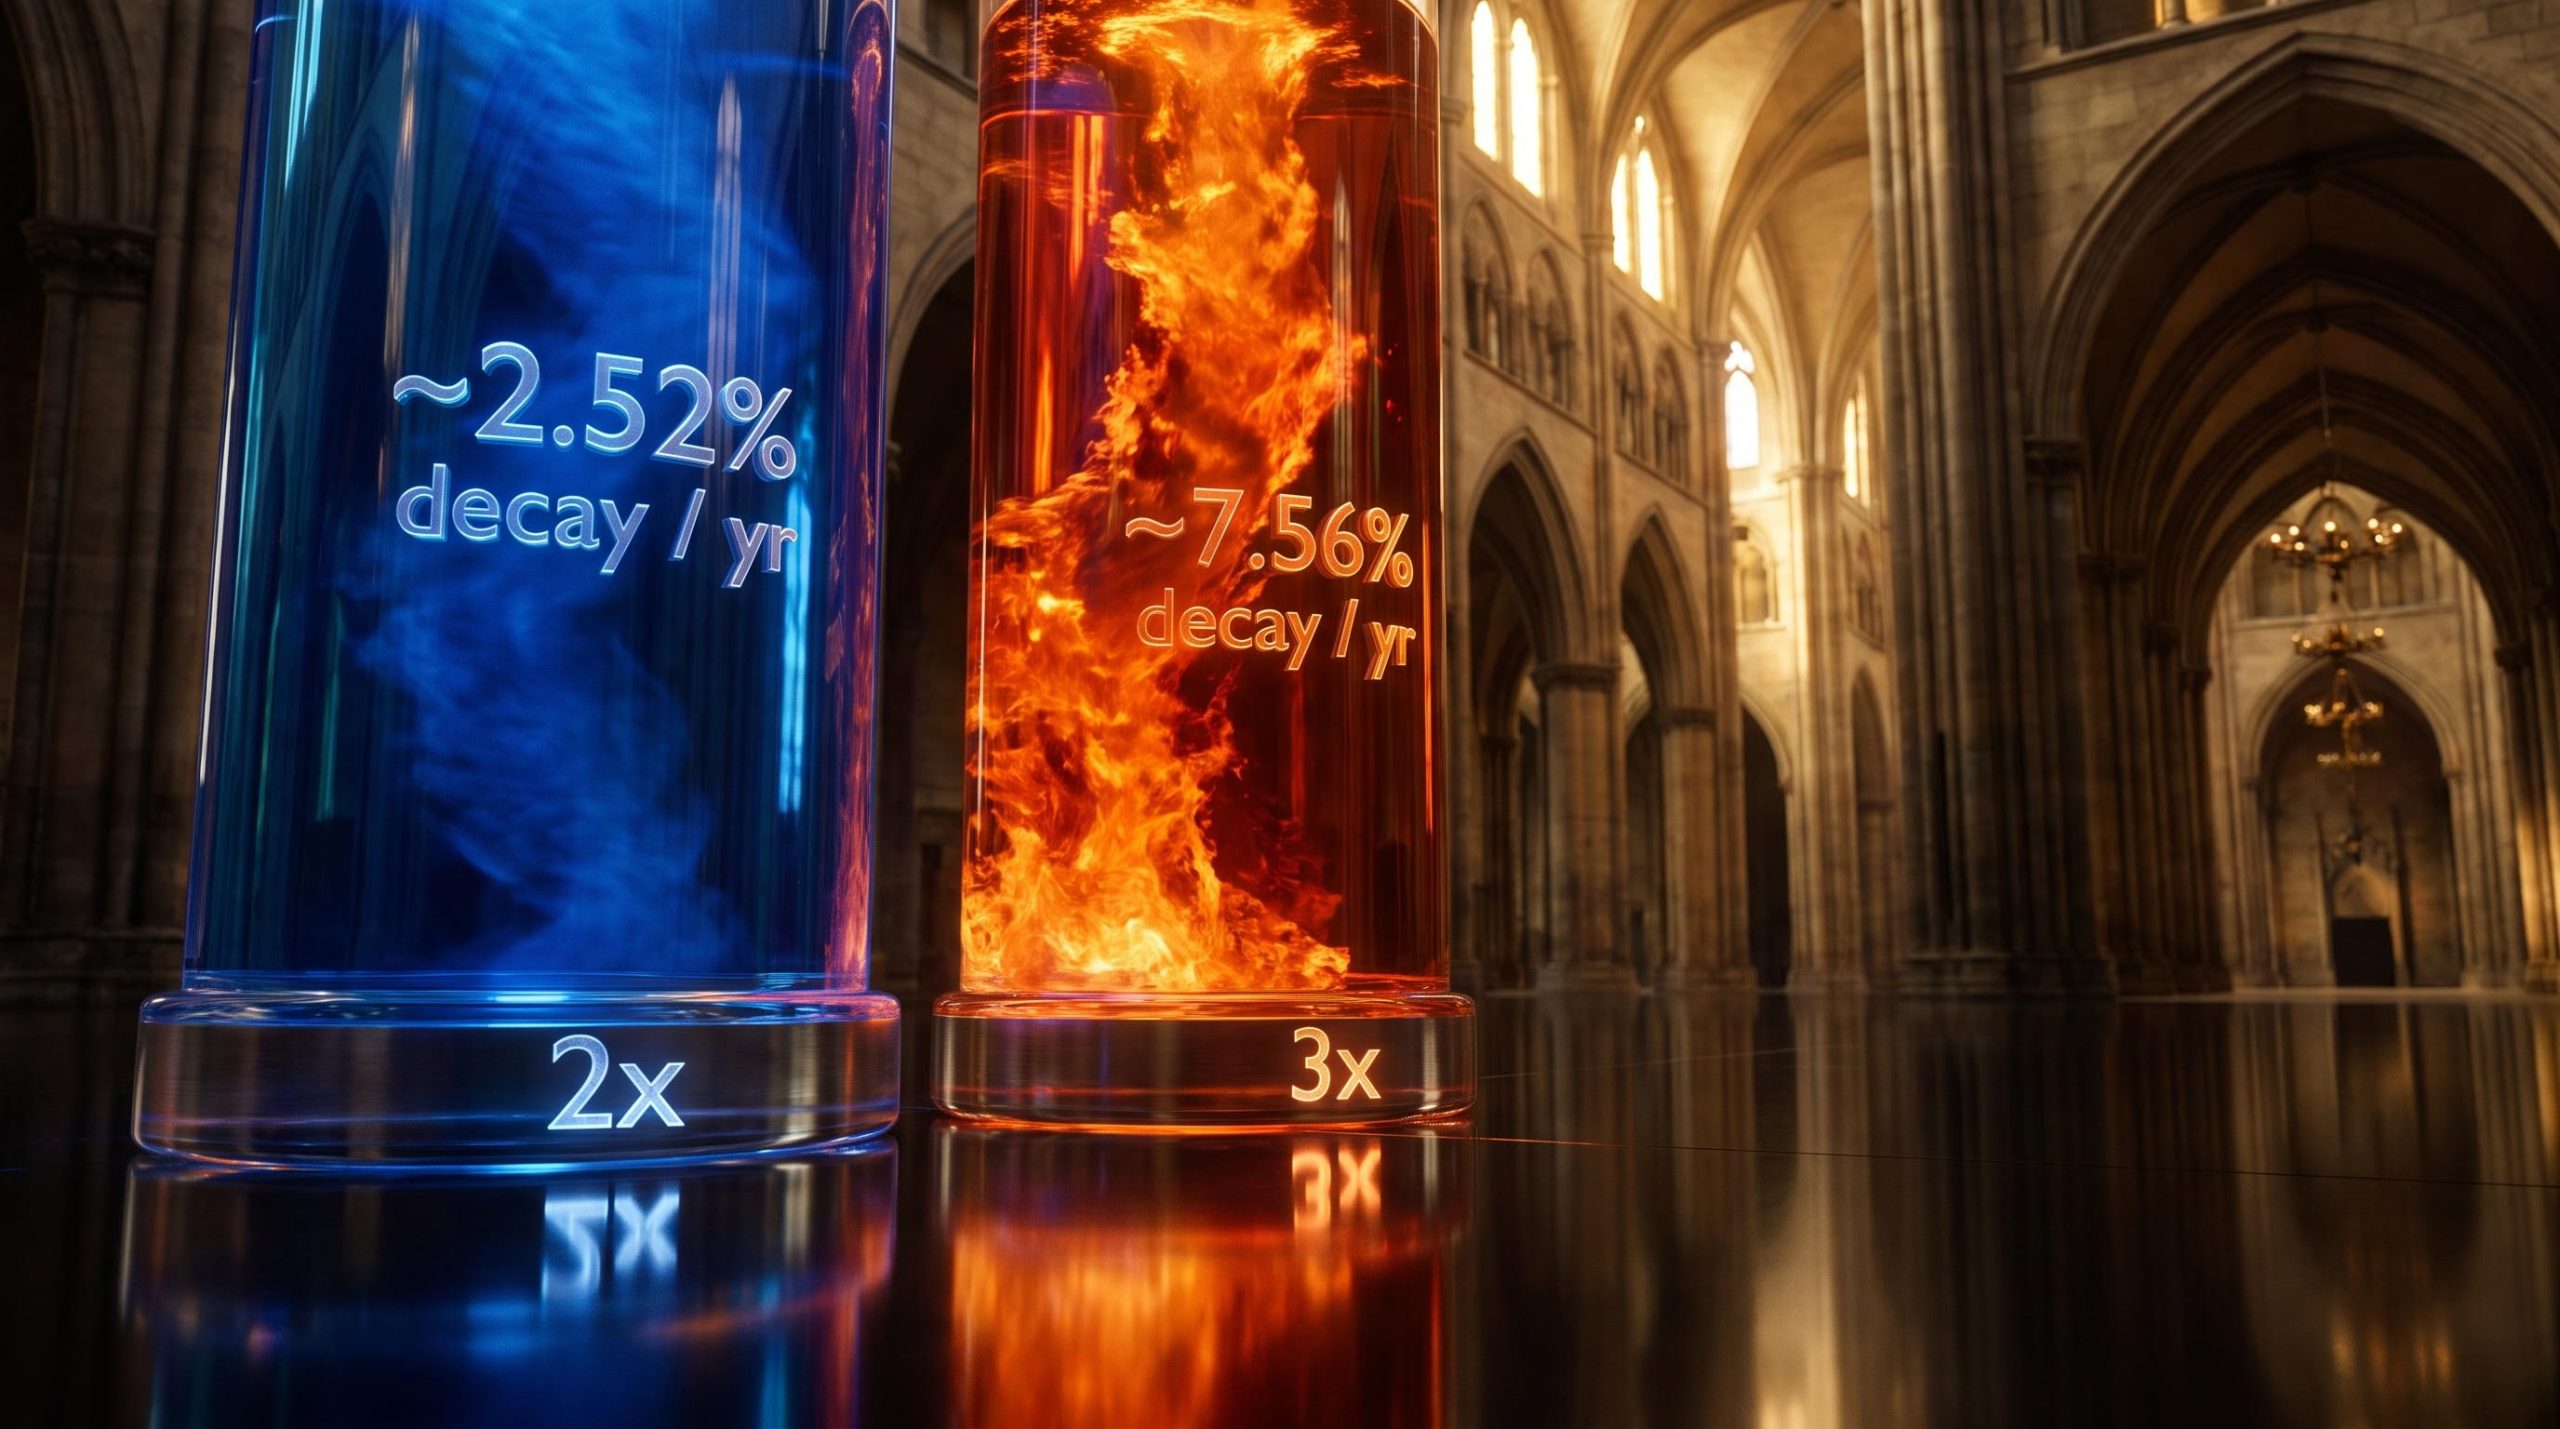
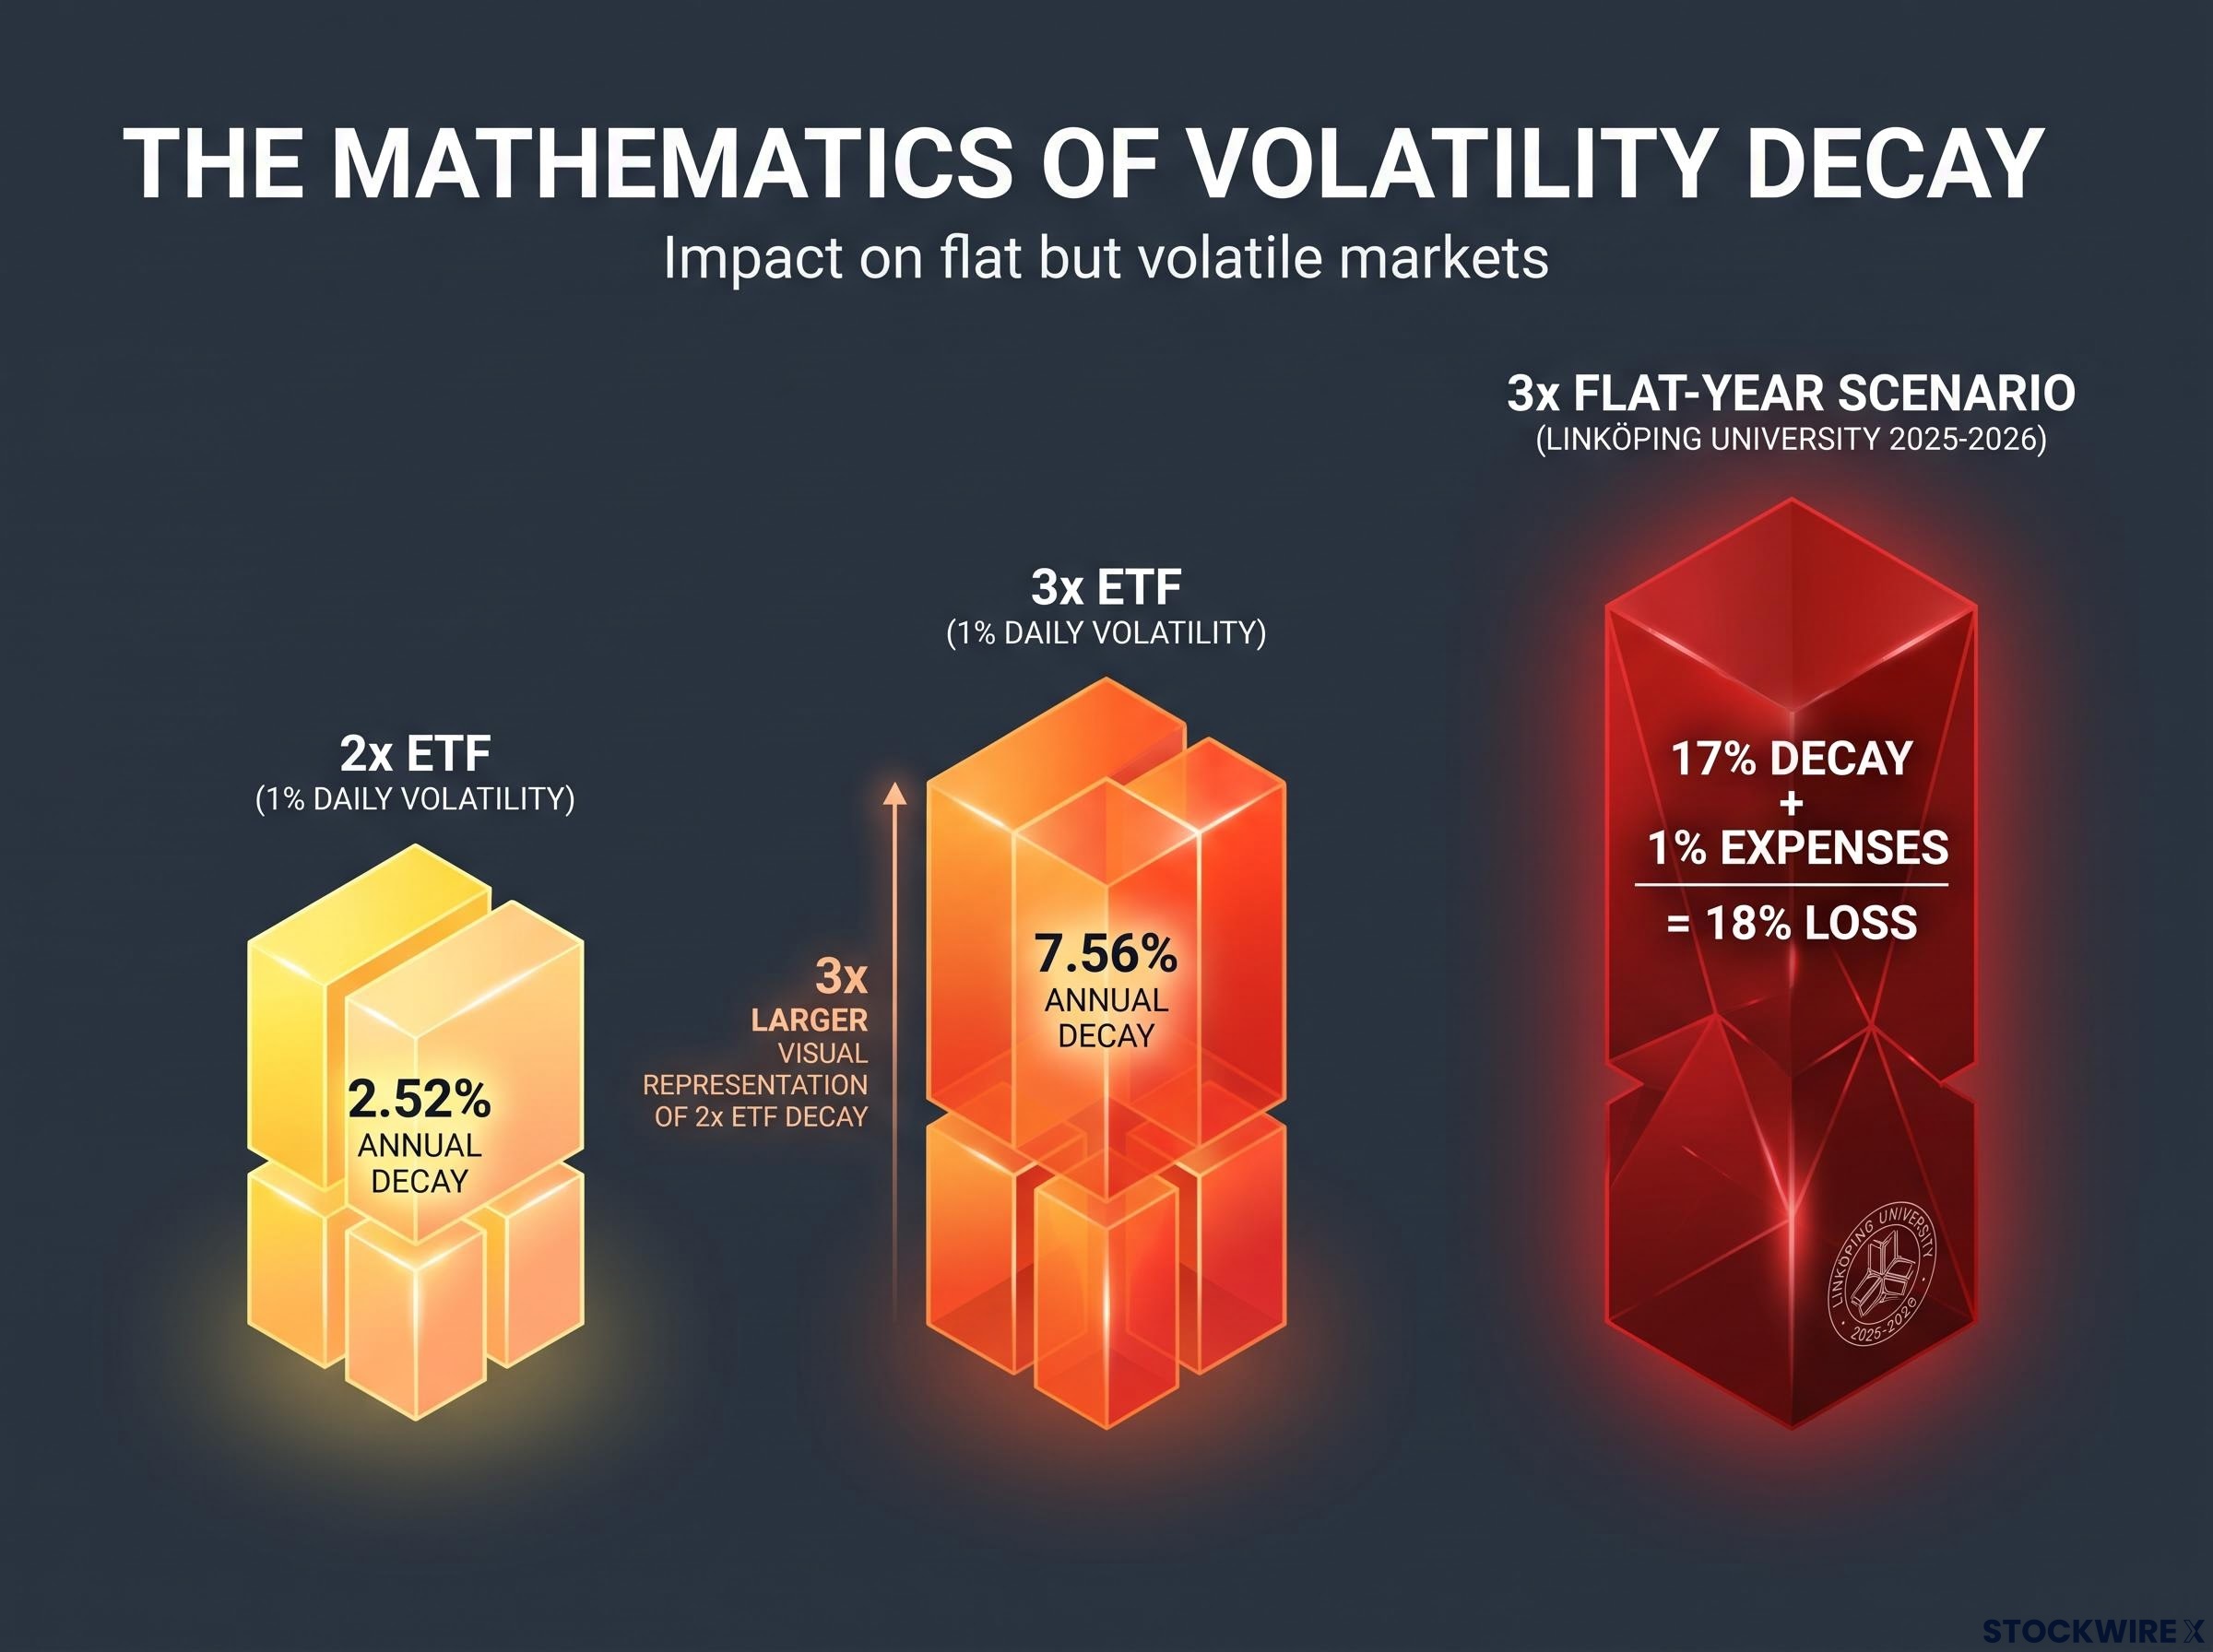
Put numbers to it. A 2x ETF with 1% daily volatility suffers roughly 2.52% decay per year. A 3x ETF under identical conditions suffers roughly 7.56% per year. That is three times the drag for a single unit of extra leverage, from the exact same market.
Academic work from Linköping University (2025-2026) confirms the shape of this relationship: in directionless markets, annual drag at 2x is roughly proportional to the variance of daily returns, whereas at 3x it approaches three times that variance. The same volatility punishes a 3x fund about three times as hard.
The flat-year scenario: A 3x leveraged ETF in a zero-return, high-volatility year showed roughly 17% decay plus about 1% in expenses, producing an approximate 18% loss despite the index finishing completely unchanged.
The read for you is direct. Choosing a 1.5x fund over a 3x fund is not a more cautious version of the same bet. It is a structurally different bet, because the drag has nearly tripled from the same conditions.
What the decay formula looks like in practice across market conditions
The formula behaves very differently depending on how the market moves over your holding period.
- Trending up: In a market that rises steadily with relatively low volatility, daily compounding can actually push a leveraged fund to outperform its stated multiple. A 2x fund can beat twice the index return, and a 3x fund can beat three times, because gains compound on gains. This is where leverage genuinely shines.
- Flat but volatile: In a market that swings hard but ends where it began, decay dominates. The 2x fund gives back a couple of per cent; the 3x fund can lose close to a fifth of its value on a flat index, as the worked example shows.
- Trending down or mean-reverting: In falling or whipsawing markets, leverage amplifies losses and decay compounds the damage, requiring far larger subsequent gains just to recover.
Trend persistence is the variable that decides whether leverage helps or hurts. Understanding this formula gives you a durable mental model for evaluating any leveraged product you ever encounter, not just the ones named here.
What the real-world performance record shows across different holding periods
Look at the numbers before reaching for an interpretation. GGBL’s net returns after fees, measured against the MSCI World ex-Australia index (AUD) as at early September 2026, tell a consistent recent story.
| Period | GGBL (net) | MSCI World ex-Australia (AUD) |
|---|---|---|
| 1-month | 0.72% | 0.53% |
| 3-month | 3.56% | 2.74% |
| 6-month | 13.32% | 9.36% |
| Since inception (annualised) | 8.92% | 7.28% |
| 2024 calendar year | 31.18% | 23.23% |
The 2024 calendar year captures the upside cleanly: 31.18% for GGBL against 23.23% for the index. In a strong trending year, moderate leverage did exactly what it is designed to do.
Now the counter-example. The 3x semiconductor fund SOXL has consistently underperformed its 2x counterpart over 6-month, 1-year, and 5-year horizons, a reminder that piling on leverage does not reliably compound into higher returns over time.
Here is the risk you cannot design away: sequence-of-returns risk. A large drawdown early in your holding period requires a proportionally larger subsequent gain just to recover, and leverage magnifies both the drop and the required rebound. That asymmetry is the core danger for long-term holders of any geared product.
Sequence-of-returns risk is not theoretical: South Korean retail investors lost more than 80% of their capital in six weeks holding single-stock leveraged products tied to Samsung and SK Hynix, a concentrated demonstration of what happens when a large drawdown lands early in a leveraged position held without defined exit discipline.
This is where your specific situation matters. An investor who can absorb several full market cycles, with a horizon of roughly 10 to 30 years, has time for the trending periods to outweigh the flat ones. An investor five to ten years from a major spending goal does not, and for them sequence risk becomes acutely dangerous.
The conditions under which leverage historically adds value versus destroys it are worth stating plainly:
- Adds value: Sustained upward trends, moderate volatility, long holding periods that span multiple cycles.
- Destroys value: Flat but volatile markets, prolonged declines, and any period where a large drawdown lands early in your timeline.
GGBL’s since-inception outperformance of 8.92% against 7.28% is real and meaningful. It has also been earned across a largely trending global equity market. The genuine test of this record will be the next sustained volatile or declining stretch, and your decision should reflect that possibility rather than extrapolating from a favourable run.
How to think about fees, financing costs, and the true cost of leverage
The headline fee is where most investors stop looking, and it is exactly the wrong place to stop. GGBL charges a management fee of 0.35% per annum. Against traditional leveraged equity ETFs charging 0.75% to 1.00%, that looks genuinely competitive, and it is.
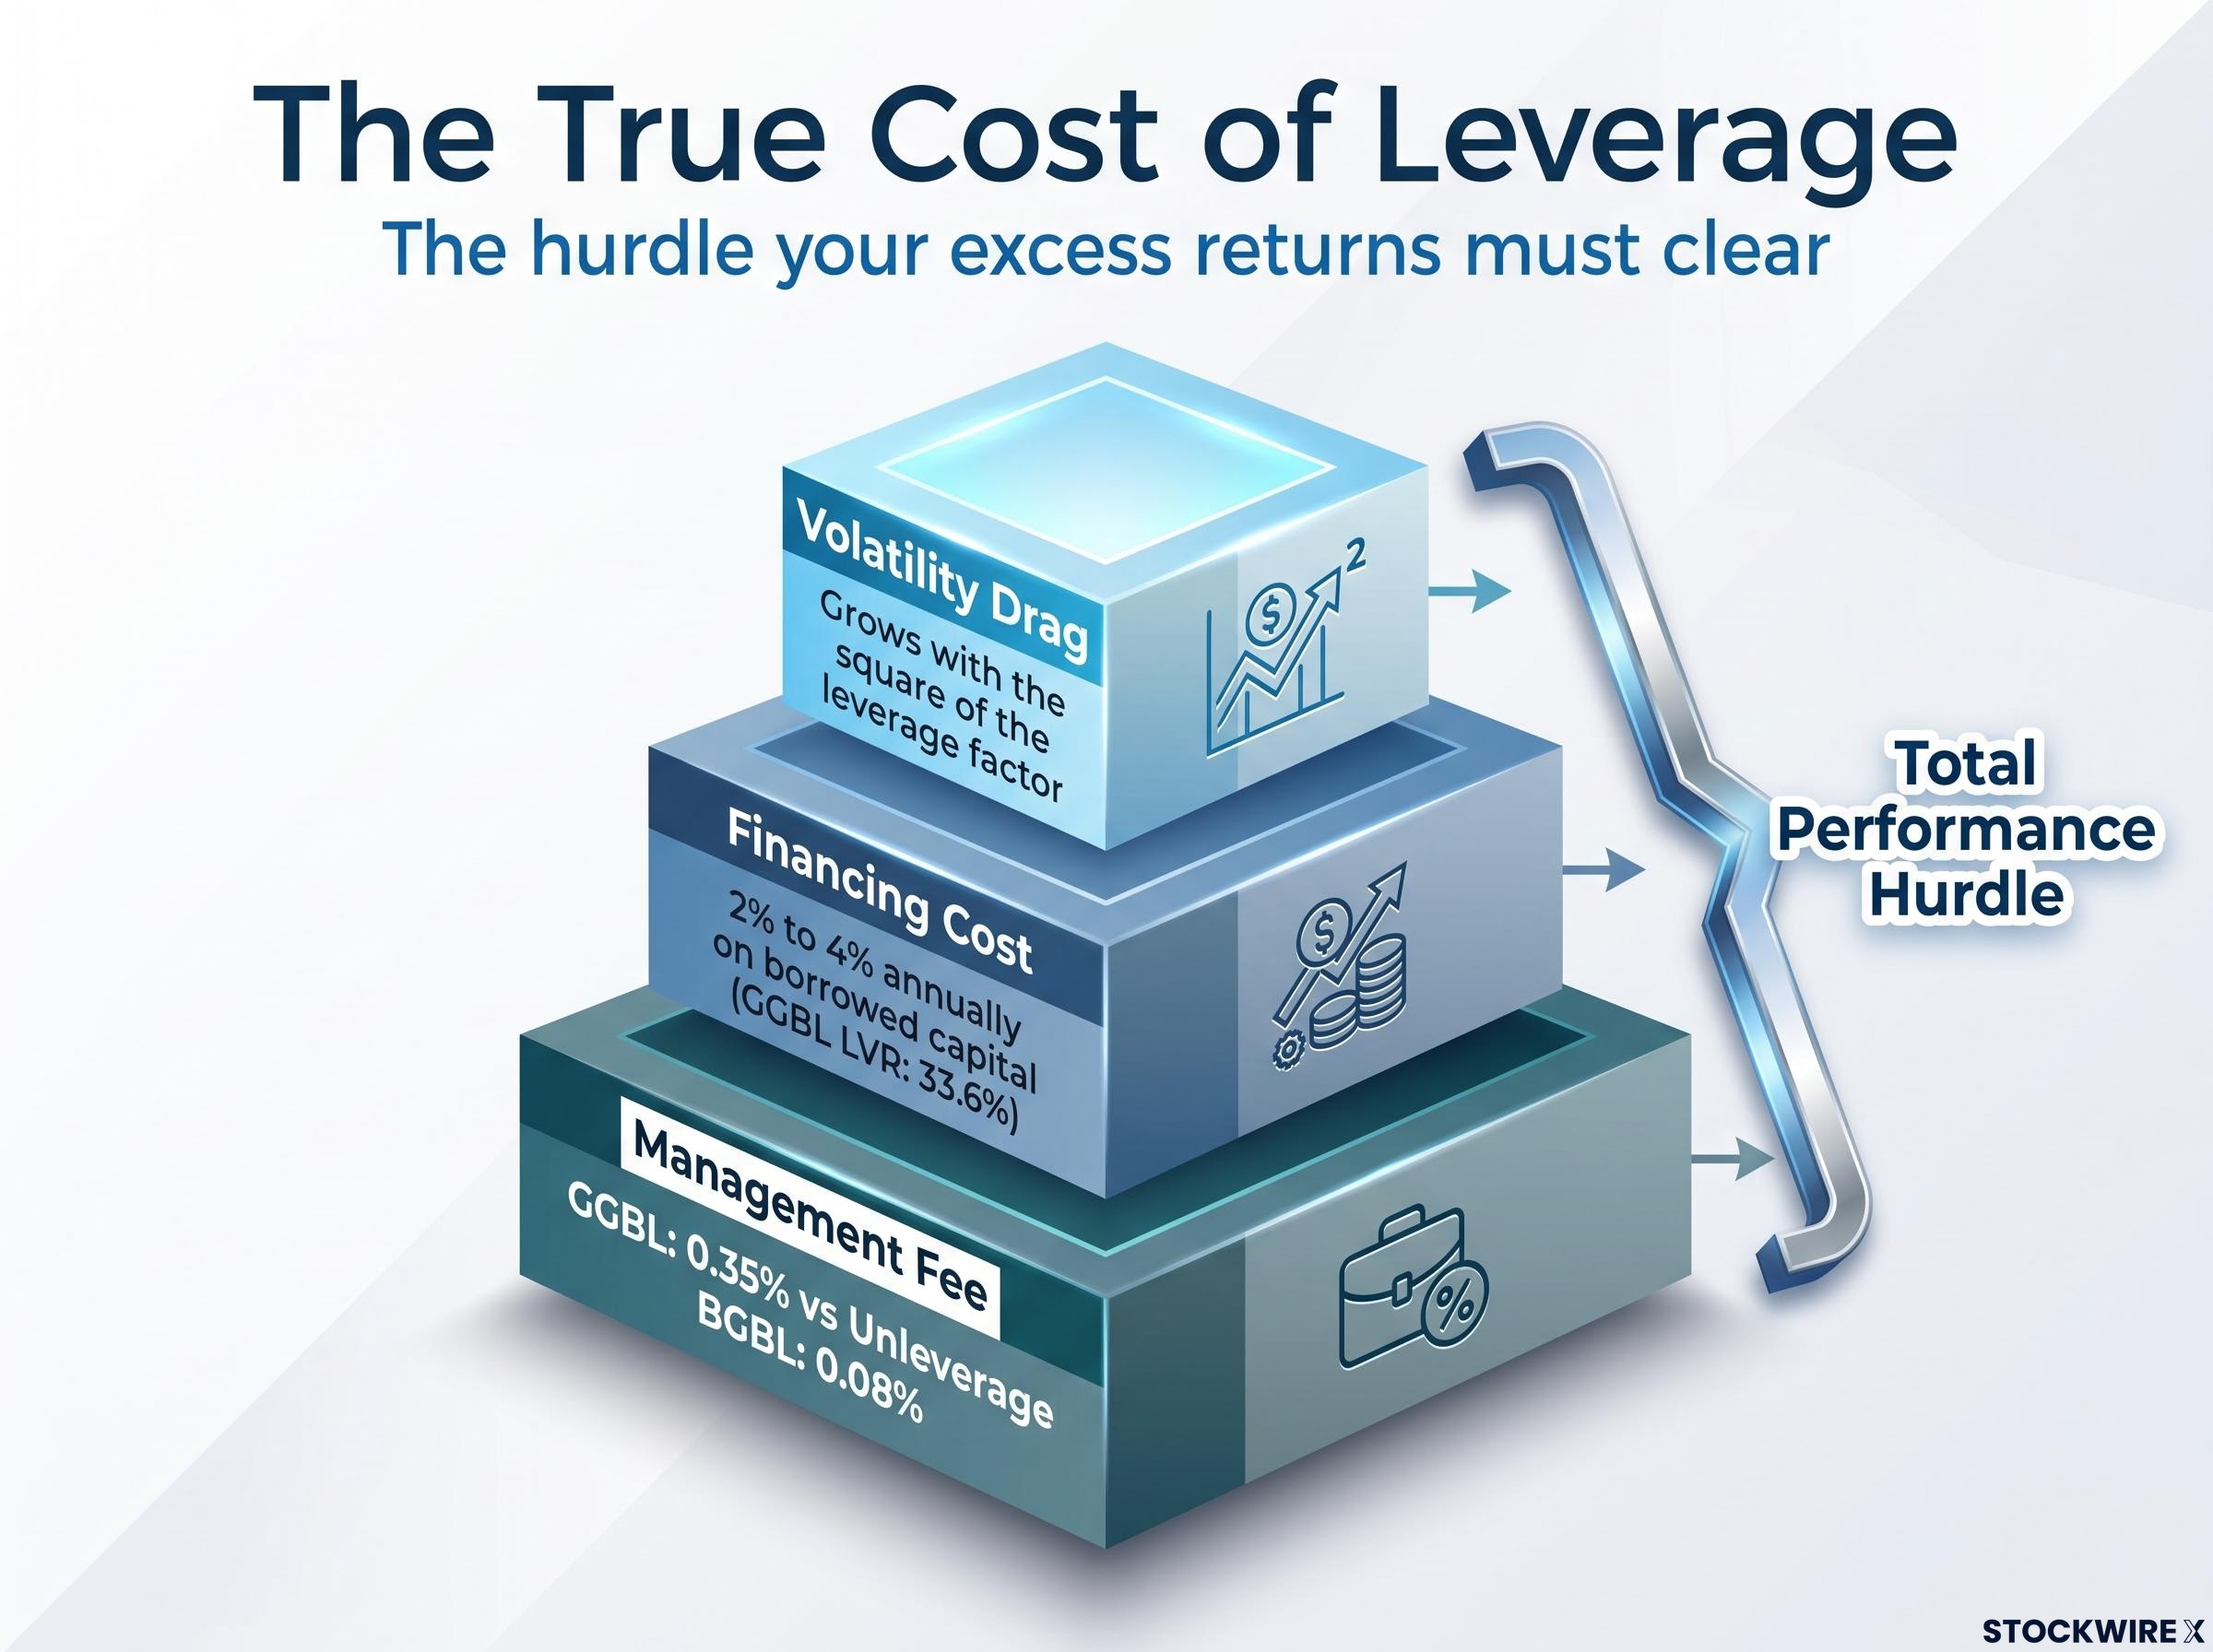
But the management fee is only one layer of what you actually pay. Leverage carries three distinct costs, and the headline fee is the smallest and most visible of them.
- Management fee: The stated annual charge, 0.35% for GGBL versus 0.08% for its unleveraged counterpart BGBL.
- Financing cost on borrowed capital: The interest paid on the debt used to gear the fund, estimated at roughly 2% to 4% annually on the leveraged portion. At a 33.6% LVR, that is a material embedded cost on total exposure.
- Volatility drag: The mathematical decay covered earlier, which grows with the square of the leverage factor.
Stack those together and you get the true hurdle. The leveraged excess return has to clear the management fee, plus the financing cost, plus the drag, before you are actually ahead of the cheaper unleveraged fund. Choosing a geared ETF because its headline fee looks low is a category error.
Calculating the return hurdle before committing to leverage
Work through the logic with rough numbers. Suppose the unleveraged fund is expected to return 7% a year. At a 1.5x gearing, the leveraged fund needs to generate meaningfully more than 10.5% on a naive multiple basis, because it also has to absorb the financing cost on the borrowed third and the volatility drag.
If financing runs at, say, 3% on the geared portion and drag takes another chunk in a volatile year, the real hurdle sits well above the naive figure. Only if the expected leveraged return clears that combined stack does the position create value for you.
The critical point is that this hurdle moves. The financing cost is tied to prevailing interest rates, so a higher-rate environment lifts the bar the leveraged return must clear. This is not a one-time calculation. Revisit it as rates shift rather than treating your original decision as permanent.
Portfolio construction for long-term investors: sizing, positioning, and when to phase out
Analysis only matters if it translates into where the position actually sits in your portfolio. There is no single correct architecture here, and the two credible schools of thought are worth holding side by side.
The practitioner view treats a leveraged index ETF as a carefully sized satellite: a deliberate, bounded tilt around a larger unleveraged core, not the core itself. The academic blended-core model, outlined in the Financial Services Review, takes a different route: allocate around 50% to 2x leveraged ETFs (or 33% to 3x products) and hold the remainder in Treasuries or bond ladders, pairing geared equity with defensive assets to target an effective overall leverage of roughly 1.2x to 1.5x on global equities. Both are defensible; neither is the obvious winner.
What both frameworks demand is that you understand your overlap risk. Holding both a leveraged and an unleveraged version of the same index does not diversify you. It simply changes your effective leverage, because the two funds track the same underlying. GGBL, for instance, holds BGBL as its underlying, giving it around 73% to 74% exposure to US equities before you add anything else.
That concentration is the trap. Stacking a leveraged Nasdaq fund on top of a leveraged global fund does not spread your bet; it doubles down on the same correlated exposure and inflates drawdown risk during a systemic shock.
Before adding any leveraged index ETF to a long-term portfolio, four conditions should genuinely be present:
- A long time horizon, roughly 10 to 30 years, enough to span multiple full market cycles.
- A return target that actually requires leverage, not one you could reach with standard funds.
- Genuine drawdown tolerance, the psychological capacity to hold through multi-year losses without panic-selling.
- A pre-committed de-risking plan for as retirement approaches.
Correlated combinations to keep out of the same portfolio include:
- A leveraged global equity ETF paired with a leveraged Nasdaq ETF (heavily overlapping US mega-cap exposure).
- Multiple leveraged products tracking indices that move together during systemic events.
The capital hierarchy principle underlines the sizing discipline. Core contributions should dwarf satellite ones; a model that directs the bulk of monthly contributions to the core and only a small slice to satellite positions reflects where the real wealth-building work happens.
The core-satellite framework sets the sizing discipline that makes leveraged positions manageable: the satellite allocation should be bounded so that a total loss in the geared holding cannot materially damage the overall portfolio trajectory, a ceiling that forces the capital hierarchy logic to be applied before the position is opened rather than after a drawdown.
When to phase out leverage as your timeline shortens
The case for leverage weakens precisely as you approach the goal you were saving for. Once your required return becomes achievable without gearing, the extra risk buys you nothing while sequence risk turns acutely dangerous.
The consolidation move is to shift from leveraged toward unleveraged core holdings as major spending goals near. If you built the position when it was small, mind the capital gains tax timing, since unwinding a large geared holding all at once can trigger a meaningful liability.
This de-risking decision is not binary. Partial reductions in the leveraged allocation let you engineer a gradual glide path rather than a single abrupt exit, smoothing both the risk profile and the tax consequences.
Making the call on moderate leverage in your long-term portfolio
Pull the threads together and the decision comes down to whether you fit a fairly specific profile. The case for moderate leverage in a long-term index fund rests on four established points: it is mathematically distinct from the 3x products that earned the category its reputation, its real-world record in trending markets is genuinely strong, its full cost stack is knowable and can be modelled against expected returns, and it can be positioned defensibly as a sized satellite or a blended-core component.
The case for moderate leverage holds when:
- Your horizon is genuinely 10 to 30 years, with room to ride out multiple cycles.
- Your target return actually requires leverage to reach.
- You can hold through multi-year drawdowns without selling in panic.
- You have a pre-committed plan to de-risk as your goal approaches.
The case falls apart when:
- Your time horizon is too short to absorb a bad sequence early.
- Your return target is achievable without gearing at all.
- You are close to retirement or focused on generating income.
- Interest rates are high, inflating the financing cost hurdle.
If your required return is achievable without leverage, you are taking on structural risk without a structural return reason. Research indicates an investor targeting roughly 7% annual returns may not need leveraged ETFs at all, since standard products can often reach that target with lower risk.
The regulatory dimension acts as a practical filter. In Australia, ASIC’s RG 282 has already removed the highest-risk daily-reset structures from retail access, so the product landscape has done some of the vetting for you. At the time of writing, no equivalent post-2024 restrictions have been identified from the US SEC, UK FCA, or ESMA, so investors in those jurisdictions carry more of the filtering burden themselves.
The two errors to avoid are mirror images: reflexively rejecting moderate leverage because of the 3x product reputation, and uncritically adopting it because of a strong recent run in favourable conditions. Sit yourself against the two lists above, and the answer should feel personal rather than generic.
For investors wanting to understand the market-wide implications of the category’s growth, our full explainer on geared ETF systemic risk examines how daily rebalancing mechanics across nearly $200 billion in US geared ETF assets can amplify selloffs for every market participant, not just those holding leveraged products.
This article is for informational purposes only and should not be considered financial advice. Investors should conduct their own research and consult with financial professionals before making investment decisions.
Past performance does not guarantee future results. Financial projections are subject to market conditions and various risk factors. Simplifications have been made to the underlying mathematics for readability.