
Here is a company that grew revenue 53% year over year, expanded margins toward the top of its industry, and posted operating margins near 78%. Its stock has lost more than half its value in a single year.
That contradiction sits at the centre of the AppLovin valuation question right now, and it is not one you can resolve with a headline about a big percentage drop.
The 52% year-to-date decline has pushed AppLovin’s valuation metrics back to roughly where they sat in mid-2024. The trouble is that mid-2024 was never universally considered cheap. So the real question is whether this is a genuine discount or simply a narrative powered by the sheer size of the fall.
After working through the valuation lenses below, you will know which metrics support the bull case, which ones complicate it, and exactly what the e-commerce expansion has to deliver for today’s price to look smart in hindsight.
Why a stock drops 52% when the business grows 53%
The catalyst was Q2 2026 earnings, released 5 August 2026. On the surface, the quarter was strong.
Here is the snapshot investors received:
- Revenue of $1.92 billion, up 53% year over year and 4% sequentially
- Diluted EPS of $3.76, narrowly ahead of the roughly $3.75 consensus
- Adjusted EBITDA of $1.61 billion, up 58% year over year
- Margin expansion of approximately 300 basis points
Read that list and you would expect the stock to hold, or climb. Instead it dropped sharply. The reason sits in a single line item: revenue came in at $1.92 billion against a $1.94 billion consensus, a miss of roughly 0.94%, and it landed just below the guidance midpoint.
Less than a percent. By most standards, a rounding error. Yet the market treated it as something far larger, and the explanation for why is a matter of history rather than mathematics.
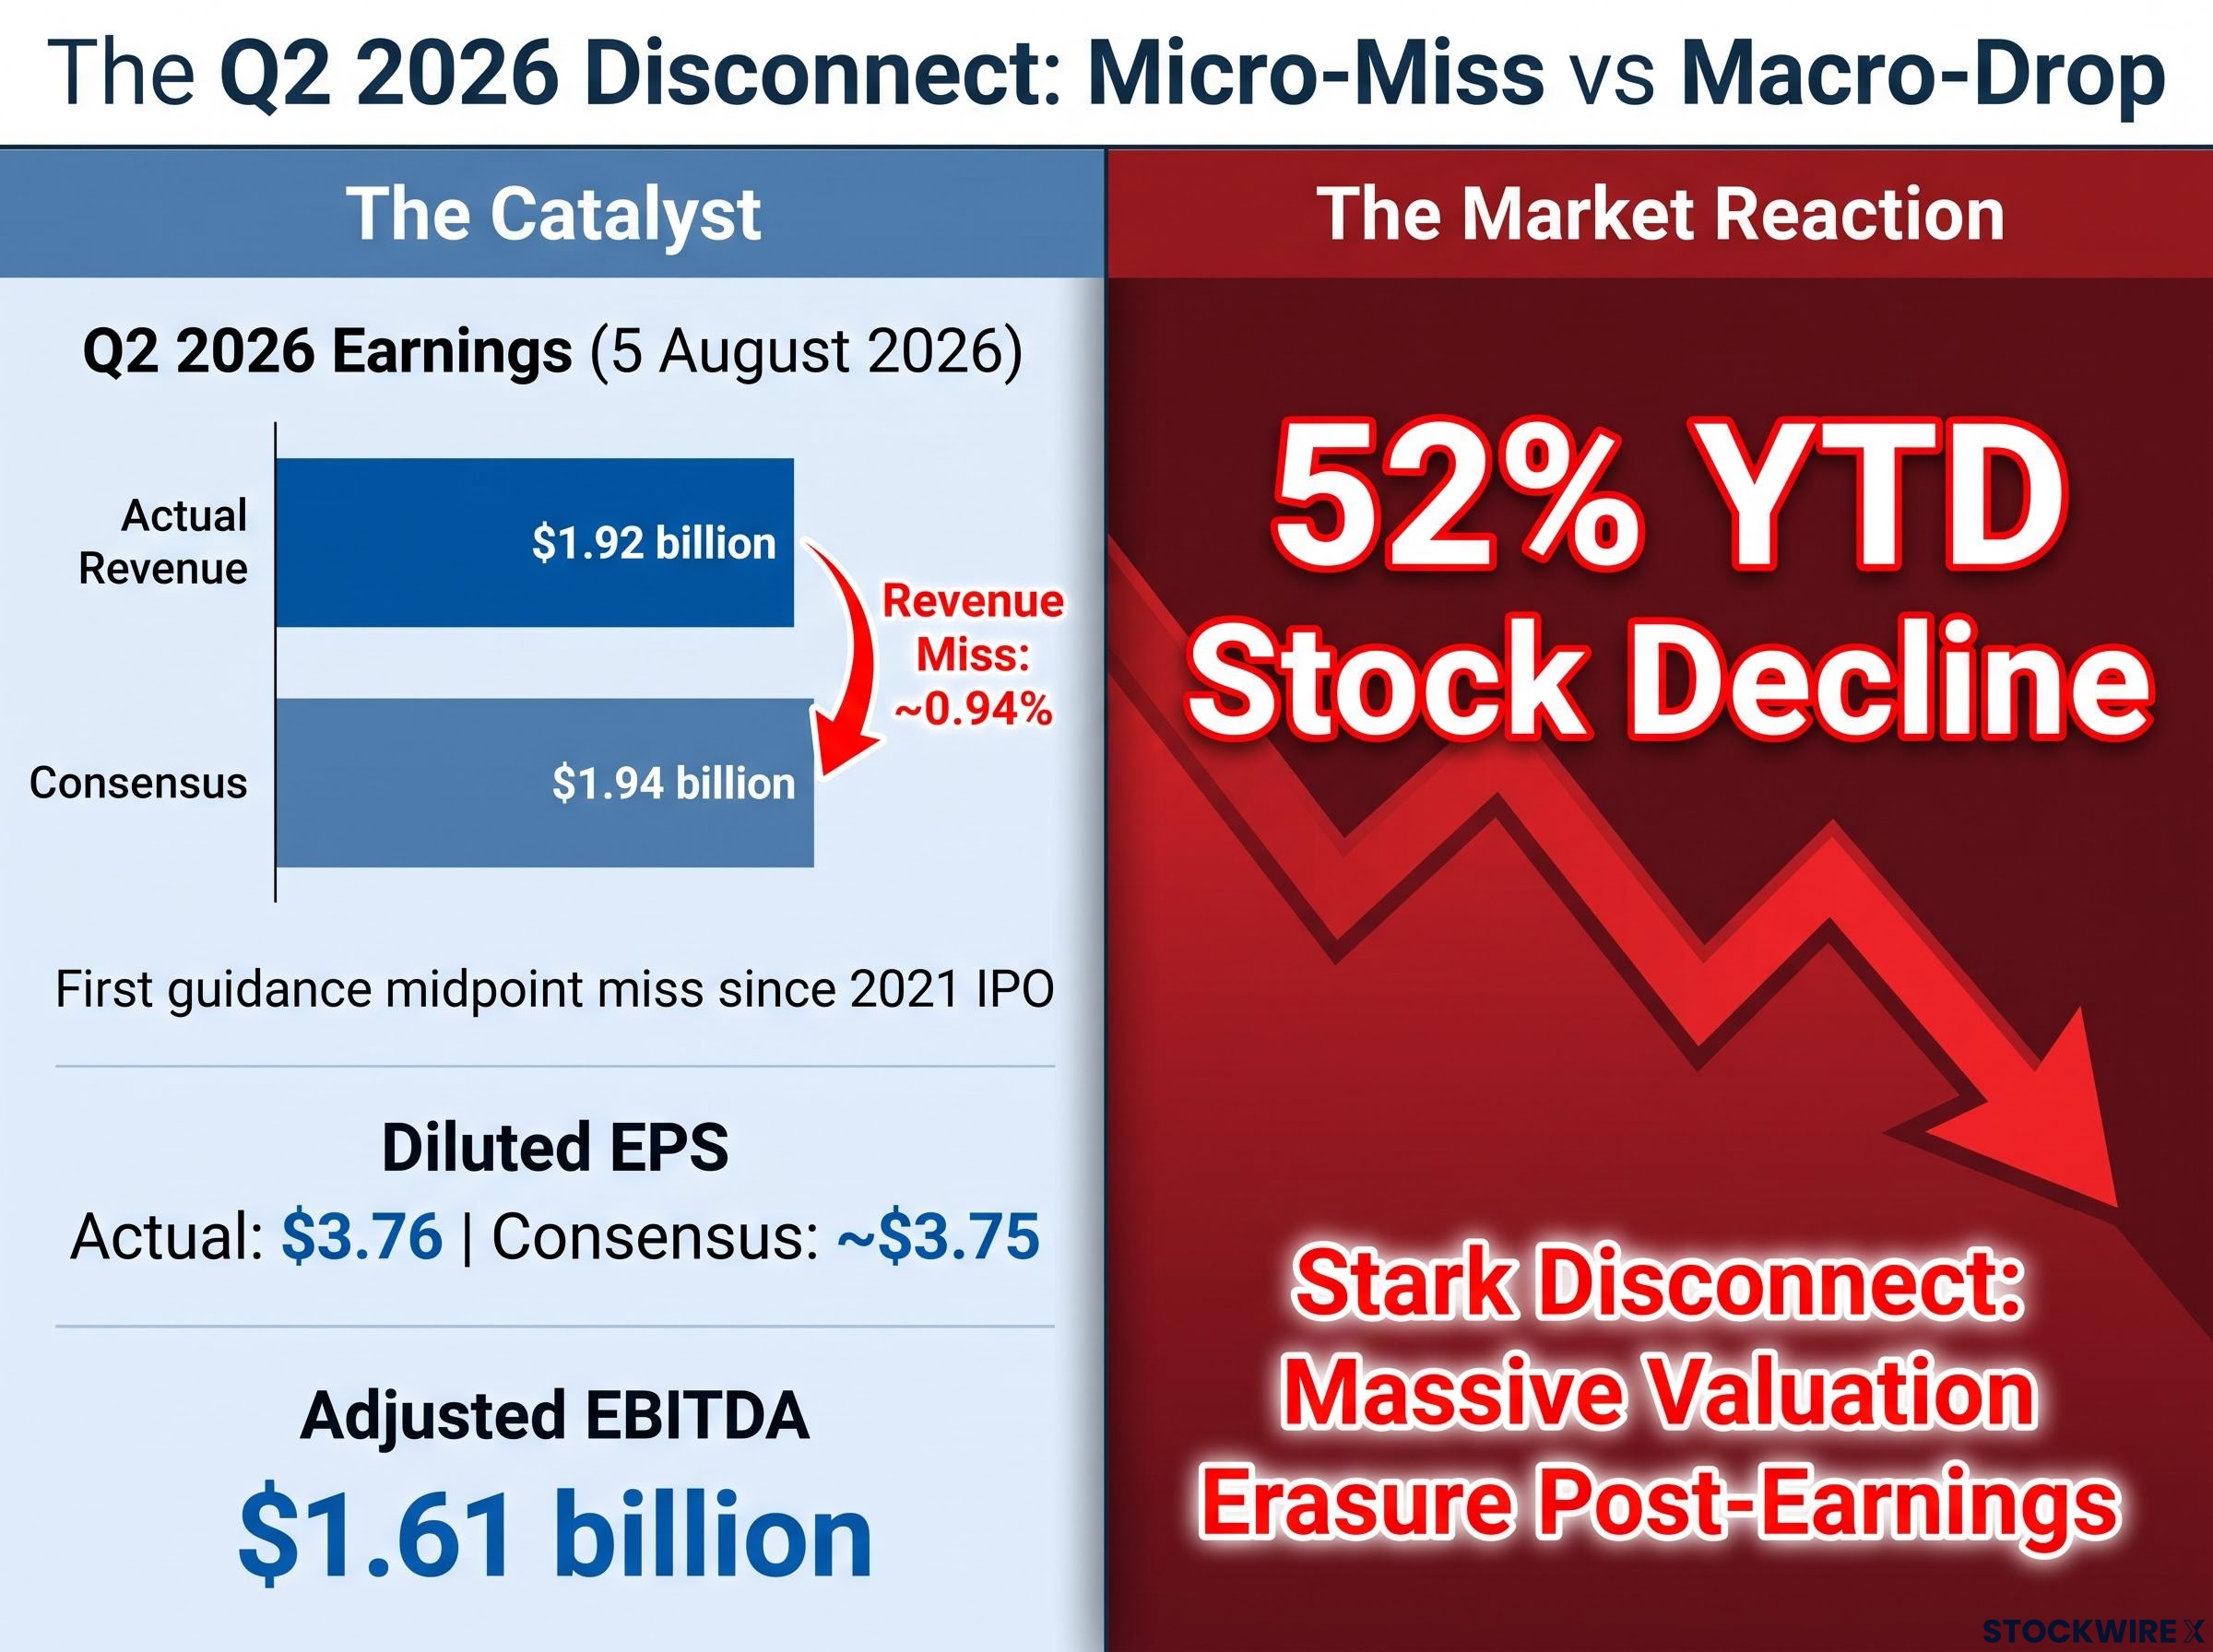
This was AppLovin’s first guidance midpoint miss since its 2021 IPO.
That fact carries most of the explanatory weight. For nearly five years, the company had never missed the middle of its own guidance. Investors had priced in a near-perfect execution record, and the first crack in that record forced a rethink of the assumptions baked into the multiple.
Now hold the two numbers next to each other. A sub-1% revenue miss. A 52% year-to-date share price decline, with the stock also down roughly 36% over the trailing twelve months. No reasonable model of a single quarter’s shortfall bridges that gap.
What that mismatch tells you is important. The market was not punishing the quarter’s results. It was repricing the entire growth narrative, moving AppLovin from a hyper-growth multiple toward a durable-growth multiple.
That distinction matters before you evaluate the current price. If the sell-off reflects a valuation reset rather than a signal that the business is breaking, the framework for judging today’s entry point changes entirely. Understanding the cause is the prerequisite for deciding whether the decline is over.
When big ASX news breaks, our subscribers know first
What three valuation lenses actually say about the current price
Pick up three different valuation lenses and AppLovin looks like three different stocks. The order in which you examine them shapes the conclusion you reach, so it is worth walking through them from least flattering to most.
Start with price-to-sales, the harshest lens. AppLovin’s simple valuation ratio, market capitalisation divided by annualised revenue, sits at approximately 15.7. A broader catalogue of technology stocks averages closer to 8-10. On sales, AppLovin still carries a meaningful premium.
The price-to-sales ratio is a starting signal rather than a verdict; it cannot capture profitability, debt levels, or the quality of earnings underlying a company’s revenue, which is precisely why AppLovin’s 15.7x multiple on sales tells a different story than its forward P/E.
Next, the historical comparison, which reframes the decline. On a price-to-sales basis, today’s valuation broadly aligns with where AppLovin traded in mid-2024. The 52% fall, in other words, represents a normalisation from peak sentiment rather than a descent into genuinely cheap territory.
Then the forward P/E lens, which is the most constructive of the three. On 2026 analyst estimates, AppLovin trades at a forward P/E of roughly 17-19, and lower still on 2027 estimates. The NASDAQ 100 sits at approximately 21-24.
On forward earnings, AppLovin trades at a discount to the NASDAQ 100, despite growing far faster than the index and running operating margins of 75-78%.
That is the counterintuitive part for anyone primed to see AppLovin as expensive. Those margins, among the highest in ad-tech, are also why a premium on sales is at least partially defensible: a dollar of AppLovin revenue converts to profit at a rate few peers can match.
| Valuation metric | AppLovin current | Benchmark / context | What it signals |
|---|---|---|---|
| Price-to-sales (mkt cap ÷ annualised revenue) | ~15.7 | Broader tech average ~8-10 | Premium on sales; not cheap |
| Forward P/E (2026 estimates) | ~17-19 | NASDAQ 100 forward P/E ~21-24 | Discount to the index on earnings |
| Price-to-sales vs history | Aligned with mid-2024 levels | Mid-2024 not seen as cheap | Normalisation, not a bargain |
The share price itself has drifted through this range, from $305.77 on Yahoo Finance on 24 August 2026 to $320.56 on MarketBeat by 4 September 2026.
So which lens should you weight? That choice matters enormously for the decision you reach. On sales, AppLovin looks expensive and has not returned to bargain territory. On earnings, it trades below the NASDAQ 100 with best-in-class margins, which is a meaningfully different signal.
If you anchor to the “52% off” framing without running these numbers, you risk confusing a decline with a discount. The honest picture is genuinely mixed, and that is a more useful starting point for a buy-or-wait decision than any directional headline.
Understanding AppLovin’s business model and why it changes the valuation math
To judge whether that sales premium is defensible, you need to understand how AppLovin actually earns money, and where the growth is supposed to come from next.
At its core, AppLovin runs a performance-based advertising software platform. It does not sell impressions. It gets paid on results, with revenue tied to conversions and return on ad spend. Since selling off its own game studio in 2025, it has operated as a pure-play ad-tech software business.
That software engine was built on mobile gaming, and that is where the valuation math gets interesting. Mobile gaming downloads and revenue have softened since their COVID-era peaks, which puts a structural ceiling on how much growth the existing base can deliver.
This is why the e-commerce expansion is not a nice-to-have. Management has referenced a target of roughly 30% growth through 2030, and hitting that number depends on scaling a new vertical, not squeezing more from a maturing one.
AppLovin’s e-commerce expansion is, at its core, a thematic investing question: the AI ad-optimisation story is compelling, but a thematic investing framework asks whether the addressable market is realistic, the competitive moat is durable, and the valuation already prices in the best case.
The bridge between gaming and commerce is AppLovin’s AI-driven ad optimisation stack, extended from in-app gaming ads into broader consumer verticals. Q3 2026 guidance frames management’s confidence: revenue of $2.055-$2.085 billion, implying 46-48% year-over-year growth, and adjusted EBITDA of $1.71-$1.74 billion, or 48-50% growth. Notably, no single advertiser accounts for more than 10% of total revenues, which limits demand-side concentration risk.
Extending that engine into commerce carries real structural risks worth naming:
- Model portability: AI tuned for high-frequency in-app gaming events may not translate cleanly to lower-frequency, higher-value e-commerce purchases, which could dent return on ad spend
- Competitive intensity: Meta, Google, and Amazon already control shopping intent and purchase data, and AppLovin must prove its off-platform stack delivers incremental performance
- Ecosystem dependency: The mobile ad stack relies on third-party distribution platforms, some of which are direct competitors in the very verticals AppLovin is entering
The e-commerce expansion: what management has said, and what remains unverified
Here is the transparency gap. The CEO has described AppLovin’s e-commerce run rate as “much bigger” than the $1 billion annual figure cited roughly a year earlier. No specific updated number has been disclosed.
For a segment positioned as the primary growth catalyst, that absence is itself a signal. Qualitative confidence is not the same as a metric you can check, and the lack of a disclosed figure makes independent validation of the bull case genuinely difficult.
Q3 guidance language points to momentum, referencing “strong model improvements now live and continued consumer vertical scaling.” That is consistent with traction. It is not measurable independently.
The takeaway for valuation discipline is direct. AppLovin’s premium on sales is only defensible if the e-commerce expansion scales, so the business transition is not background reading. It is the variable that decides whether the forward P/E discount to the NASDAQ 100 is an opportunity or an illusion.
What the analyst community is pricing in, and where the risk lies
The analyst consensus on AppLovin is close to unanimous, and that should prompt a question rather than settle one.
Consider the three data points side by side:
- TIKR (8 July 2026): Mean target of $654, range $406-$860, with 29 of 32 analysts rating the stock buy or outperform, three holds, and zero sells
- Yahoo Finance (24 August 2026): Average target of $526.39, implying roughly 72% upside against the $305.77 price at the time
- SimplyWall.St (15 April 2026): Consensus fair value of approximately $646.86, trimmed only modestly from $651.43, with the applied forward P/E cut from 32.35 to 31.84
That SimplyWall.St detail is the calibration signal. Analysts absorbed the earnings miss by shaving their multiple by a fraction, not by tearing up the thesis. The fundamental view barely moved.
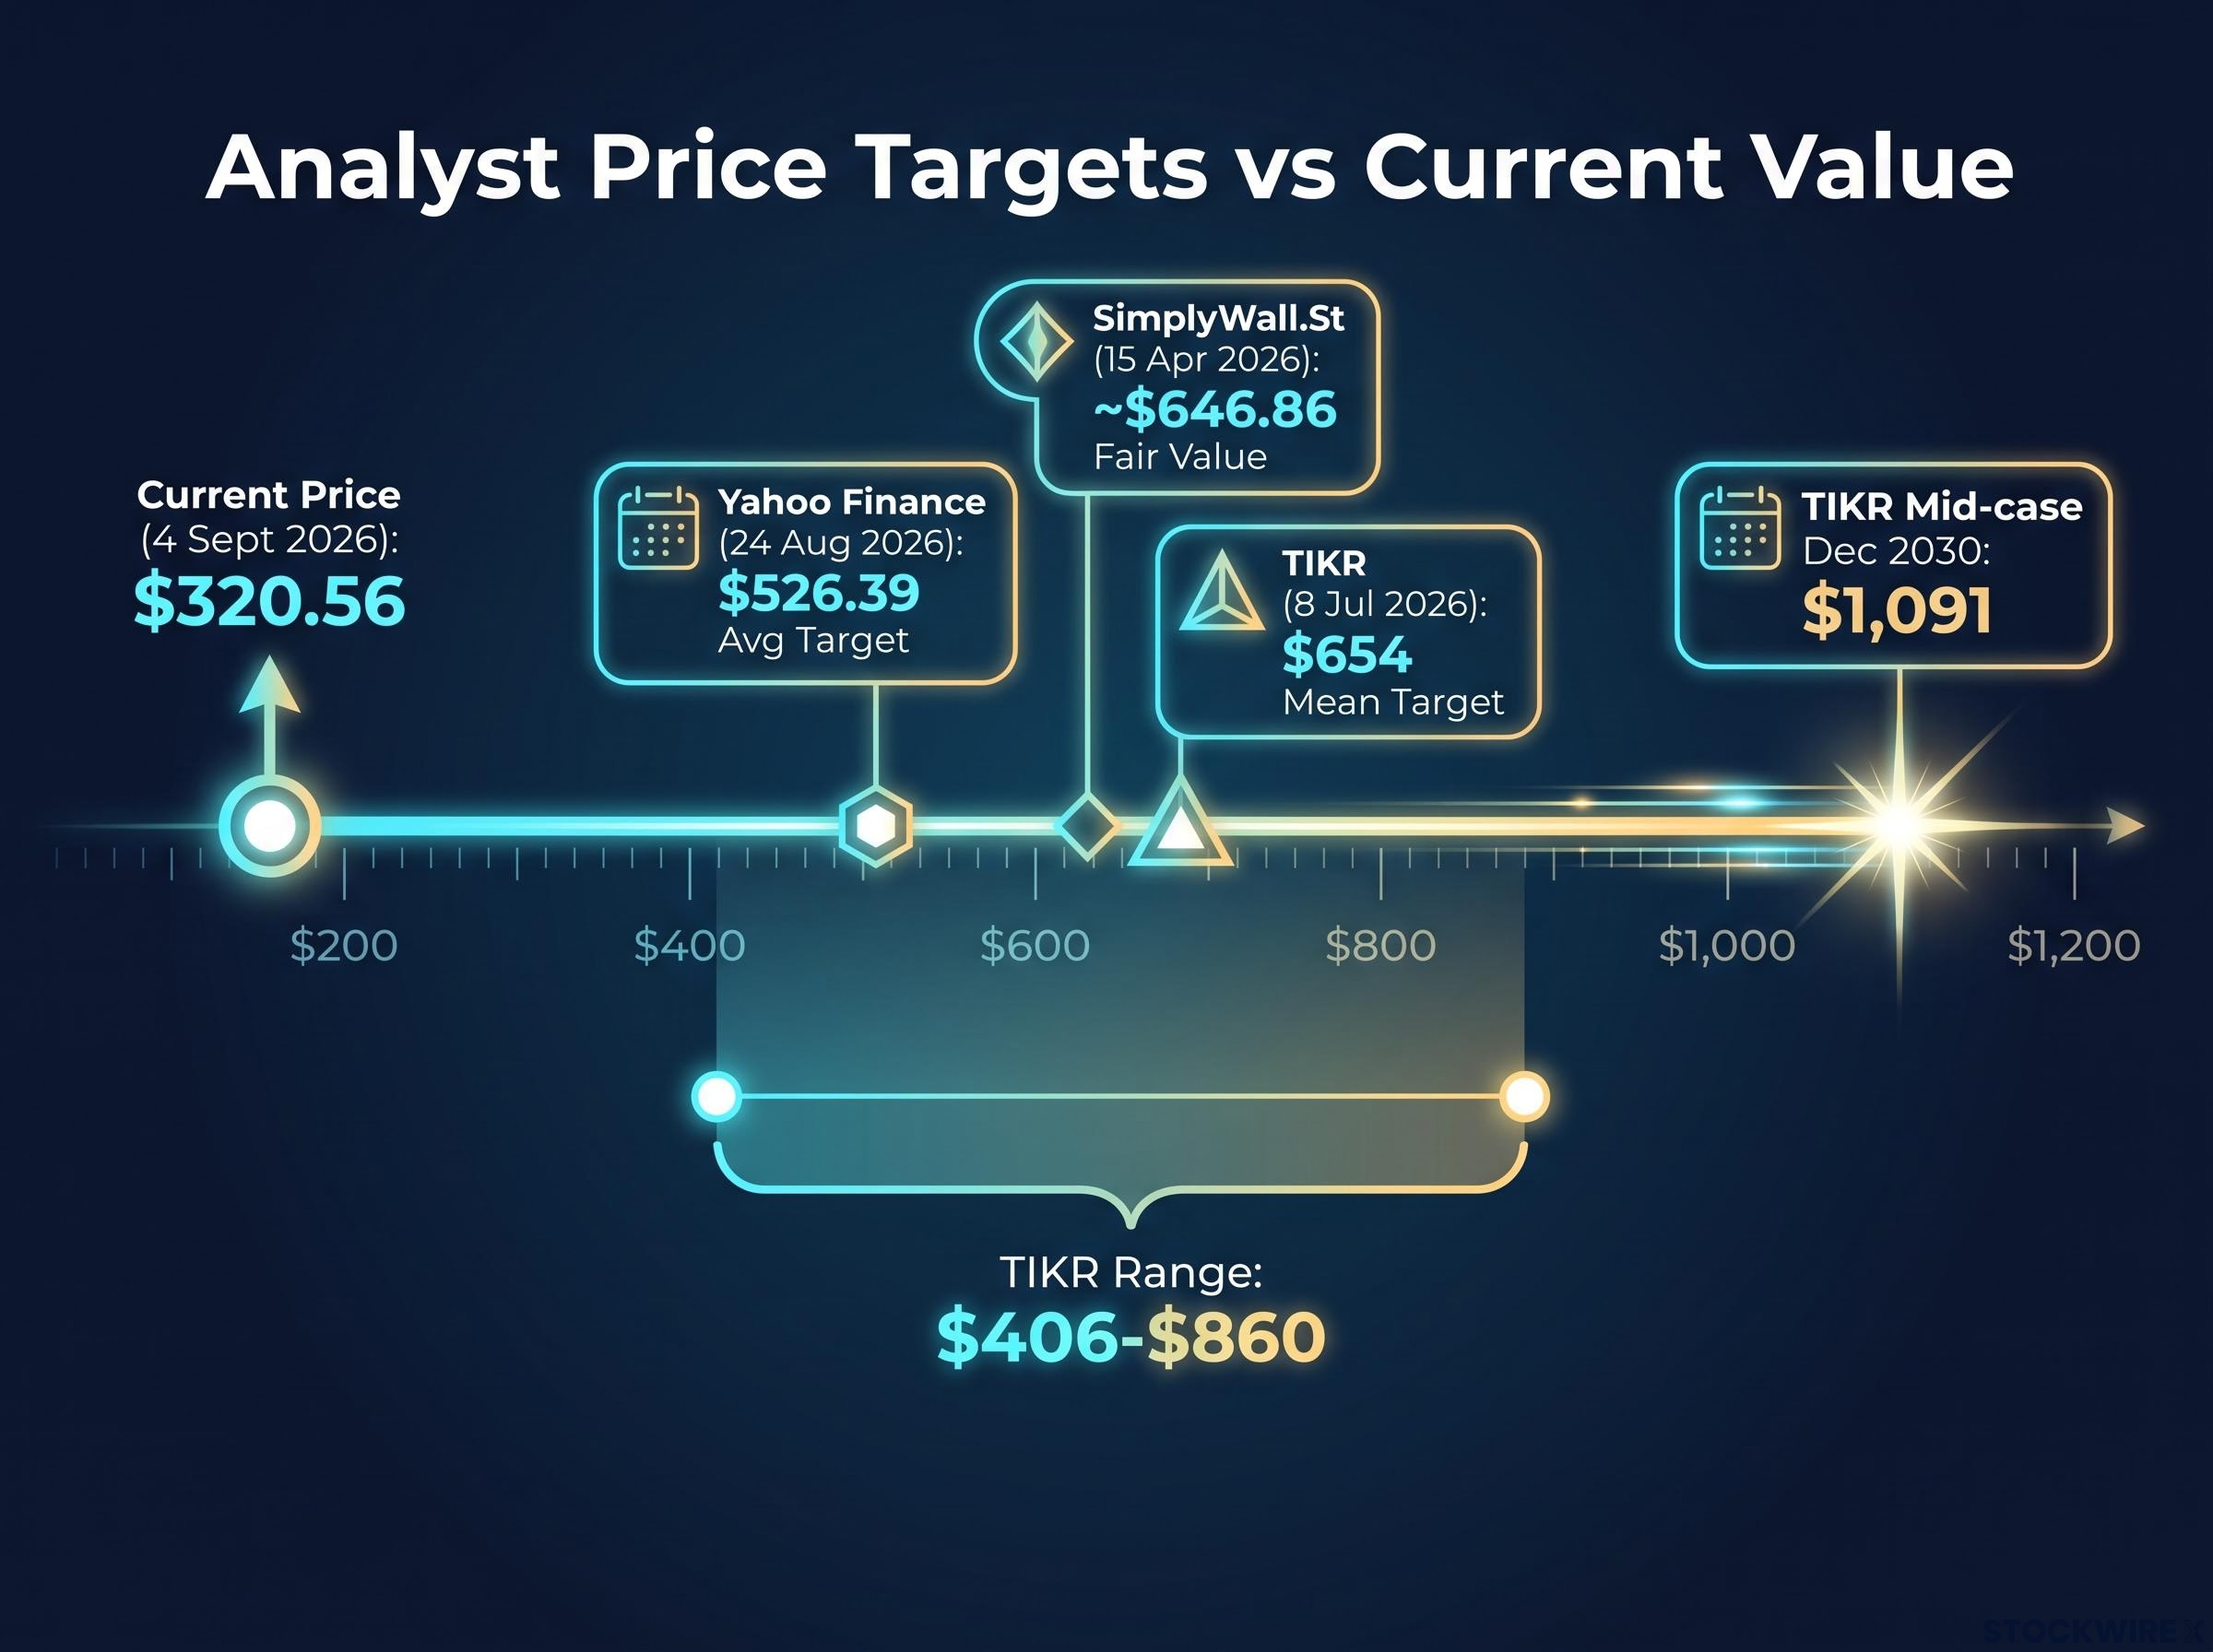
TIKR’s mid-case model values AppLovin at $1,091 per share by December 2030, implying a 107% total return and roughly 18% annualised over about 4.5 years.
Against a price of $320.56 on 4 September 2026, those targets imply 60-100%+ upside. That is a wide enough gap to be genuinely meaningful.
Near-universal bullishness with zero sell ratings is encouraging as a marker of institutional confidence. It also means the consensus carries very little embedded scepticism about e-commerce execution.
Here is the risk those targets do not price. Scaling the e-commerce vertical to sustain 30% growth through 2030 has not been verified in disclosed financials, and model portability from gaming to commerce is an unproven assumption sitting inside every one of those price targets.
AI stock valuations across the NASDAQ 100 face a shared structural test: momentum indicators and consensus price targets embed execution assumptions that must be confirmed in disclosed financials, and AppLovin’s e-commerce gap is a specific instance of the broader premium-vs-proof problem visible across the index.
So treat the upside numbers as contingent on execution, not as a guaranteed floor. The consensus tells you where institutions expect AppLovin to go. It does not tell you the path is confirmed.
Discount or value trap: what the data actually lets you conclude
Pull the four threads together and the picture is dual, not muddy.
AppLovin is not cheap on a sales basis. At roughly 15.7 times annualised revenue against a tech average of 8-10, and with the price-to-sales multiple broadly matching mid-2024 levels, the “52% off” framing is misleading as a standalone signal of value. That is the primary cautionary point.
The relative opportunity is real on forward earnings. A forward P/E of 17-19 against a NASDAQ 100 at 21-24, paired with 75-78% operating margins and 46-48% guided revenue growth for Q3 2026, is a combination you will not find across many large-cap technology names.
What must go right is specific. The e-commerce expansion has to generate scalable, disclosed, independently verifiable revenue that sustains growth at or near the 30%-through-2030 target. Without it, the forward P/E discount to the index rests on assumptions rather than results, and the analyst targets of $526-$654 stay theoretical.
Before acting on this decline, you should be able to answer three questions:
- Which lens governs your decision: the cautionary price-to-sales read, or the constructive forward P/E read?
- What disclosure would verify e-commerce execution, and are you willing to wait for it? The Q3 2026 results, guided to $2.055-$2.085 billion in revenue and $1.71-$1.74 billion in EBITDA, are the next observable test.
- How much tolerance do you have for a stock still carrying an unresolved forward growth assumption?
Framing a decision around a verifiable milestone is more disciplined than acting on the drama of a large percentage drop. The number that would confirm or challenge the thesis is an e-commerce revenue disclosure, and until it arrives, the discount and the trap look identical on a chart.
Framing a decision around a verifiable milestone rather than a large percentage decline is the practical application of margin of safety thinking, which requires anchoring entry price to intrinsic value rather than to how far a stock has already fallen.
This article is for informational purposes only and should not be considered financial advice. Investors should conduct their own research and consult with financial professionals before making investment decisions.
Past performance does not guarantee future results. Financial projections are subject to market conditions and various risk factors, and forward-looking statements are speculative and subject to change based on market developments and company performance.