
ResMed’s price-to-sales ratio has compressed by roughly 51% from its five-year historical average, yet analysts are nearly unanimous in rating the stock a Buy, with upside targets implying 35-38% gains. One number says cheap. The other numbers say: it is more complicated than that.
The price-to-sales ratio is one of the most accessible valuation tools available to retail investors, but accessibility can become a trap when a single metric is mistaken for a complete verdict. ResMed’s current situation, with its P/S sitting at approximately 4.30x against a five-year average of approximately 8.70x, offers a near-perfect real-world illustration of why the ratio is useful as a starting signal and dangerous as a final answer. This guide explains how the price-to-sales ratio works, how to compare it against a stock’s own history, and why that comparison must be combined with discounted cash flow (DCF) and Dividend Discount Model (DDM) thinking before drawing any investment conclusion. The goal is a reusable valuation framework, not just a formula.
What the price-to-sales ratio actually measures (and what it does not)
The price-to-sales ratio measures how much investors are willing to pay for each dollar of a company’s revenue. The formula is straightforward: divide market capitalisation by annual revenue (or, equivalently, divide the share price by revenue per share). The result is a single number that captures a market’s appetite for a company’s top line.
That simplicity is the ratio’s greatest strength and its most significant limitation.
Because P/S uses revenue rather than earnings, it remains calculable even when a company reports a net loss. This makes it particularly useful for early-stage technology or biotechnology firms where profits have not yet materialised. For a company like ResMed, with most recently reported annual revenue of US$4,685 million, the denominator is large, stable, and verifiable.
What the ratio cannot do is tell an investor how much of that revenue the company actually keeps. Two businesses trading at identical P/S multiples can have radically different margin profiles, and therefore radically different investment cases.
The limitations of single valuation metrics become most visible when two businesses with identical ratios carry materially different risk profiles, a pattern that recurs across sectors and market cycles whenever investors rely on one number to do the work of several.
A high-margin business and a low-margin business can show identical P/S multiples while being completely different investments. The ratio reflects the market’s willingness to pay for revenue; it says nothing about the profitability of that revenue.
The practical takeaway:
- What P/S captures: Market sentiment toward a company’s revenue, relative pricing across time or peers, and a starting signal for further investigation.
- What P/S ignores: Profit margins, capital intensity, debt levels, and the quality of earnings underlying the revenue.
- When P/S is most reliable: Comparing a single company against its own historical average, or screening within a single sector where margin profiles are broadly similar.
- When P/S is least reliable: Cross-sector comparisons, or any context where two companies have materially different cost structures.
When big ASX news breaks, our subscribers know first
How to benchmark a P/S ratio against a stock’s own history
A raw P/S multiple is almost meaningless on its own. Stating that ResMed trades at approximately 4.30x sales tells an investor nothing without a reference point. The question is: 4.30x relative to what?
The most informative first comparison is the company’s own history. This approach controls for the variables that make cross-company comparisons unreliable: business model, margin structure, sector dynamics, and investor familiarity with the name. A company’s historical average P/S reflects what the market has typically been willing to pay for its specific revenue stream, and any material deviation from that average raises a question worth answering.
The method follows three steps:
- Source the historical average. Identify a meaningful window, typically three to five years, and calculate or source the average P/S over that period.
- Calculate the premium or discount. Compare the current P/S to the historical average and express the difference as a percentage.
- Ask whether the gap reflects a changed business or a market mispricing. A material discount does not automatically signal opportunity; it may signal that the market is rationally re-pricing a business whose prospects have shifted.
For ResMed, this comparison produces a striking result.
| Metric | Value |
|---|---|
| Current P/S (approx.) | 4.30x |
| Five-year historical average P/S (approx.) | 8.70x |
| Implied discount to history | ~51% |
Figures sourced from Rask Invest Research (published 27 May 2026) and treated as illustrative rather than independently audited.
A 51% discount to a stock’s own five-year average is a large number. It is also, on its own, an incomplete number. ResMed’s three-year revenue compound annual growth rate (CAGR) stands at 13.6% per annum, and its most recently reported annual revenue reached US$4,685 million. The denominator in the P/S ratio has been rising, meaning the numerator (market capitalisation) has fallen even further in relative terms. ASX:RMD shares have declined approximately 18.83% year-to-date as of May 2026, compressing the multiple from both sides.
The historical comparison turns a raw number into a relative signal. The next question is whether that signal points toward opportunity or warning.
Why ResMed’s P/S discount does not automatically mean cheap
Multiple compression can mean one of two things: the market is overreacting to short-term uncertainty and creating a buying opportunity, or the market is rationally re-pricing a business whose long-term prospects have genuinely changed. The P/S ratio alone cannot distinguish between the two.
In ResMed’s case, three factors have driven the multiple from the 8-9x range toward its current level near 4.30x:
- GLP-1 structural overhang. Investor concern centres on whether GLP-1 obesity drugs (such as semaglutide and tirzepatide) may reduce the long-term prevalence or severity of obstructive sleep apnea, potentially shrinking demand for CPAP devices over time.
- Growth moderating from prior peak pace. Two-year annualised revenue growth of 9.9% remains healthy but sits below the five-year trend, and markets typically compress multiples when growth decelerates even if absolute levels are still solid.
- CFO transition uncertainty. Long-time CFO Brett Sandercock retired effective 4 May 2026, with Aaron Bloomer appointed as successor. A change in a senior financial role during a period of heightened sector uncertainty can modestly increase the required risk premium.
The GLP-1 question is the dominant driver. The uncertainty alone, rather than confirmed demand destruction, has been sufficient for the market to de-rate the multiple by roughly half. Some commentators have suggested the fears may be overdone given current demand trends. Clinical data on GLP-1 outcomes for sleep apnea remains early-stage, meaning the overhang could persist until that evidence matures.
A P/S discount alongside negative operating cash flow is a materially different investment proposition from a P/S discount in a high-margin, cash-generative business: Zip Co’s 3.76x multiple sits 35% below its five-year average while FY25 net operating cash flow remained negative, a combination that illustrates precisely why the ratio cannot be read without examining what the revenue base actually produces.
What the underlying business data actually shows
Q3 FY2026 revenue of US$1.4 billion, +11% year-on-year, with non-GAAP gross margin reaching 62.8%, up 290 basis points.
ResMed’s Q3 FY2026 results (quarter ended 31 March 2026) reported revenue of approximately US$1.4 billion, up 11% year-on-year. Non-GAAP earnings per share came in at US$2.86 versus a forecast of US$2.79, a beat driven by higher demand and margin expansion. Non-GAAP gross margin reached 62.8%, up 290 basis points, reflecting component cost and manufacturing efficiencies.
Over a three-year window, the trajectory is equally clear. Revenue CAGR of 13.6% and net profit CAGR of 29.1% (net profit rising from US$475 million to US$1,021 million) demonstrate a business that has been strengthening, not deteriorating. Margin expansion running in parallel with revenue growth is a signal of business quality, and it is precisely the kind of contextual data that a P/S ratio cannot convey.
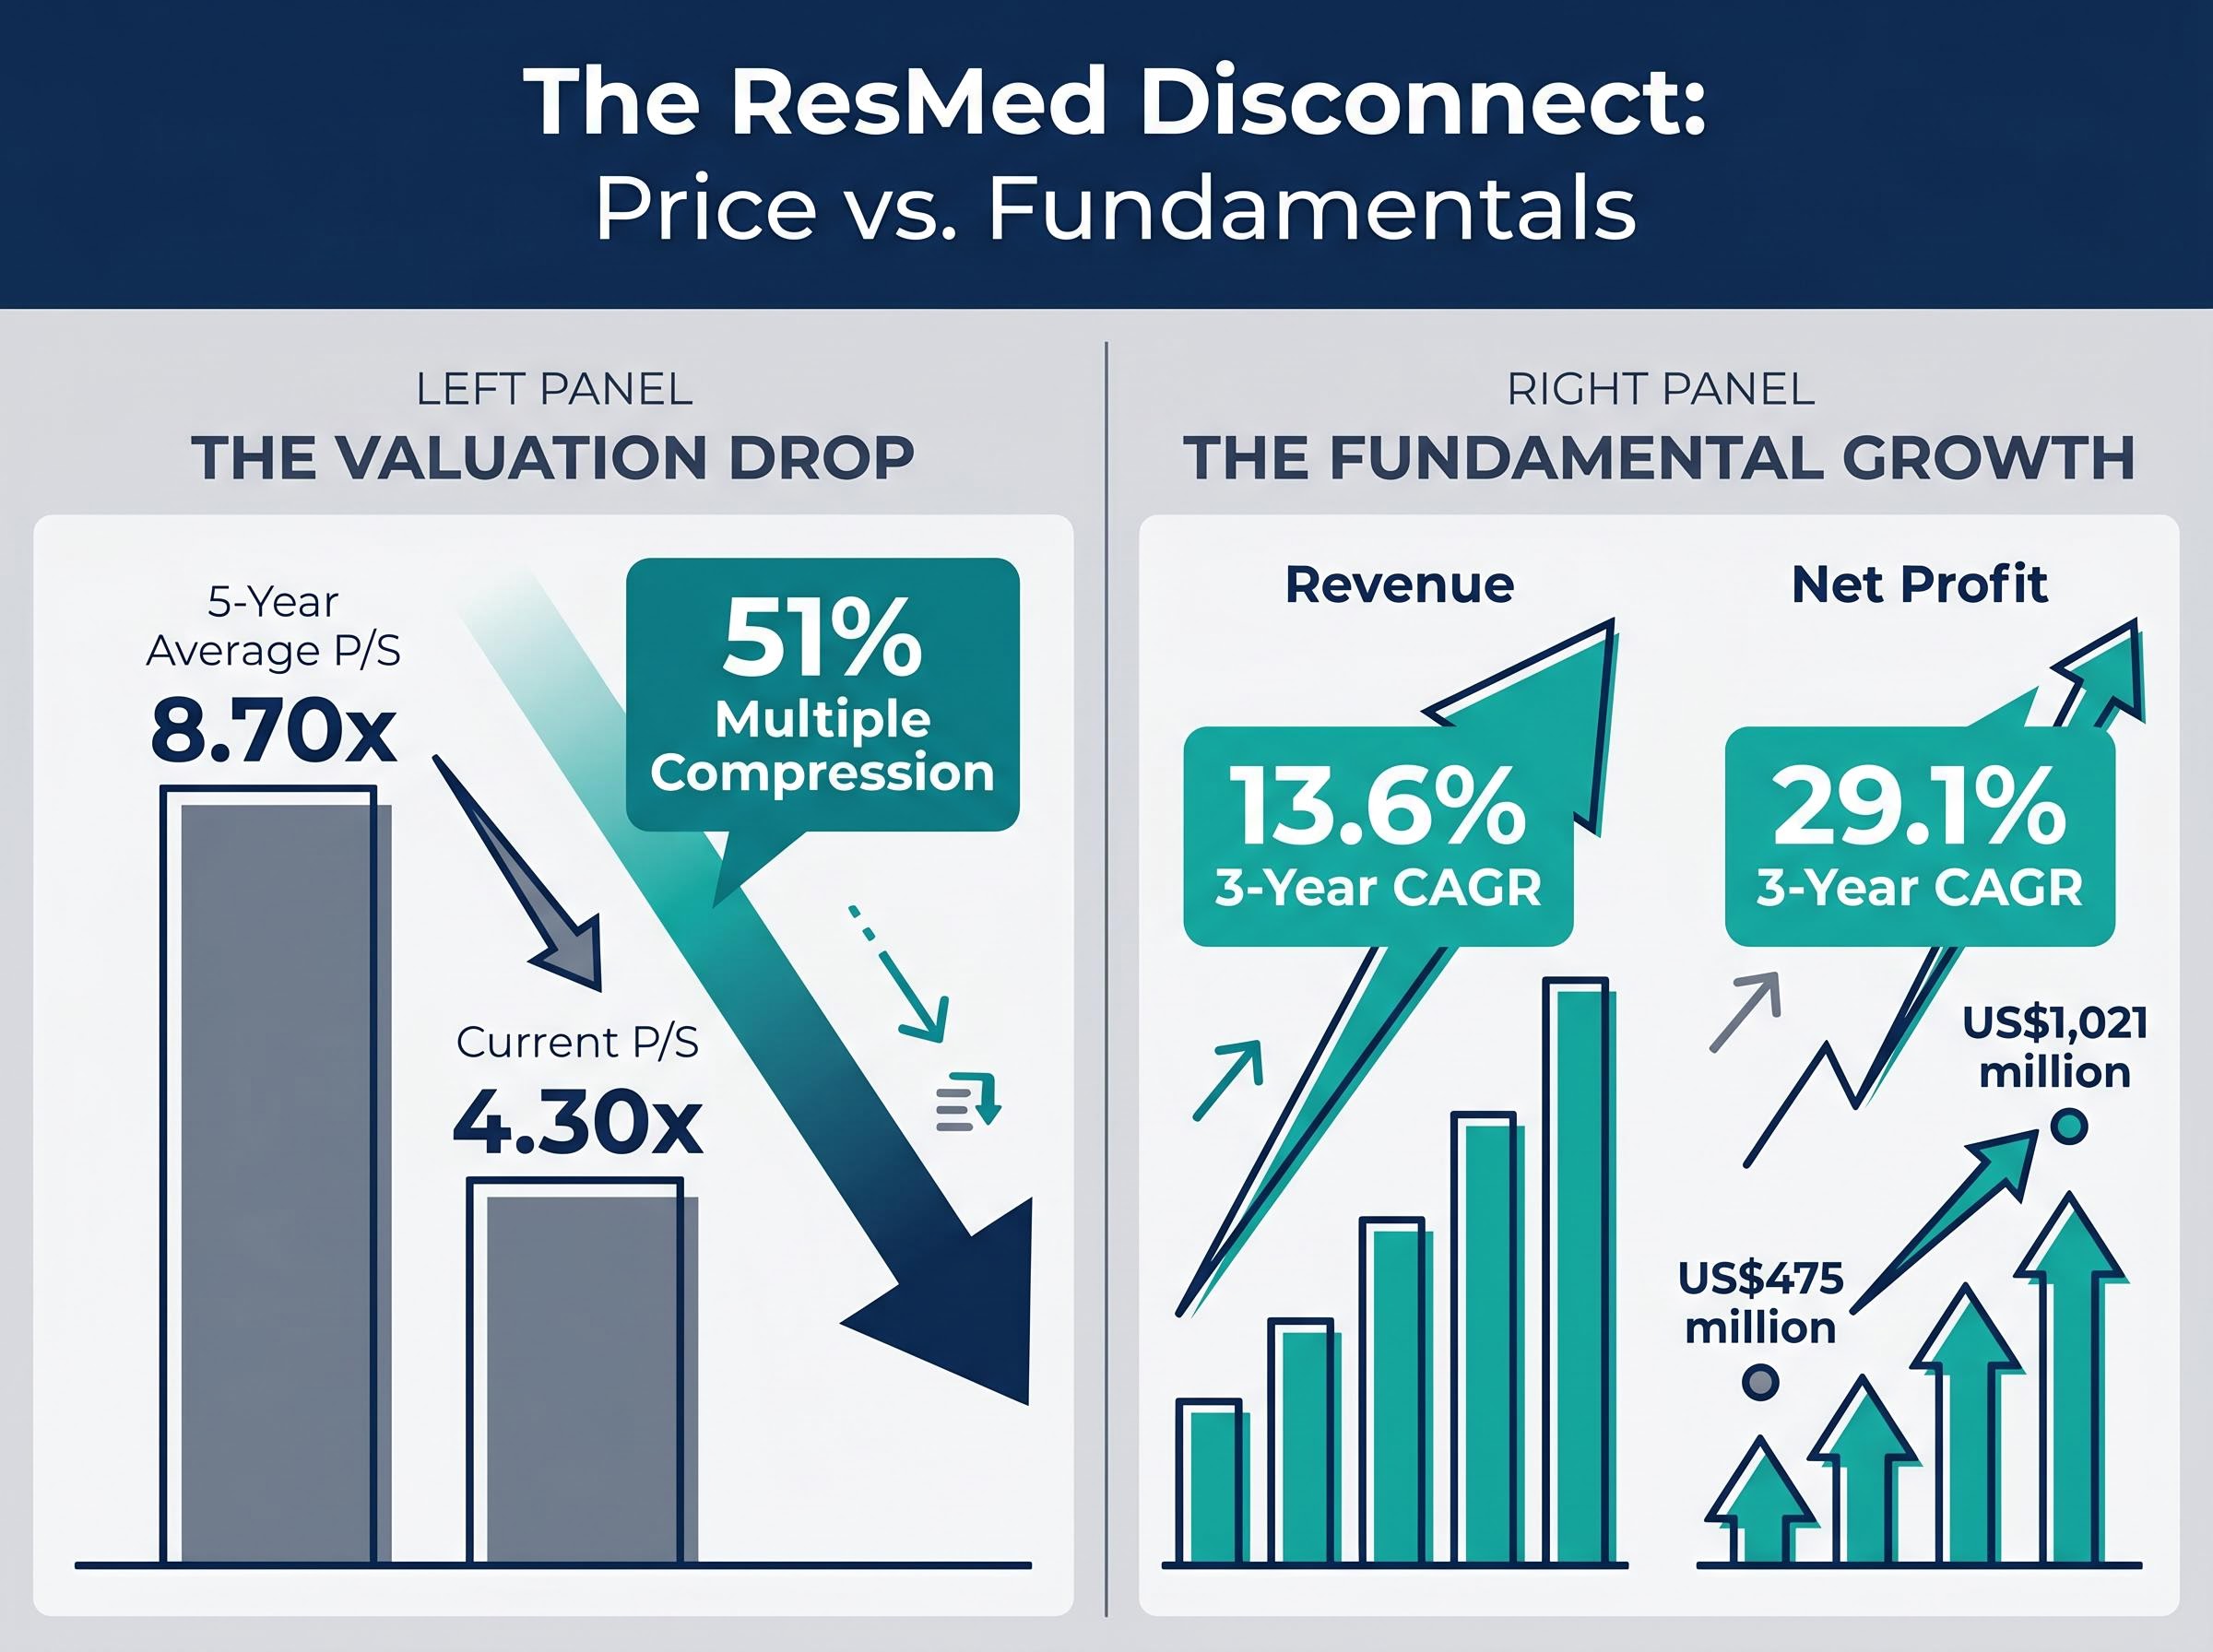
The disconnect is the point. Reported fundamentals remain strong. The multiple remains compressed. The gap between those two facts is where the real analytical work begins.
Beyond the single metric: how DCF and DDM provide a fuller picture
Anyone who has identified a potential valuation anomaly through ratio screening has already completed the first step. The next step is to move from ratio-based thinking to cash-flow-based thinking.
A discounted cash flow model estimates the present value of all future free cash flows a business is expected to generate, discounted back at a rate reflecting the riskiness of those cash flows. Unlike P/S, which is anchored to current market sentiment and historical norms, DCF is forward-looking. It forces the analyst to make explicit assumptions about revenue growth, margins, reinvestment needs, and discount rates, and then tests whether the current price is consistent with those assumptions.
The Dividend Discount Model operates on the same principle but narrows the cash flows to expected dividend payments. For a company like ResMed, which pays a dividend, both methodologies have some applicability, though DCF typically carries more weight given the company’s reinvestment profile.
Dividend discount model mechanics trace back to John Burr Williams’ 1938 framework, which treated a stock’s intrinsic value as the present value of its future income stream rather than its resale price, a discipline that remains embedded in the CFA Institute curriculum and professional equity strategy work today.
The practical link between P/S and DCF is more direct than most retail investors realise. Analyst price targets, such as the MarketBeat consensus of US$286.18 as of 22 May 2026, are typically derived from DCF models. The gap between that target and ResMed’s closing price of approximately US$208.04 (implying roughly 37.6% upside) does not represent a straightforward buy signal. It represents the market’s implicit disagreement with the cash flow assumptions underpinning those analyst models.
The MarketBeat analyst consensus for ResMed, as of late May 2026, shows a Moderate Buy rating with an average price target of US$286.18, drawn from a distribution of buy, hold, and strong buy ratings that reflects near-unanimous institutional confidence in the company’s recovery case.
The CFA Institute’s standard guidance frames this relationship clearly: relative multiples (including P/S) serve as cross-checks for DCF-based intrinsic value estimates, not replacements.
| Dimension | P/S Ratio | DCF | DDM |
|---|---|---|---|
| What it measures | Price paid per dollar of revenue | Present value of future free cash flows | Present value of future dividends |
| Key input required | Market cap and revenue | Cash flow projections, discount rate | Dividend forecasts, required return |
| Best suited for | Screening and peer comparison | Intrinsic value estimation | Mature dividend-paying firms |
| Primary limitation | Ignores profitability entirely | Highly sensitive to assumptions | Not applicable to non-payers |
The recommended workflow for combining these methods:
- Use P/S for initial screening to identify stocks trading at a material premium or discount to their own history.
- Assess whether the discount reflects changed fundamentals or market sentiment by reviewing recent earnings, margins, and risk factors.
- Cross-check with analyst DCF targets and, where possible, review the growth and margin assumptions behind them.
- Apply DDM if the company pays a dividend, comparing the implied yield and growth trajectory to alternatives.
- Form a view only after all signals are read together, not after any single metric has been consulted in isolation.
The valuation framework every investor should carry into the next stock screen
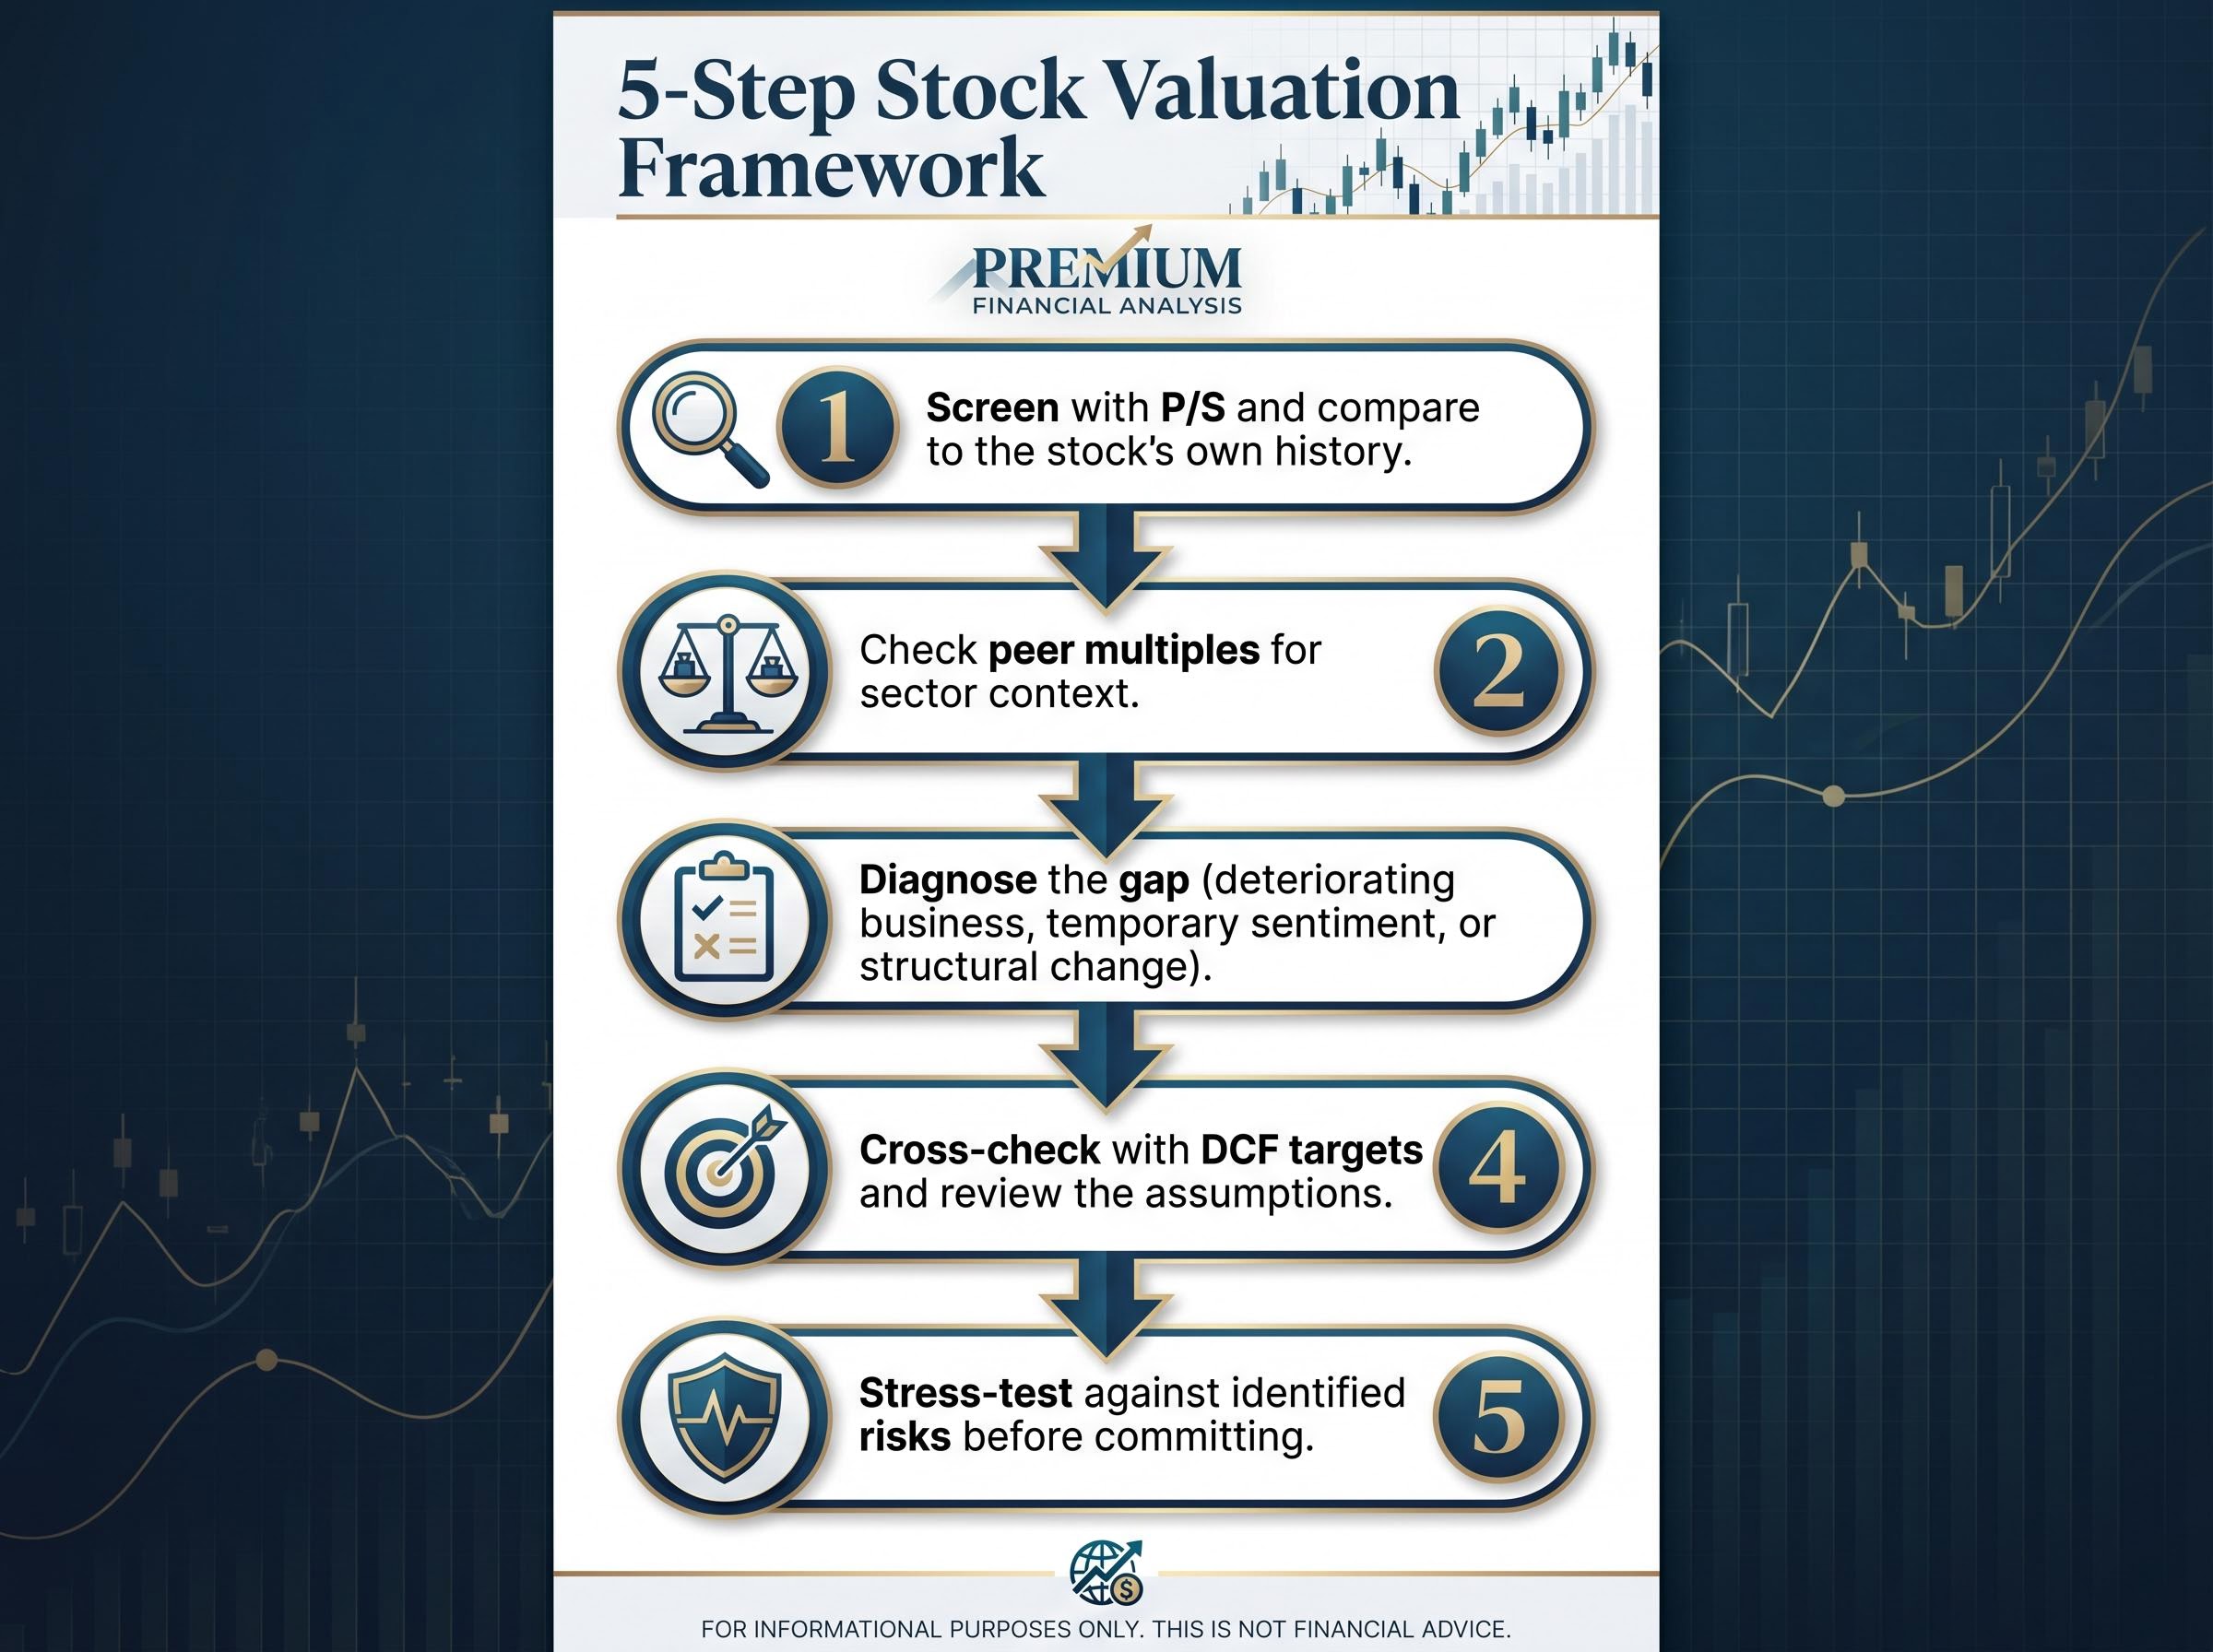
The ResMed case study illustrates a process that applies to any stock on any exchange where a ratio screen has surfaced a potential anomaly. The framework, in reusable form:
- Screen with P/S and compare to the stock’s own history. Identify whether the current multiple sits at a premium or discount to a meaningful historical window.
- Check peer multiples for sector context. A stock that looks cheap against its own history may be fairly valued relative to its peers, or vice versa.
- Diagnose the gap. Determine whether the difference between the current multiple and the historical average reflects a deteriorating business, a temporary sentiment overhang, or a structural change in the company’s addressable market.
- Cross-check with DCF targets and review the assumptions. Analyst price targets are outputs of models with specific inputs. The target number matters less than whether the inputs are realistic.
- Stress-test against identified risks before committing. Ask whether the risks that justify the compressed multiple are likely to prove structural or transitory, and what evidence would change that assessment.
Investors wanting to build out the five-step framework described above into a fully worked sequence will find our full explainer on combining valuation methods for ASX stocks, which walks through how P/S, EV/EBITDA, DCF, and DDM interact across different business types, including a worked example using Flight Centre where a low P/S ratio masked $755 million in net debt.
Applied to ResMed: the P/S screen flags an approximately 51% discount to history (approximately 4.30x versus approximately 8.70x). Investigation reveals the GLP-1 overhang, growth moderation, and CFO transition as the primary drivers. DCF-based analyst targets suggest 37-38% upside if those risks do not materialise. Supplementary data points, including net debt of negative US$624 million, a debt-to-equity ratio of 18%, and return on equity of 22.7% (FY24), belong in the diagnosis step rather than the initial screen.
A discounted P/S is a question, not an answer. The quality of an investor’s conclusion depends entirely on the quality of the investigation that follows the initial screen.
The discipline is not about eliminating uncertainty. It is about ensuring the investor understands which specific risks justify the current multiple, rather than being surprised by them after capital has been committed.
A discounted ratio is always a question, never a verdict
ResMed’s P/S compression relative to its own history is a valuable early signal but an unreliable final signal. Reported earnings remain strong, analyst targets imply substantial upside, and yet the market continues to hold the multiple well below its historical average because a material structural risk, the potential for GLP-1 drugs to reduce long-term CPAP demand, remains unresolved.
The habit worth adopting for any discounted multiple is a single question: “Do I understand why this gap exists, and have I formed a view on whether that reason is permanent or temporary?”
As GLP-1 clinical data on sleep apnea outcomes matures over 2026 and beyond, the resolution of that uncertainty will likely be the single largest determinant of whether ResMed’s multiple re-rates toward its historical average or remains suppressed. The ratio flagged the question. The investigation that follows determines the quality of the answer.
Valuation is a process of structured uncertainty management. Ratios are the entry point, not the destination.
This article is for informational purposes only and should not be considered financial advice. Investors should conduct their own research and consult with financial professionals before making investment decisions. Past performance does not guarantee future results. Financial projections are subject to market conditions and various risk factors.