
Six months ago, Citi put a number on a gap it saw hiding in plain sight: European equities were trading roughly 10% below where the bank’s analysts thought a genuine policy pivot should price them. Since then, the market has moved. The question worth sitting with is whether the market caught up to the thesis, or whether the thesis has run further ahead of the market.
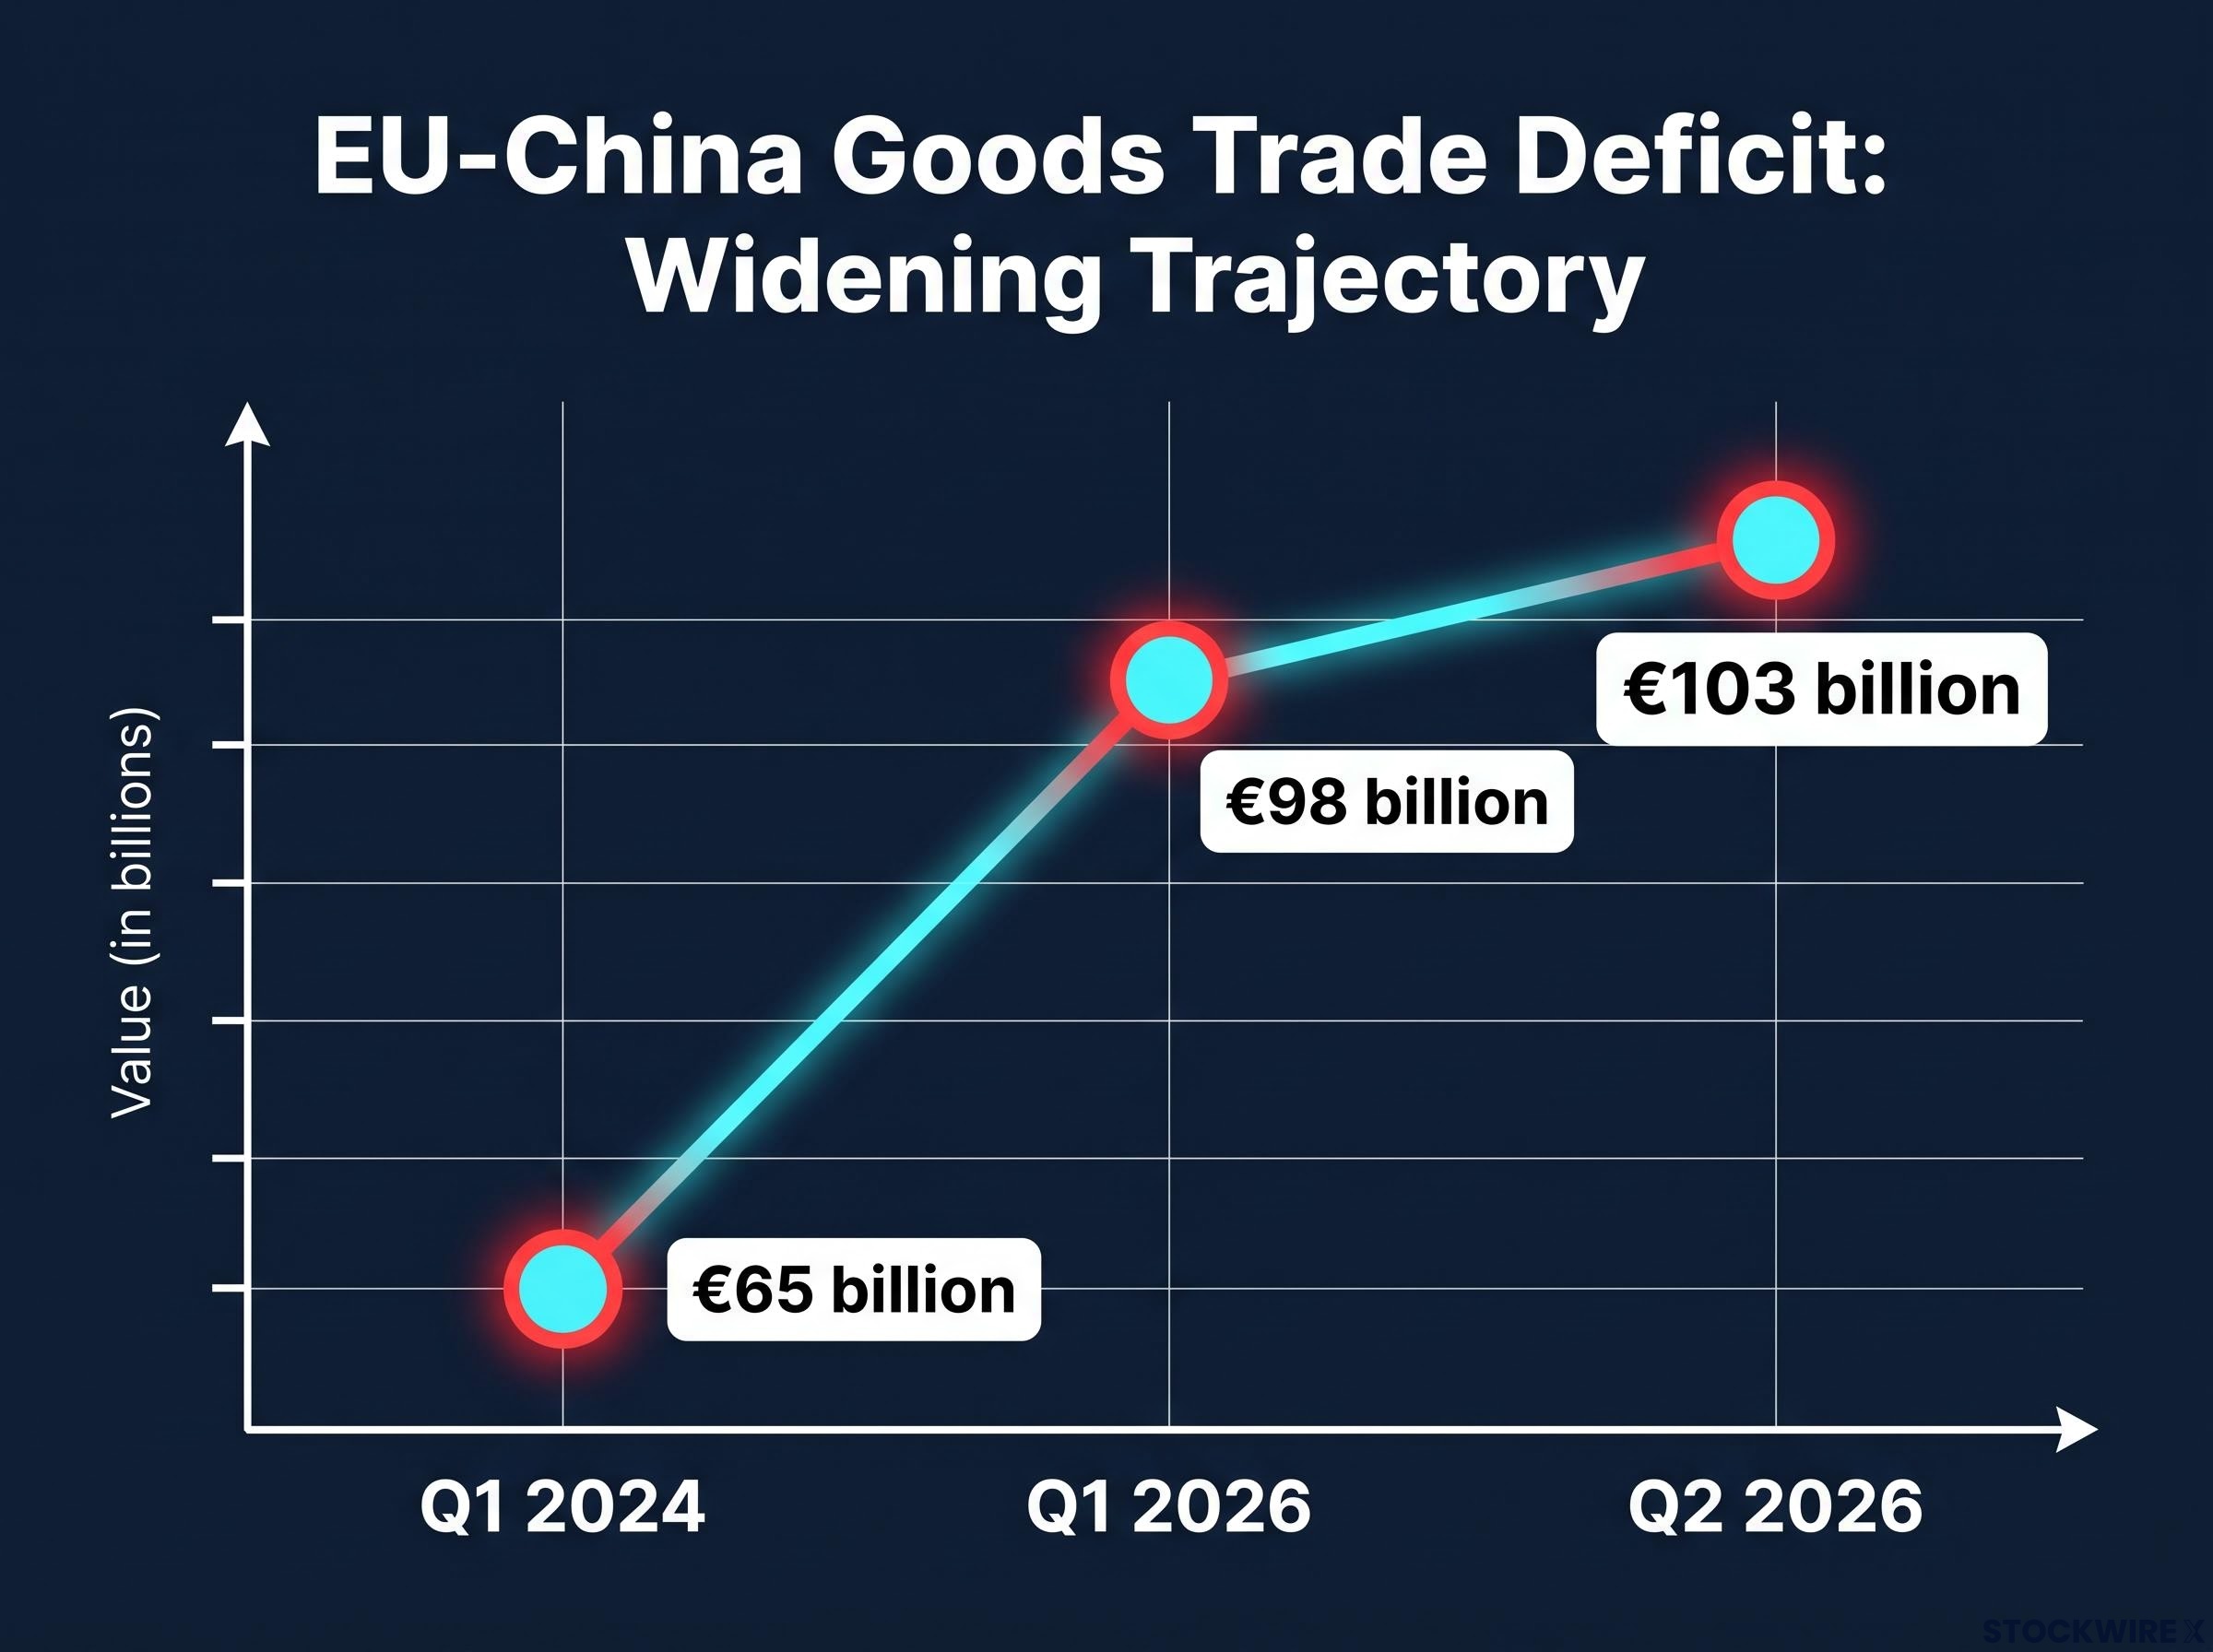
This is a live analytical puzzle sitting at the intersection of an active trade-policy cycle and an unresolved equity-pricing debate. Europe has deployed 172 anti-dumping and anti-subsidy measures, the EU-China goods trade deficit has widened from roughly €65 billion in Q1 2024 to €103 billion in Q2 2026, and the forward price-to-earnings ratio on MSCI Europe now sits in the 15-16x range. The policy shift is real and measurable; how much of it equity prices already reflect is the contested part.
After this piece, you will have a structured way to judge whether the European equity valuation and trade policy story creates a durable case for multiple expansion, or a one-time cyclical adjustment the market has already banked.
Why European equities were underpriced six months ago
To assess whether the gap has closed, you have to rebuild the original thesis from the ground up. On 9 March 2026, a Citi equity team led by Sebastian Satz argued that equity markets had not yet caught up to how far Europe had already moved in responding to US trade barriers and intensifying Chinese industrial competition.
The core of the argument was structural. Europe, in Citi’s read, was pivoting away from export dependence and toward domestic demand as its primary growth engine, underpinned by a combination of procurement preferences, local-content requirements, and resilience measures that were being extended and hardened by increasingly assertive trade defence across industries of strategic importance. Spending on public and private investment was identified as the primary channel through which that shift would flow.
The forcing function underneath all of this was the trade imbalance with China. The EU-China goods deficit reached roughly €98 billion in Q1 2026, up sharply from about €65 billion in Q1 2024.
That trajectory is the part worth reading closely, because the deficit is not just a trade statistic. It is the pressure gauge that explains why political willingness to deploy aggressive trade defence was rising regardless of which parties held power. When the number moves in one direction for years, the policy response stops being a question of if and becomes a question of when.
Three signals defined the setup Citi identified:
- The EU-China quarterly deficit widening from roughly €65 billion (Q1 2024) toward €98 billion (Q1 2026)
- Capacity utilisation across European industry declining sharply, with Germany’s chemical and automotive sectors bearing the heaviest pressure
- No EU member state, Germany included, still running a trade surplus with China
Those German chemical and automotive names were the clearest political-economy pressure point. When the industrial base of the continent’s largest economy is running below capacity while imports climb, escalation stops being merely possible and starts looking structurally inevitable.
Citi attached a specific price consequence to all of this.
Citi projected a re-rating of approximately 10%, moving MSCI Europe toward roughly 16 times earnings over the longer term.
That target is your reference point for everything that follows. The rest of the analysis is really one question: how much of that 10% has the market since delivered?
When big ASX news breaks, our subscribers know first
What 172 trade-defence measures actually look like in practice
A policy pivot is abstract. Named tariffs are not. By mid-2026, the EU had 172 anti-dumping and anti-subsidy measures in force, with more than three-quarters aimed at Chinese firms.
That is not a political intention any more. It is an active and accelerating implementation record, and the sector coverage is broad enough that European producers are already operating inside a changed set of competitive rules. The measures cluster into four areas: chemicals and materials, automotive and transportation, heavy industry, and ceramics and glass fibre.
| Sector cluster | Product | Duty rate | Date applied |
|---|---|---|---|
| Chemicals and materials | Phosphorous acid | 122.8% | March 2026 |
| Chemicals and materials | Adipic acid | 29.1%-42.3% | May 2026 |
| Automotive and transport | Chinese-built EVs | up to 35.3% | February 2026 |
| Automotive and transport | Tyres | 4.3%-45.3% | July 2026 |
| Heavy industry | High-pressure seamless steel cylinders | 57.7%-90.3% | 2026 |
| Ceramics and glass fibre | Ceramic tableware | uniform 79% | 2026 |
The chemicals cluster is the most aggressive. Phosphorous acid drew definitive duties of 122.8% in March 2026, valine landed at 31.3%-53.8% in February, and 1,4-butanediol and candles reached up to 60.3%.
Automotive tells a more negotiated story. Chinese-built electric vehicles faced additional duties of up to 35.3%, paired with minimum price conditions carmakers can meet to sidestep tariffs entirely. Steel road wheels drew 50.3%-66.4%, sitting alongside the seamless-cylinder rates.
The glass fibre case is where the approach shows genuine sophistication rather than just breadth. Rather than tax only mainland Chinese output, the EU went after circumvention, applying duties of 11%-25.4% on glass fibre produced by Chinese companies operating in three third countries:
- Egypt
- Bahrain
- Thailand
That distinction matters. Chasing production that has relocated to dodge existing duties tells you the EU is closing loopholes as it widens the net, not simply raising rates on obvious targets. For an investor, the read is that the margin protection being handed to European producers is harder to route around than a simple tariff schedule would suggest.
China’s trade network expansion through third-country rerouting is precisely the dynamic the EU’s circumvention duties on glass fibre production in Egypt, Bahrain, and Thailand are designed to counter, as Beijing demonstrated during earlier US tariff rounds that bilateral trade restrictions alone do not prevent supply-chain adaptation.
How trade-defence measures translate into equity re-ratings
You can know every tariff percentage and still not know how a duty on ceramic tableware becomes a higher share price. The link runs through four transmission channels that analysts and EU officials consistently identify:
- Margin and pricing support. Offsetting dumped or subsidised import prices restores what officials call fair competition, protecting domestic producers’ volumes and margins.
- Demand re-allocation. Duties make artificially cheap imports less attractive, shifting buyers toward EU-based suppliers.
- Perceived resilience. Guarding the industrial base against Chinese overcapacity lowers the perceived downside risk, which lets investors assign higher multiples to exposed sectors.
- Macro-fiscal tailwinds. Resilience spending and fiscal packages interact directly with protected industries, lifting earnings projections.
Here is the distinction that determines how much any of this is worth to you. A re-rating can be earnings-driven, where profits rise because margins improve, or multiple-driven, where investors simply pay a higher P/E because they now see the sector as less risky. Citi’s thesis implies both are in play at once.
The durability of the two is not the same. Earnings improvements from tariff protection can be competed away, retaliated against, or eroded by higher input costs. Multiple expansion reflects something stickier: a lasting change in how investors categorise European equity risk. When you read an analyst upgrading Europe, the question to ask is which of the two they are actually betting on.
The valuation starting point matters here too.
Morningstar has noted that European markets trade at only a 1% discount to their fair-value estimate following cyclical recovery, meaning further re-rating leans heavily on continued, credible policy execution rather than a simple valuation catch-up.
A worked example: ceramics tariffs and what they signal
Ceramics makes the mechanism concrete. The EU replaced a duty range of 13.1%-36.1% on Chinese ceramic tableware with a uniform 79%. For a domestic EU producer, that shift converts a patchy price advantage into a wide, consistent one across the entire import category, protecting both the volumes it sells and the prices it can charge. That is margin support you can see, and it is the raw material every re-rating argument is built from.
The case against a full re-rating, and why it matters
Three sections of bull case deserve a hard pivot. The re-rating thesis has real structural objections, and reading only the upside would leave you with half the picture.
Four limits cap the case:
- Retaliation risk from China. Export licensing delays, procurement restrictions, and counter-remedies are highly likely and could bleed into green energy, food, chemicals, and machinery.
- The EU-US front. The EU has suspended, not withdrawn, a large retaliatory package against the US until August 2026, leaving a transatlantic tariff conflict a live possibility.
- Consumer cost inflation. Aggressive tariffs raise prices for EU consumers, which compresses real demand and squeezes margins elsewhere in the economy.
- Too little, too late. With the EU-China deficit having roughly doubled in five years, the damage to legacy German chemicals and autos may already be entrenched, so tariffs could stabilise rather than restore lost capacity.
There is a legal ceiling as well. Broad deployment of tools like the EU’s Anti-Coercion Instrument, framed by some as a trade bazooka, raises questions over proportionality and compatibility with World Trade Organization rules, which caps how aggressive future measures can safely become.
Tariff policy credibility on the US side is eroding through a different mechanism: the Supreme Court’s February 2026 invalidation of IEEPA-based authority and subsequent legal challenges to Section 122 and Section 338 mean the external trade environment the EU’s 172 measures are operating within is itself legally unstable, adding a second source of policy-execution uncertainty to the re-rating calculus.
The macro counterweight is the most important number in this section.
IMF analysis warns that a re-escalation of US-EU trade tensions could cut euro-area growth by 0.4-0.8 percentage points across 2026-2027.
That figure is what keeps this from being a clean bull case. Even if sector-level tariffs deliver the margin protection they promise, a broader trade conflict could offset those gains at the index level, and the index is exactly where most investors hold their exposure. The upside and the caps have to be in view together before you draw any conclusion.
Has the market caught up, and where does the gap stand now?
So where does the valuation actually sit today? The current data answers part of the question and leaves part of it open.
| Source | Reported forward P/E | Date | Historical median | Distance from 16x target |
|---|---|---|---|---|
| JPMorgan Asset Management | 15.2x | 3 August 2026 | 14.3x (long-run average) | ~0.8x below |
| DWS | ~16.0x | 25 August 2026 | 14-15x | at target |
| STOXX | near 15x | 2026 | n/a | ~1x below |
The market has clearly moved toward Citi’s 16x target. JPMorgan Asset Management put MSCI Europe at 15.2x on 3 August 2026, above its 14.3x long-run average. DWS had the consensus 12-month forward multiple at roughly 16.0x three weeks later, against a historical median of 14-15x.
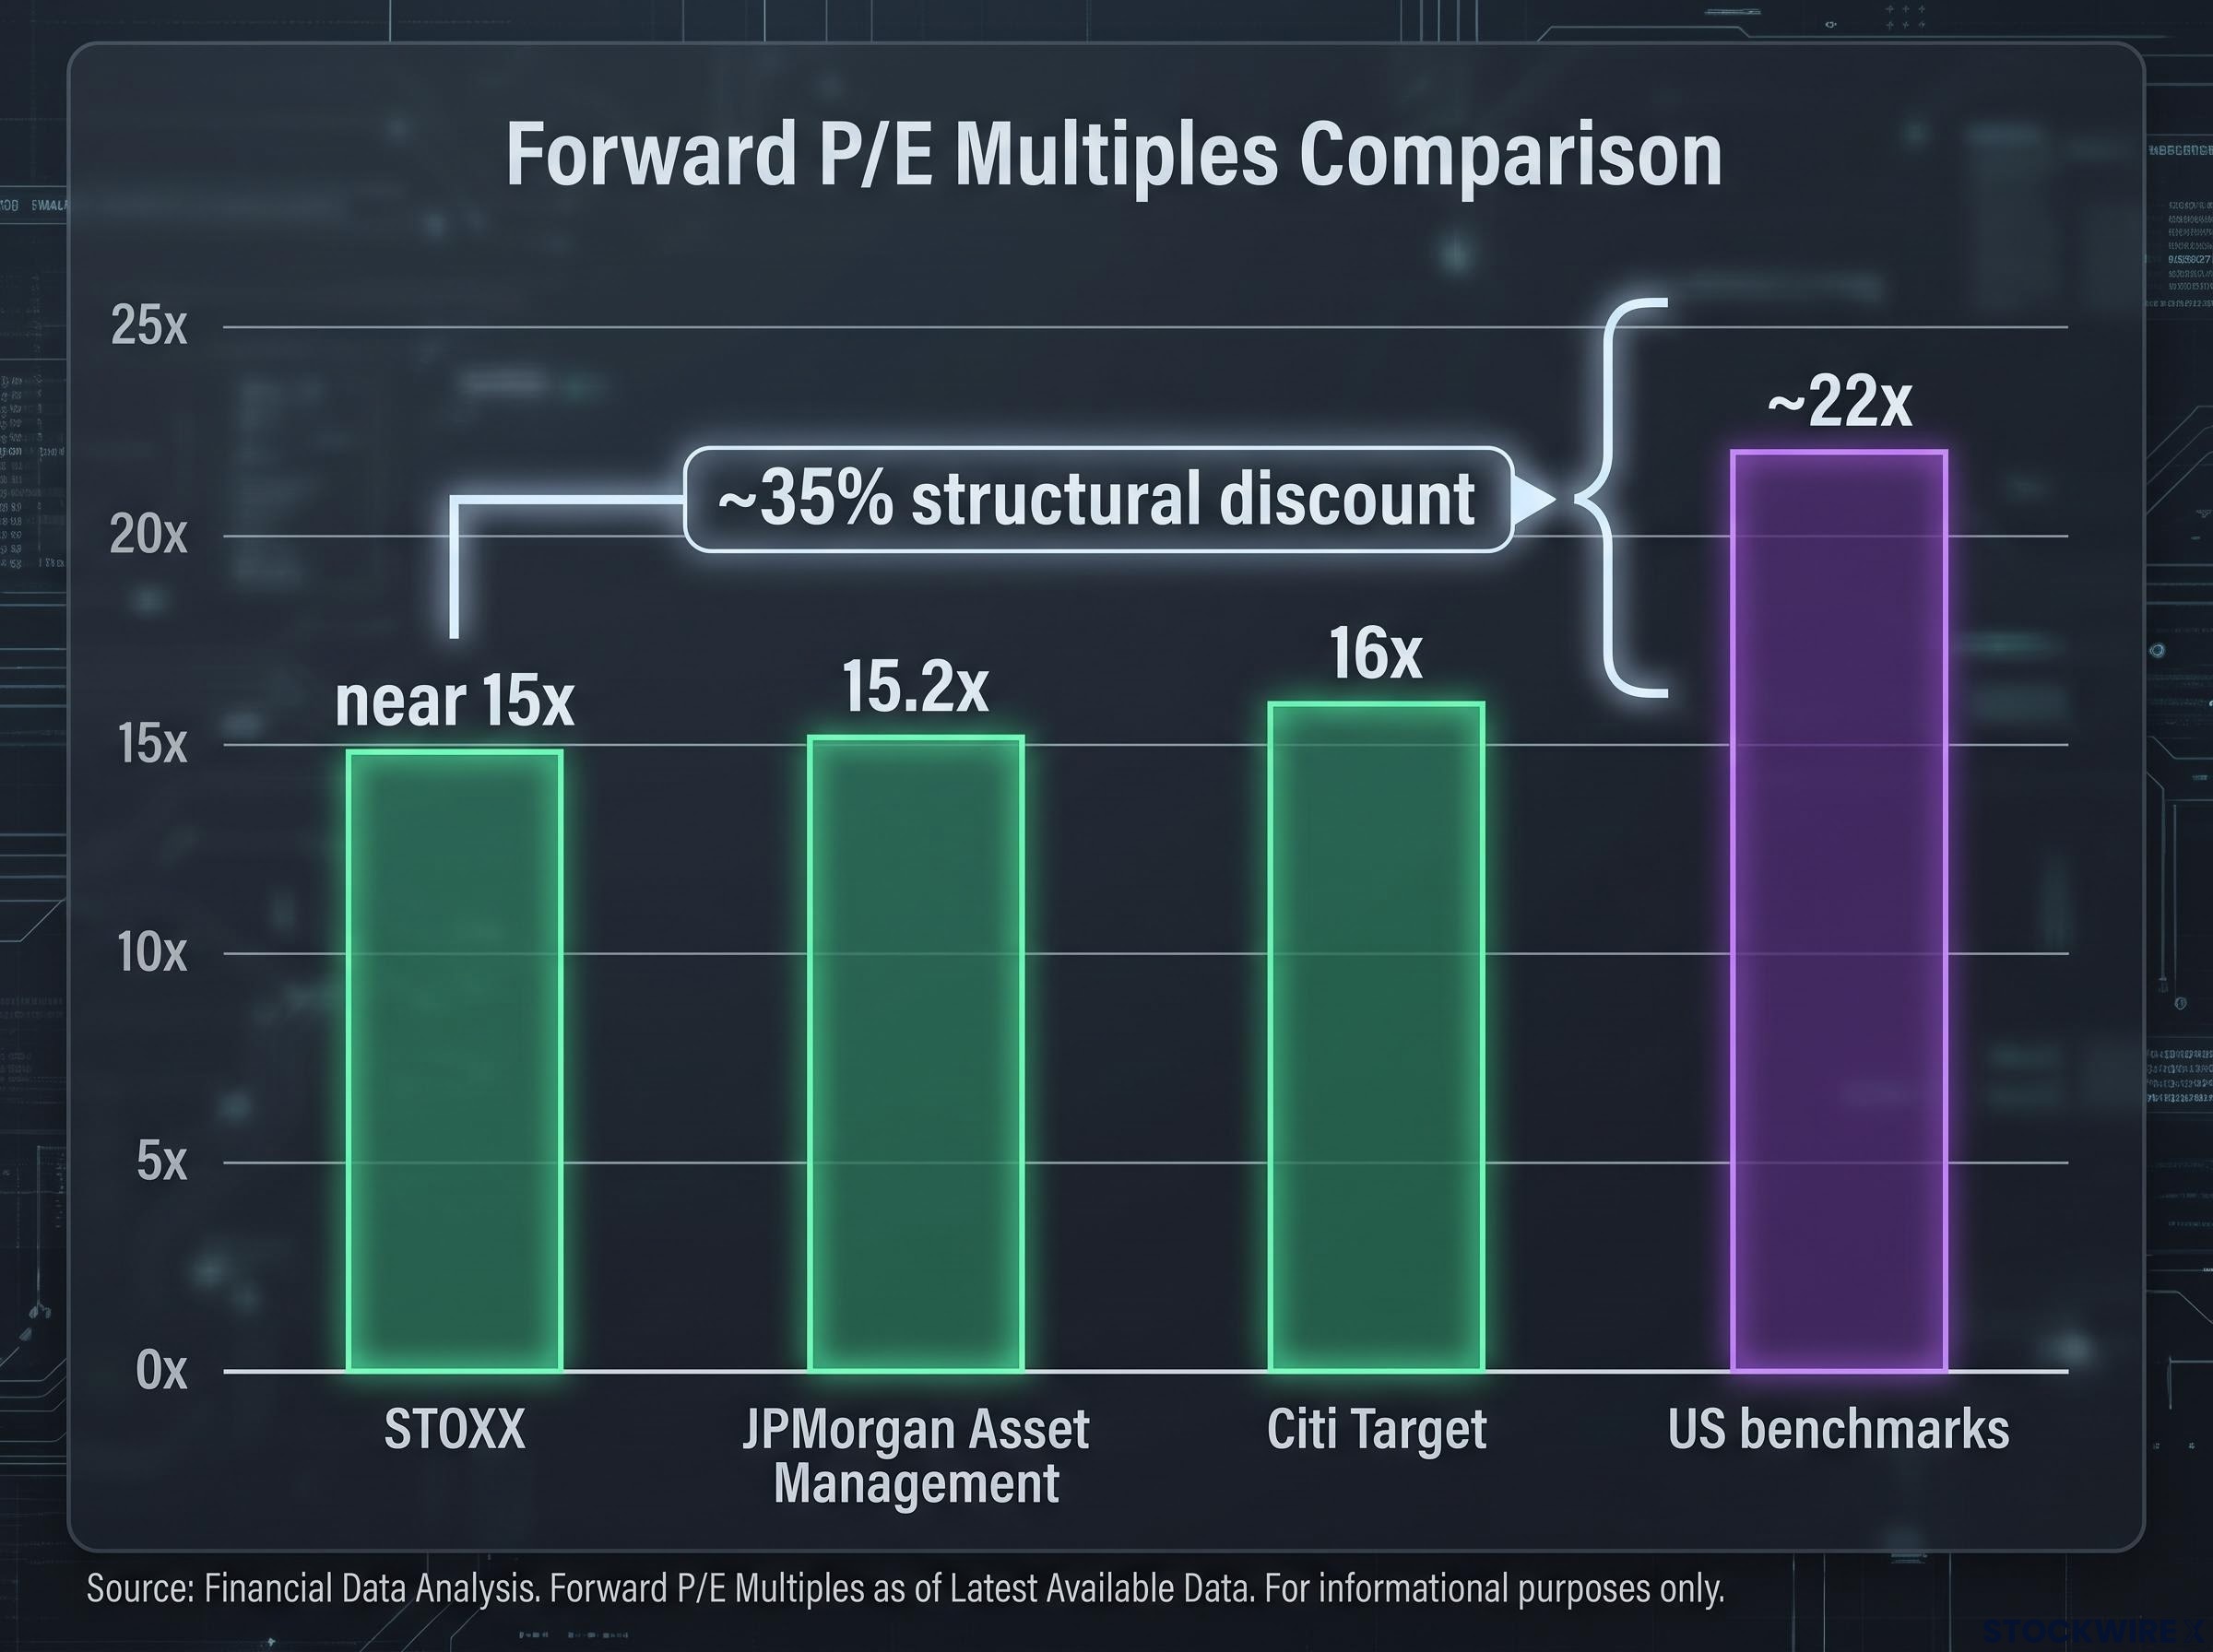
That spread between 15.2x and 16.0x is not a data error. It is evidence that the market itself has not reached consensus, which means the gap you came here to understand is still live and still investable. One reading says the re-rating is essentially done; the other says it is arriving in real time.
The institutional underweight in European equities adds a second layer to the re-rating story: the June 2026 BofA Global Fund Manager Survey showed European equities at their most underweight since December 2024, meaning a large pool of latent institutional demand has not yet moved into the market even as the forward multiple approaches Citi’s 16x target.
Context matters for the ceiling. STOXX puts major European indices near 15x against roughly 22x for US benchmarks, an approximate 35% discount.
Even at 16x, Europe would still trade around 35% below US benchmarks, closing the gap to its own history without touching the structural discount to the US.
The structural pressure, meanwhile, has not eased. The Q2 2026 EU-China deficit widened again to €103 billion, up from roughly €98 billion the prior quarter. So the forcing function that started this whole thesis is still building even as the multiple approaches Citi’s target, which is precisely why the verdict stays open.
What needs to be true for the re-rating to complete
This is not a question analysis can settle, because the deciding variables are policy-dependent, not analytically determinable. What analysis can hand you is a monitoring framework, so you avoid the trap of treating a partial re-rating as either full confirmation or outright refutation. Three observable variables will decide it:
- The EU-China deficit trajectory. The Q2 2026 baseline is €103 billion. Watch whether it stabilises or keeps widening. A stabilisation supports the thesis that policy is starting to bite; continued widening feeds the too-little-too-late objection.
- The EU-US tariff status after August 2026. The suspension of EU retaliatory measures against the US expires that month. A new transatlantic front opening would put the IMF’s 0.4-0.8 percentage point growth drag back in play at exactly the index level where it hurts most.
- Policy execution credibility. The 172 measures are in place. The open question is whether they produce visible earnings-per-share improvement in the protected sectors by the next earnings cycle, which is what separates a durable re-rating from a cyclical bounce.
Put together, the signal is straightforward to read. If the forward multiple pushes convincingly above 16x while the deficit stabilises and protected sectors show EPS gains, the structural re-rating is underway. If the deficit keeps widening past €103 billion while the multiple stalls below 15.5x, the bull case has not translated into pricing.
Country-level selectivity within Europe complicates any index-level re-rating verdict: Spain’s 3.5% GDP growth and Sweden’s outsized equity returns over the past decade demonstrate that the Citi 16x call on MSCI Europe as a whole may obscure meaningful dispersion between member states that a single forward P/E cannot capture.
This article is for informational purposes only and should not be considered financial advice. Investors should conduct their own research and consult with financial professionals before making investment decisions. Past performance does not guarantee future results, and these forward-looking statements are speculative and subject to change based on market developments and policy decisions.