Eleven of twelve Federal Reserve districts reported growth in the latest Beige Book, and the word Wall Street reached for was “modest.” That word is doing a lot of work right now.
The July 2026 Beige Book, prepared by the Chicago Fed from information gathered on or before 6 July 2026 and released on 15 July 2026, arrives while investors are trying to hold two contradictory readings in mind at once.
One is an economy that is still expanding. The other is an input cost environment in manufacturing and construction that is squeezing margins and keeping inflation stickier than the headline figures let on.
The report is not a market-moving release in the conventional sense. Its qualitative texture, though, often exposes what the hard numbers gloss over.
This piece unpacks the Beige Book layer by layer, from the headline growth characterisation through to the cost pressures and the contested question of what it all means for the Fed’s next move. The aim is to give you a sharper read on which signals here deserve weight, and which ones invite you to over-interpret.
What the Beige Book actually said about growth and hiring
The headline looks deceptively stable. But stability at the national level hides a set of genuinely different regional stories underneath it.
Eleven of twelve Federal Reserve districts reported slight-to-moderate economic growth in the July 2026 Beige Book.
One district reported no change at all. The value in that distribution is not the central tendency; it is the spread. A composite verdict of “slight to moderate” is really twelve separate readings pointing in loosely similar directions at different speeds.
Employment is where the picture gets honest. Hiring edged up only marginally on balance, with wage gains described as modest to moderate. The district-level count is contested in the sourcing: a conservative reading puts seven districts at little to no employment change, while a more optimistic reading counts five districts with modest, moderate, or solid gains.
Even the generous version leaves the majority of the country close to flat on jobs. That matters. When most districts are not adding workers, businesses are managing cautiously rather than investing for expansion, and that caution tends to lead corporate earnings guidance rather than follow it.
Wages returning to a “modest to moderate” pace also reads differently than it would have in 2022 or 2023. Back then, wage growth was a symptom of an overheating labour market. Now it sits inside a cooler picture, closer to normal than to alarming.
Here is how three confirmed districts break down:
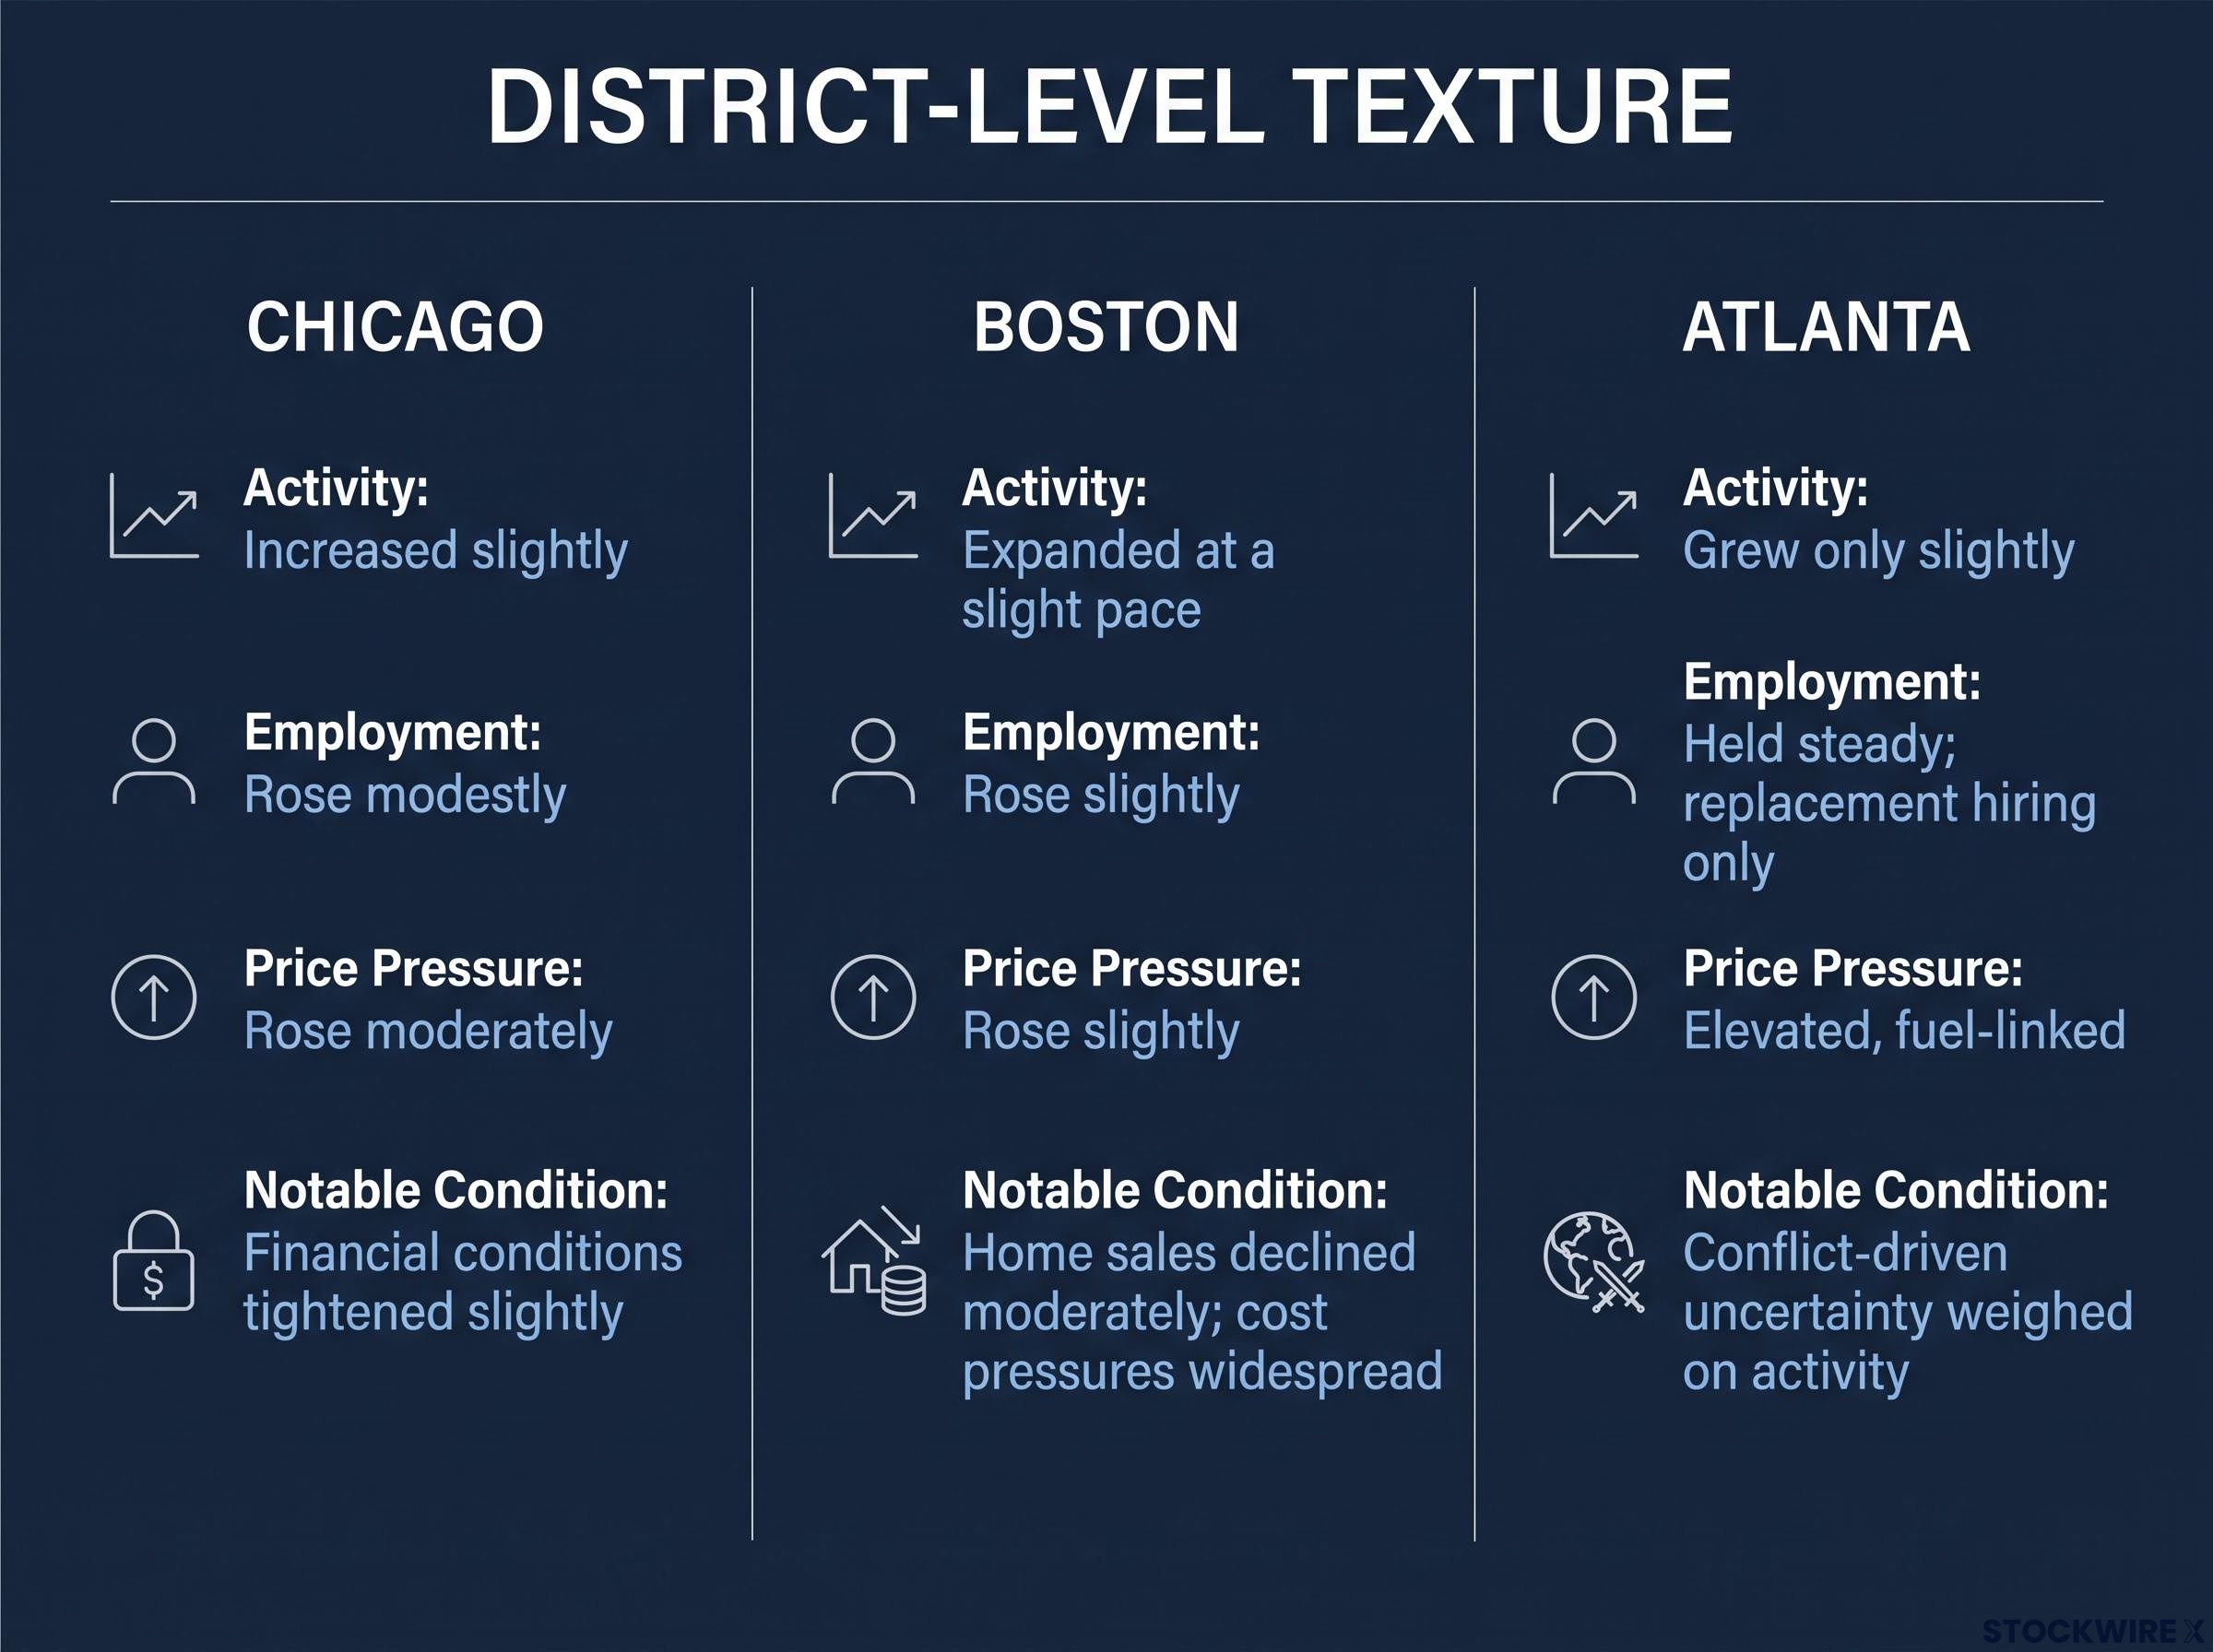
| District | Activity Level | Employment | Price Pressure | Notable Condition |
|---|---|---|---|---|
| Chicago | Increased slightly | Rose modestly | Rose moderately | Financial conditions tightened slightly |
| Boston | Expanded at a slight pace | Rose slightly | Rose slightly | Home sales declined moderately; cost pressures widespread |
| Atlanta | Grew only slightly | Held steady; replacement hiring only | Elevated, fuel-linked | Conflict-driven uncertainty weighed on activity |
The district-level texture is where the Beige Book earns its keep:
- Chicago: activity up slightly, manufacturing demand up moderately, financial conditions tightening at the margin.
- Boston: slight expansion with mixed real estate, home sales down moderately, and cost pressures described as widespread.
- Atlanta: most sectors growing only slightly, firms holding headcount steady and hiring mostly to replace departures.
Read this way, “modest” stops being a single verdict and becomes a map. It shows where the economy is still carrying momentum and where it has quietly stalled, which is far more useful to you than the national summary on its own.
When big ASX news breaks, our subscribers know first
Where cost pressures are coming from, and why they are not going away
The cost story in this report is not a list of unrelated inputs. It is a stack of compounding forces, and understanding it as a system explains why these pressures look structurally sticky rather than cyclically temporary.
Non-labour input costs rose across services, construction, and manufacturing, driven by energy, raw materials, transportation, and petrochemicals. That is a multi-source problem. No single catalyst turns it off.
The three pressure sources sit in a clear hierarchy:
- Energy and geopolitics: conflict in the Middle East disrupted shipping through the Strait of Hormuz, lifting freight and crude costs that feed straight into manufacturing and construction.
- Tariffs and trade policy: duties on metals and construction materials add a cost layer that can persist regardless of what happens overseas.
- Structural demand and supply constraints: intense demand from data centres, healthcare, and infrastructure buildout is colliding with constrained supply of electrical equipment and metals.
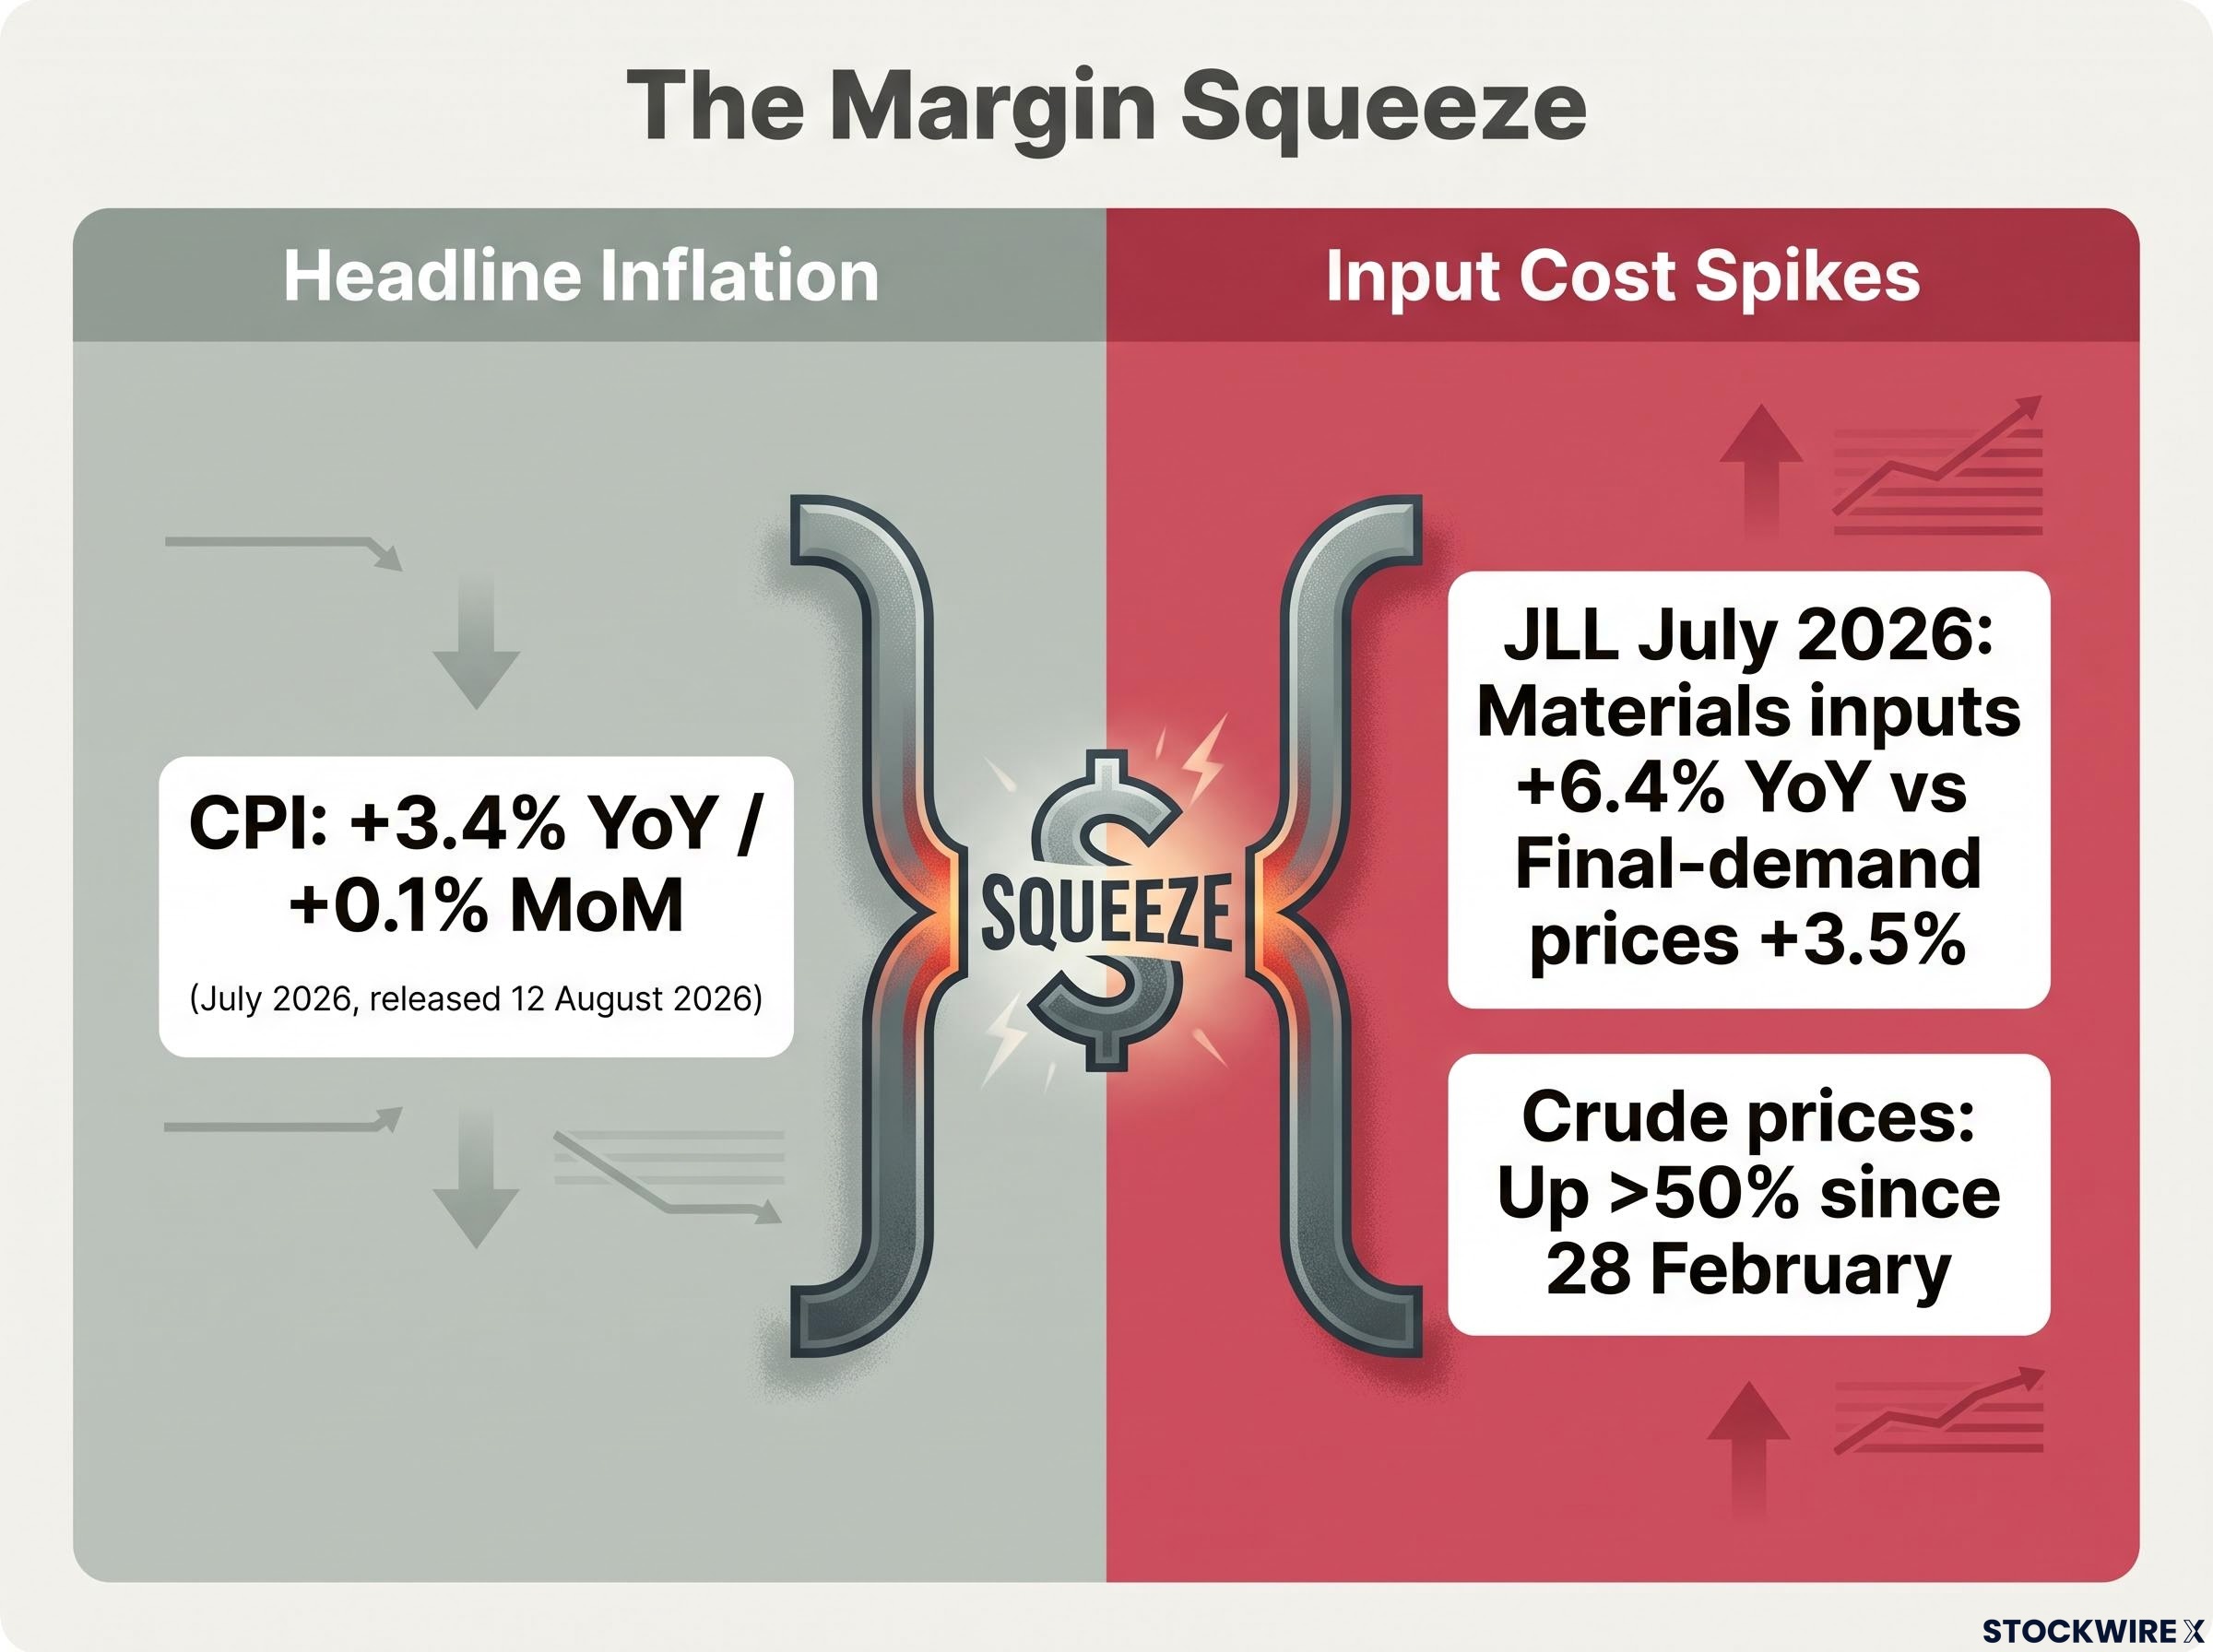
Headline inflation, by contrast, looks tame. The Consumer Price Index rose just 0.1% month-over-month in July 2026 and 3.4% over the year, according to the U.S. Bureau of Labor Statistics release on 12 August 2026. The gap between that cooling headline and the widespread cost complaints in the Beige Book is the tension worth sitting with.
A July 2026 JLL mid-year construction perspective reports that materials inputs at the goods level rose 6.4% year-over-year while final-demand prices rose only 3.5%, though this figure has not been independently confirmed.
When input costs climb faster than the prices firms can charge, margins compress. That is not just a sector footnote. It signals a structural ceiling on earnings recovery in these industries even while revenues grow modestly, and it is the reason cost data can matter more to you than the top-line growth line.
Geopolitical and energy-linked cost drivers
The Strait of Hormuz disruption is the transmission mechanism here. Reports indicate crude prices rose more than 50% since the conflict began on 28 February, though this figure is unverified, and that flows into higher energy and freight costs for goods producers.
The Strait of Hormuz closure that began on 28 February introduced a cost transmission mechanism that runs well beyond crude prices, lifting freight, petrochemicals, and energy inputs simultaneously across goods producers who have limited ability to pass those costs on in a softening demand environment.
Chemical producers surveyed by the Institute for Supply Management (ISM) flagged repeated price spikes tied to crude and polyethylene resin. That is the crisis showing up not in headlines but in specific line items on manufacturers’ invoices.
Tariff and trade policy cost drivers
The tariff layer is separate and, crucially, policy-contingent. TaxCreditAdvisor estimated in January 2026 that longer-term tariff impacts on construction materials range from 5% to 25%, an unverified figure, with copper, steel, and aluminium costs cited as rising sharply.
Roughly 70% of contractors are reported to have been affected by tariffs, again unverified. What makes this risk distinct is that it could persist, or deepen, even if the geopolitical picture stabilises. Two independent cost engines, one policy, one conflict, is a harder thing to price out.
How to read business sentiment when the signal is this uneven
Most investors treat the Beige Book as a “sentiment report” and leave it there. Understanding its structural quirks is what lets you use it precisely rather than reactively.
Start with what it is and is not. The Beige Book is a qualitative, anecdotal survey of business contacts across the twelve districts. It is not a statistically representative data release like the monthly jobs report or GDP, which is exactly why its “modest growth” language should be read as texture, not measurement.
Then there is the coverage bias, and it is a big one. The report leans heavily on cyclical sectors such as manufacturing and construction, the industries that historically flag downturns first, while giving thinner coverage to technology and services.
That skew matters for your positioning. If you read the report without adjusting for it, you may systematically underweight the parts of the economy that have actually driven this expansion, and drift into defensive positioning the broader data does not warrant.
A simple three-point framework keeps you honest:
- What it is: a qualitative read on business conditions, useful for direction and theme, not for precision.
- What it misses: the growth engines of tech and services, because its lens tilts toward cyclical industries.
- How to weight it: as a leading-edge layer that validates or challenges the hard data, never as a standalone signal.
The research backs the caution.
Dallas Fed Beige Book research published in May 2025 found that the report’s implied growth readings have historically run slower than actual GDP and employment outcomes, a structural bias that makes strong rate-path inferences from its narratives particularly unreliable.
Dallas Fed research from May 2025 found that Beige Book-implied growth has historically run slower than actual GDP and employment, cautioning against strong rate-path inferences from its narratives alone, though this finding has not been independently confirmed.
A St. Louis Fed article from January 2025 adds a useful nuance, also unverified: Beige Book sentiment indexes improve short-term recession-forecasting models when combined with financial indicators, and the added value is strongest at the district level rather than in the national summary.
The Atlanta Fed’s April 2026 reading illustrates the texture, again unverified: wage increases returned to pre-pandemic norms of 2% to 4%, with faster growth confined to healthcare, warehousing, and skilled trades. Treat that as one anecdote among many, not a verdict. Recurring themes across districts carry the signal; individual quotes do not.
What the modest-growth verdict means for the Fed’s rate path
Here is where reasonable analysts split, drawing opposite conclusions from the same evidence.
Internal Fed disagreement over the rate path has been unusually visible in 2026, with four dissenting votes at the April FOMC meeting representing the most committee division since 1992, a fracture that amplifies the analytical stakes of every qualitative signal the Beige Book releases into the debate.
The soft-landing camp reads the report as stabilisation. Modest growth plus a cooling headline CPI at 3.4% looks, on this view, like an economy settling rather than deteriorating. TD Economics argued in a January 2026 analysis, unverified, that contained price pressures and mostly unchanged employment are consistent with the Fed holding a cautious, steady path rather than pivoting in either direction.
The stagnation camp reads the same lines as warning signs. Seven districts with little to no employment change, layered onto margin-compressed manufacturing and construction, points to underlying softness. The Small Business & Entrepreneurship Council characterised “little or no change” districts as signalling a stagnant economy in a September 2025 note, unverified, and an Investopedia analysis from October 2025, also unverified, argued that a stalled job market gives the Fed room to cut rates to support employment, prioritising labour risk over inflation risk.
| Interpretation | Beige Book signals drawn on | Policy implication |
|---|---|---|
| Soft landing | Slight-to-moderate growth in 11 districts; CPI cooling to 3.4%; contained price pressures | Fed holds a cautious, steady path; no urgent pivot |
| Stagnation concern | Seven districts with little to no employment change; margin-compressed sectors | Fed may weight labour risk over inflation risk; room to cut |
So which way does it tip? The evidence does not resolve it, but it does point to the specific configuration worth watching.
The Chicago Fed reported that financial conditions tightened slightly in the July 2026 Beige Book.
That detail is the pivot. Tightening financial conditions in a major district, sitting alongside persistent above-target input costs, is the combination that most constrains the Fed. It is the one scenario where cutting risks reigniting inflation, which is precisely why it deserves your attention over the softer growth headline.
ISM respondents reinforce the cost side, with unverified survey expectations of input costs up 4.2% and labour and benefit costs up 4.8% across 2026. For anyone holding rate-sensitive positions across fixed income, equities, or real assets, the takeaway is that the Beige Book feeds the rate debate in both directions. Knowing which component signals each camp leans on lets you anticipate how markets may swing when the next hard data release either confirms or breaks the qualitative read.
Three variables that will determine whether modest becomes something worse
The most useful thing you can take from this report is not a conclusion. It is a watchlist for the weeks before the next Beige Book cycle.
Three variables, in order of analytical weight:
- Energy price trajectory. Watch crude and freight tied to the Strait of Hormuz situation. A sustained pullback eases the cost stack and strengthens the soft-landing read; renewed escalation deepens the margin squeeze and tilts toward the overheating risk that boxes in the Fed.
- The next ISM prices-paid reading. Compare it against the reported four-year high hit in April 2026, an unverified benchmark. Holding near that high tells you cost pressure is structural, not transitional; a clear step down would validate the cooling headline CPI.
- District employment distribution. The baseline is seven districts at little to no change. If the next report shows more districts slipping toward flat, the stagnation case gains ground; a broadening of hiring would blunt it.
Watch the combinations, not the readings in isolation. If prices-paid holds near its April high while employment stays skewed toward little or no change, the configuration becomes much harder for the Fed to describe as transitional. If you hold rate-sensitive assets, that is the scenario to be positioned for now, not after the fact.
Private domestic demand accelerated to 3.9% annualised in Q2 2026, its strongest reading since Q1 2023, a figure that sits in direct tension with the Beige Book’s picture of cautious hiring and margin-compressed manufacturers, and the gap between those two readings is where the forecasting risk for H2 2026 is concentrated.
One last discipline. The Beige Book’s value is qualitative texture, not quantitative precision. Used correctly, it is an early-warning layer sitting on top of the hard data calendar, with CPI at 3.4% as your current inflation anchor. Used as a substitute for that calendar, it is, by its own designers’ admission, an instrument that tends to understate actual growth.
This article is for informational purposes only and should not be considered financial advice. Investors should conduct their own research and consult with financial professionals before making investment decisions. Past performance does not guarantee future results, and financial projections are subject to market conditions and various risk factors. Certain figures cited above are drawn from sources that have not been independently verified and are noted as such.