
The week before a high-volatility stock reports earnings, the near-term options on that stock can carry implied volatility two to three times higher than options expiring just a few weeks later. Most traders never notice the gap because they are busy picking a direction, not reading the volatility structure sitting right in front of them.
That structure matters more now than it did even a year ago. Since Nasdaq’s 26 January 2026 expansion of Monday and Wednesday expirations for high-volume names like Apple, Nvidia, Tesla, and Microsoft, you can now target a two-day or three-day front leg that lands precisely on the announcement window, a precision that was structurally impossible when only monthly expirations existed. This is not a theoretical refinement. It changes the premium-to-risk ratio of the entire trade.
After reading this, you will understand exactly how the term-structure inversion around earnings creates the opportunity, how to construct and manage the spread, and what changed in the options market that makes this approach viable now at premium levels once reserved for institutional-sized positions.
Why near-term implied volatility spikes before earnings (and why it matters)
Pull up an options chain the week before earnings on a name you follow, and you will see something that looks wrong. The options expiring right after the announcement carry a far higher implied volatility number than the ones expiring a month later. That is backwards from how options usually price.
Under normal conditions, the volatility curve slopes gently upward. Longer-dated options carry slightly higher implied volatility because more time means more uncertainty. This is called contango, and it is the default shape of the curve when nothing dramatic is scheduled.
Reading implied volatility on any options chain as a real-time measure of collective market expectation, rather than a directional signal, is the foundational skill that makes the inversion visible in the first place; without that frame, a front-leg IV of 40% versus a back-leg IV of 28% looks like noise rather than a structural opportunity.
An earnings announcement breaks that shape. When a scheduled report falls inside a specific expiration window, that expiration has to price in the full binary jump risk of the event: the stock could gap up, gap down, or barely move, and nobody knows which. All of that uncertainty gets concentrated into the nearest expiration that fully contains the announcement, which inverts the curve locally.
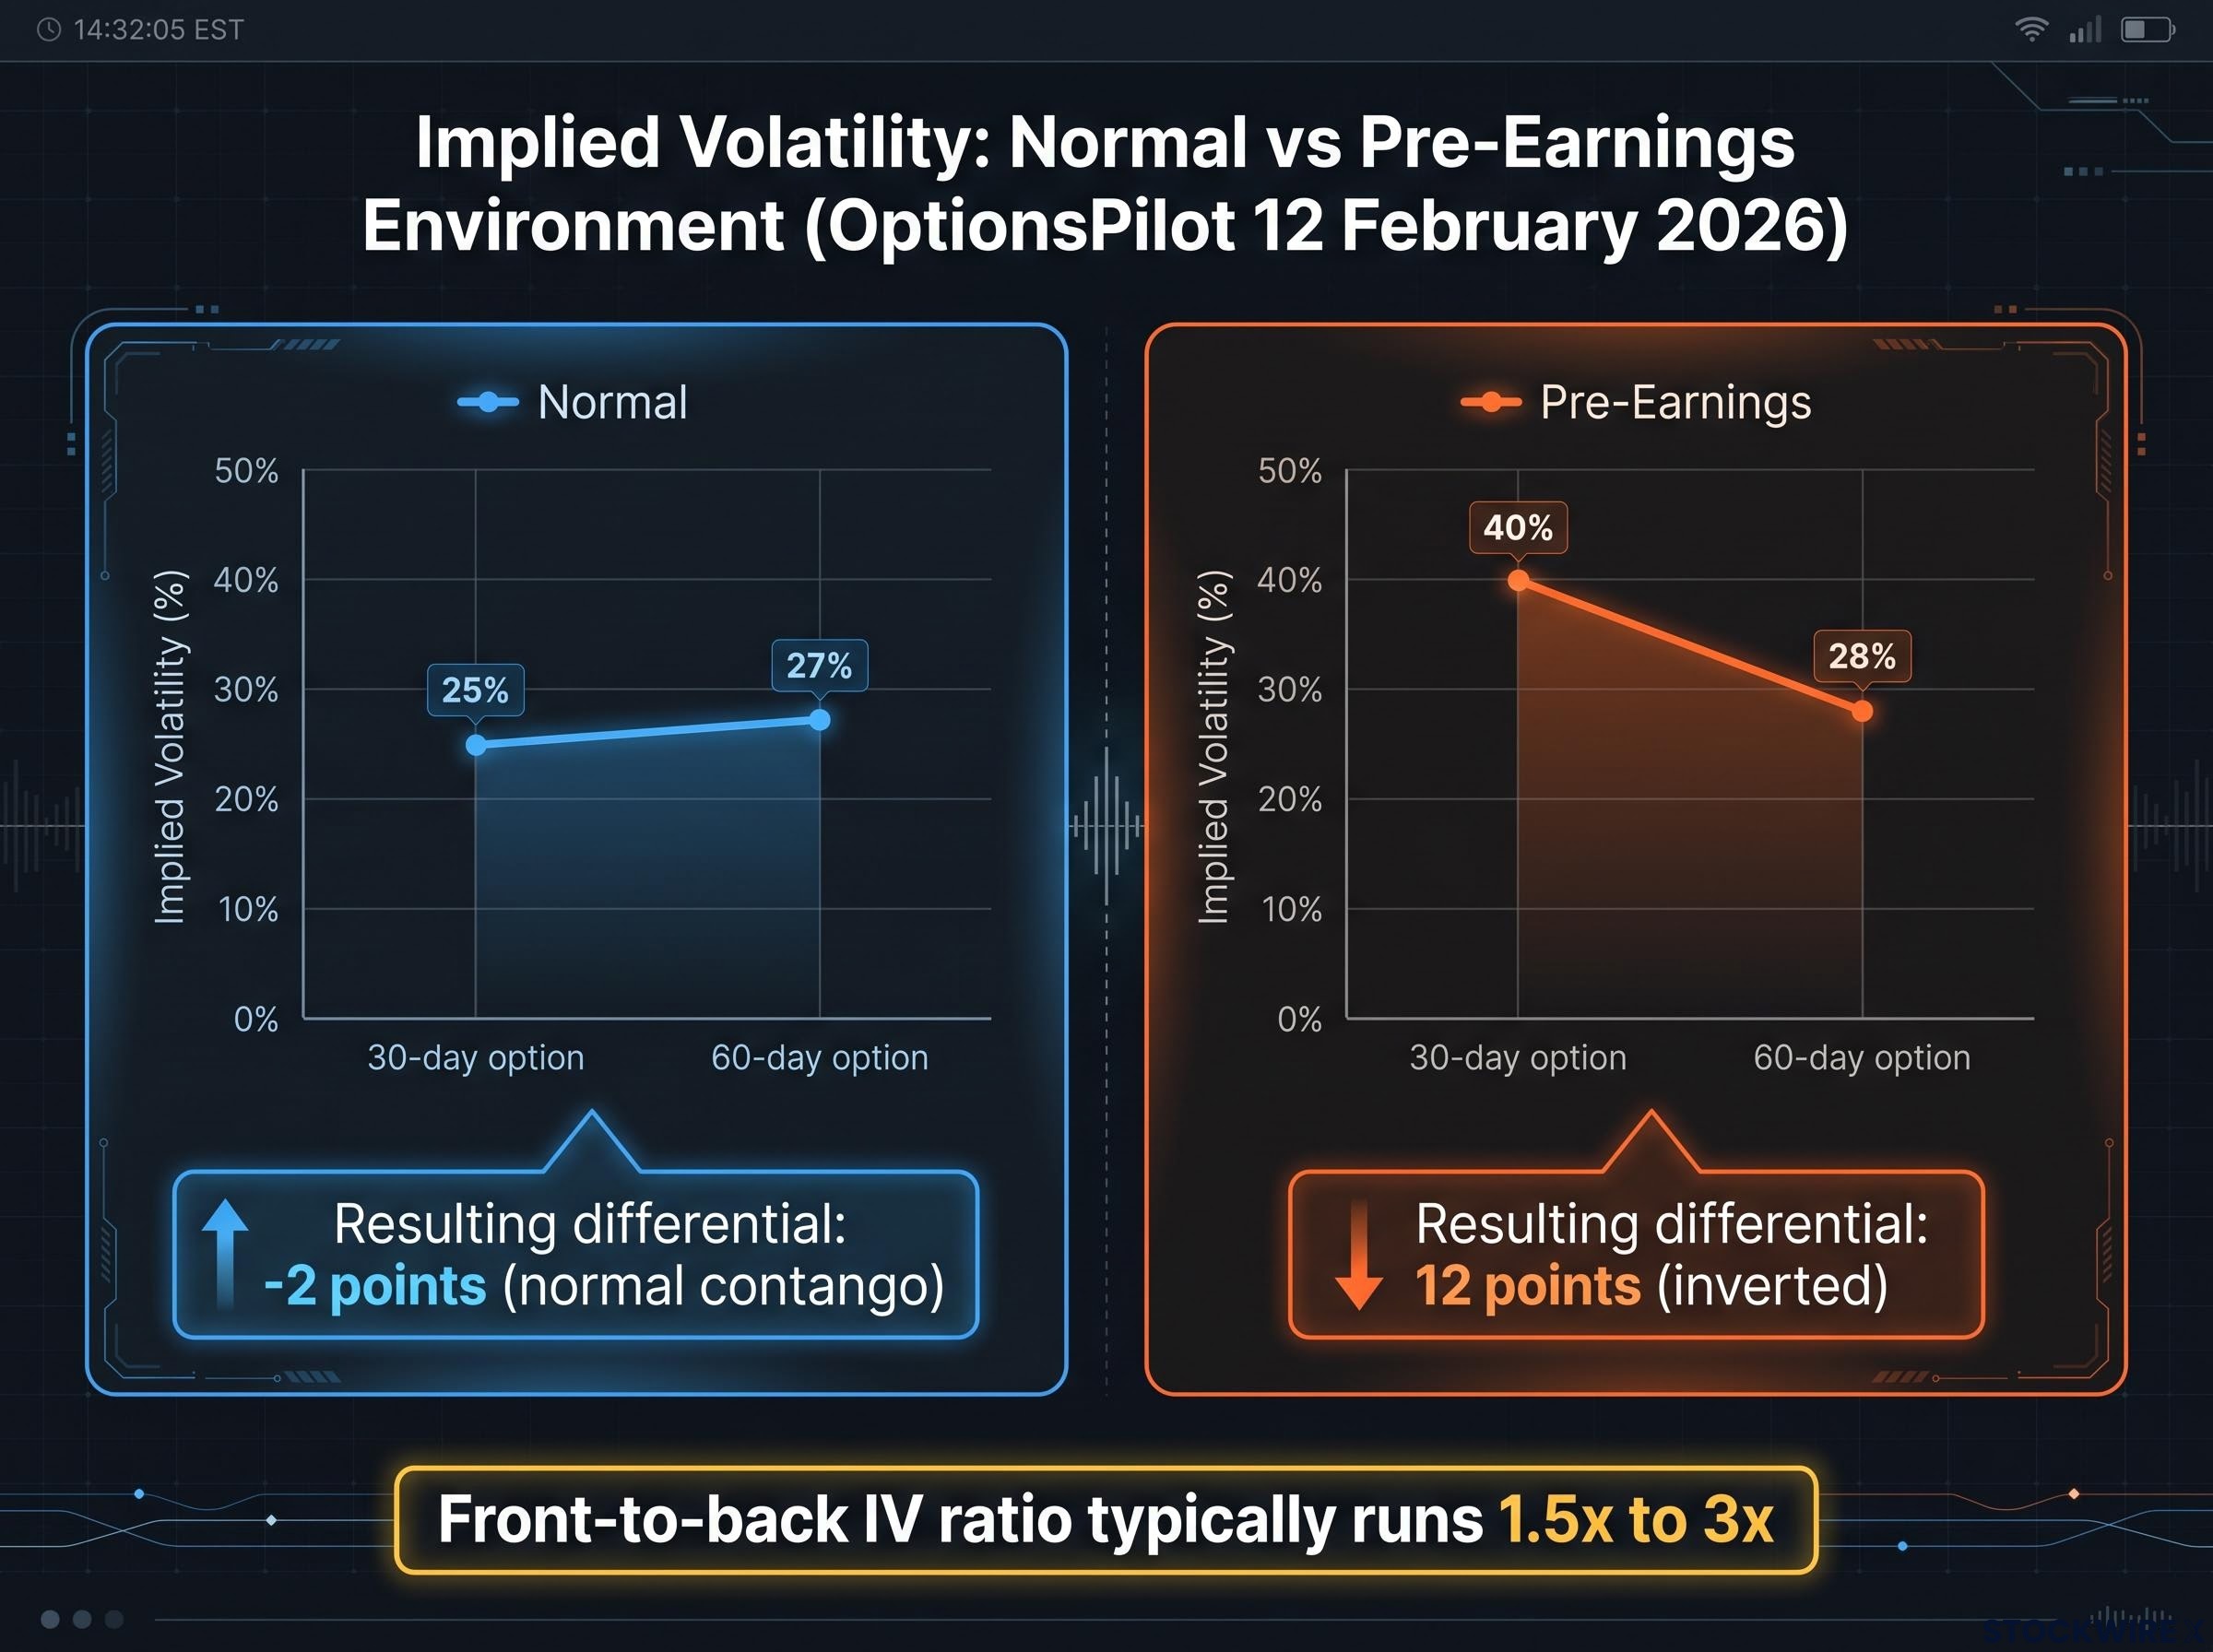
Here is the stylised comparison from OptionsPilot’s 12 February 2026 analysis, which makes the inversion concrete.
| Implied volatility | Normal conditions | Pre-earnings environment |
|---|---|---|
| 30-day option | 25% | 40% |
| 60-day option | 27% | 28% |
| Resulting differential | -2 points (normal contango) | 12 points (inverted) |
The near-dated option jumps because it alone bears the event. The longer-dated option barely moves because the event is a small fraction of the time it covers.
This is not a market inefficiency you are exploiting through cleverness. It is a structural pricing consequence of hedging demand and event-specific jump risk being assigned to the one expiration that fully contains the report.
Practitioner sources including Stryke, Menthorq, and OptionsPilot document how far this can stretch depending on the stock, the size of the expected move, and how tightly the front-leg expiration aligns to the announcement date.
The front-to-back IV ratio at earnings typically runs 1.5x to 3x. The steeper that ratio, the more structurally attractive the setup, because the near-dated option you would sell is inflated relative to the longer-dated one you would hold.
Across most large-cap names, the point differential between the short-dated earnings expiry and neighbouring 9-30 DTE expirations that do not fully include the event lands somewhere between 10 and 20 volatility points.
What this means for you is a shift in how you read the chain. The IV differential is not a signal to bet on direction. It is a structural feature you can potentially harvest by positioning on the volatility structure itself, evaluating the setup analytically rather than guessing which way the stock jumps.
When big ASX news breaks, our subscribers know first
How to build a calendar spread around an earnings announcement
Once you can see the inversion, the trade almost designs itself around a single problem: how do you capture that inflated near-term premium without giving up your exposure to the move you actually want?
The answer is a two-leg structure. You sell the near-term expiration, targeting two to three days after the announcement, to capture the elevated front-leg implied volatility. At the same time, you buy a longer-dated contract at the same strike, which keeps you in the position beyond the announcement.
Strike selection follows from your view. Centre the strike at or near the current stock price for a neutral calendar. Shift it slightly higher or lower for a bullish or bearish lean, but keep the short leg within the expected-move range so a normal-sized reaction does not blow through it.
Here is the construction sequence.
- Identify the exact earnings date and confirm which expirations bracket it.
- Select the back-leg expiration and strike, using a slightly longer-dated contract you are comfortable holding.
- Sell the front leg at the same strike, targeting a two-to-three-day post-announcement expiry.
- Monitor the front-leg implied volatility collapse once the report lands.
- Reach a decision point on repurchasing the short leg.
The dollar amounts involved can be genuinely small. The original practitioner source describes a SNOW trade built across four strikes: 330, 340, 350, and 360, using nine-day contracts for the long legs with two-day calls sold against each.
Implied volatility crush is the mechanism that resolves the inversion: once the earnings report is released, the uncertainty that inflated the front-leg IV is extinguished in a single session, collapsing the near-term option’s extrinsic value far faster than any equivalent move in the longer-dated leg.
Individual long options were priced near $1 each, with potential gains cited at $2 to $3 per contract. Total premium deployed per position ran between $300 and $500.
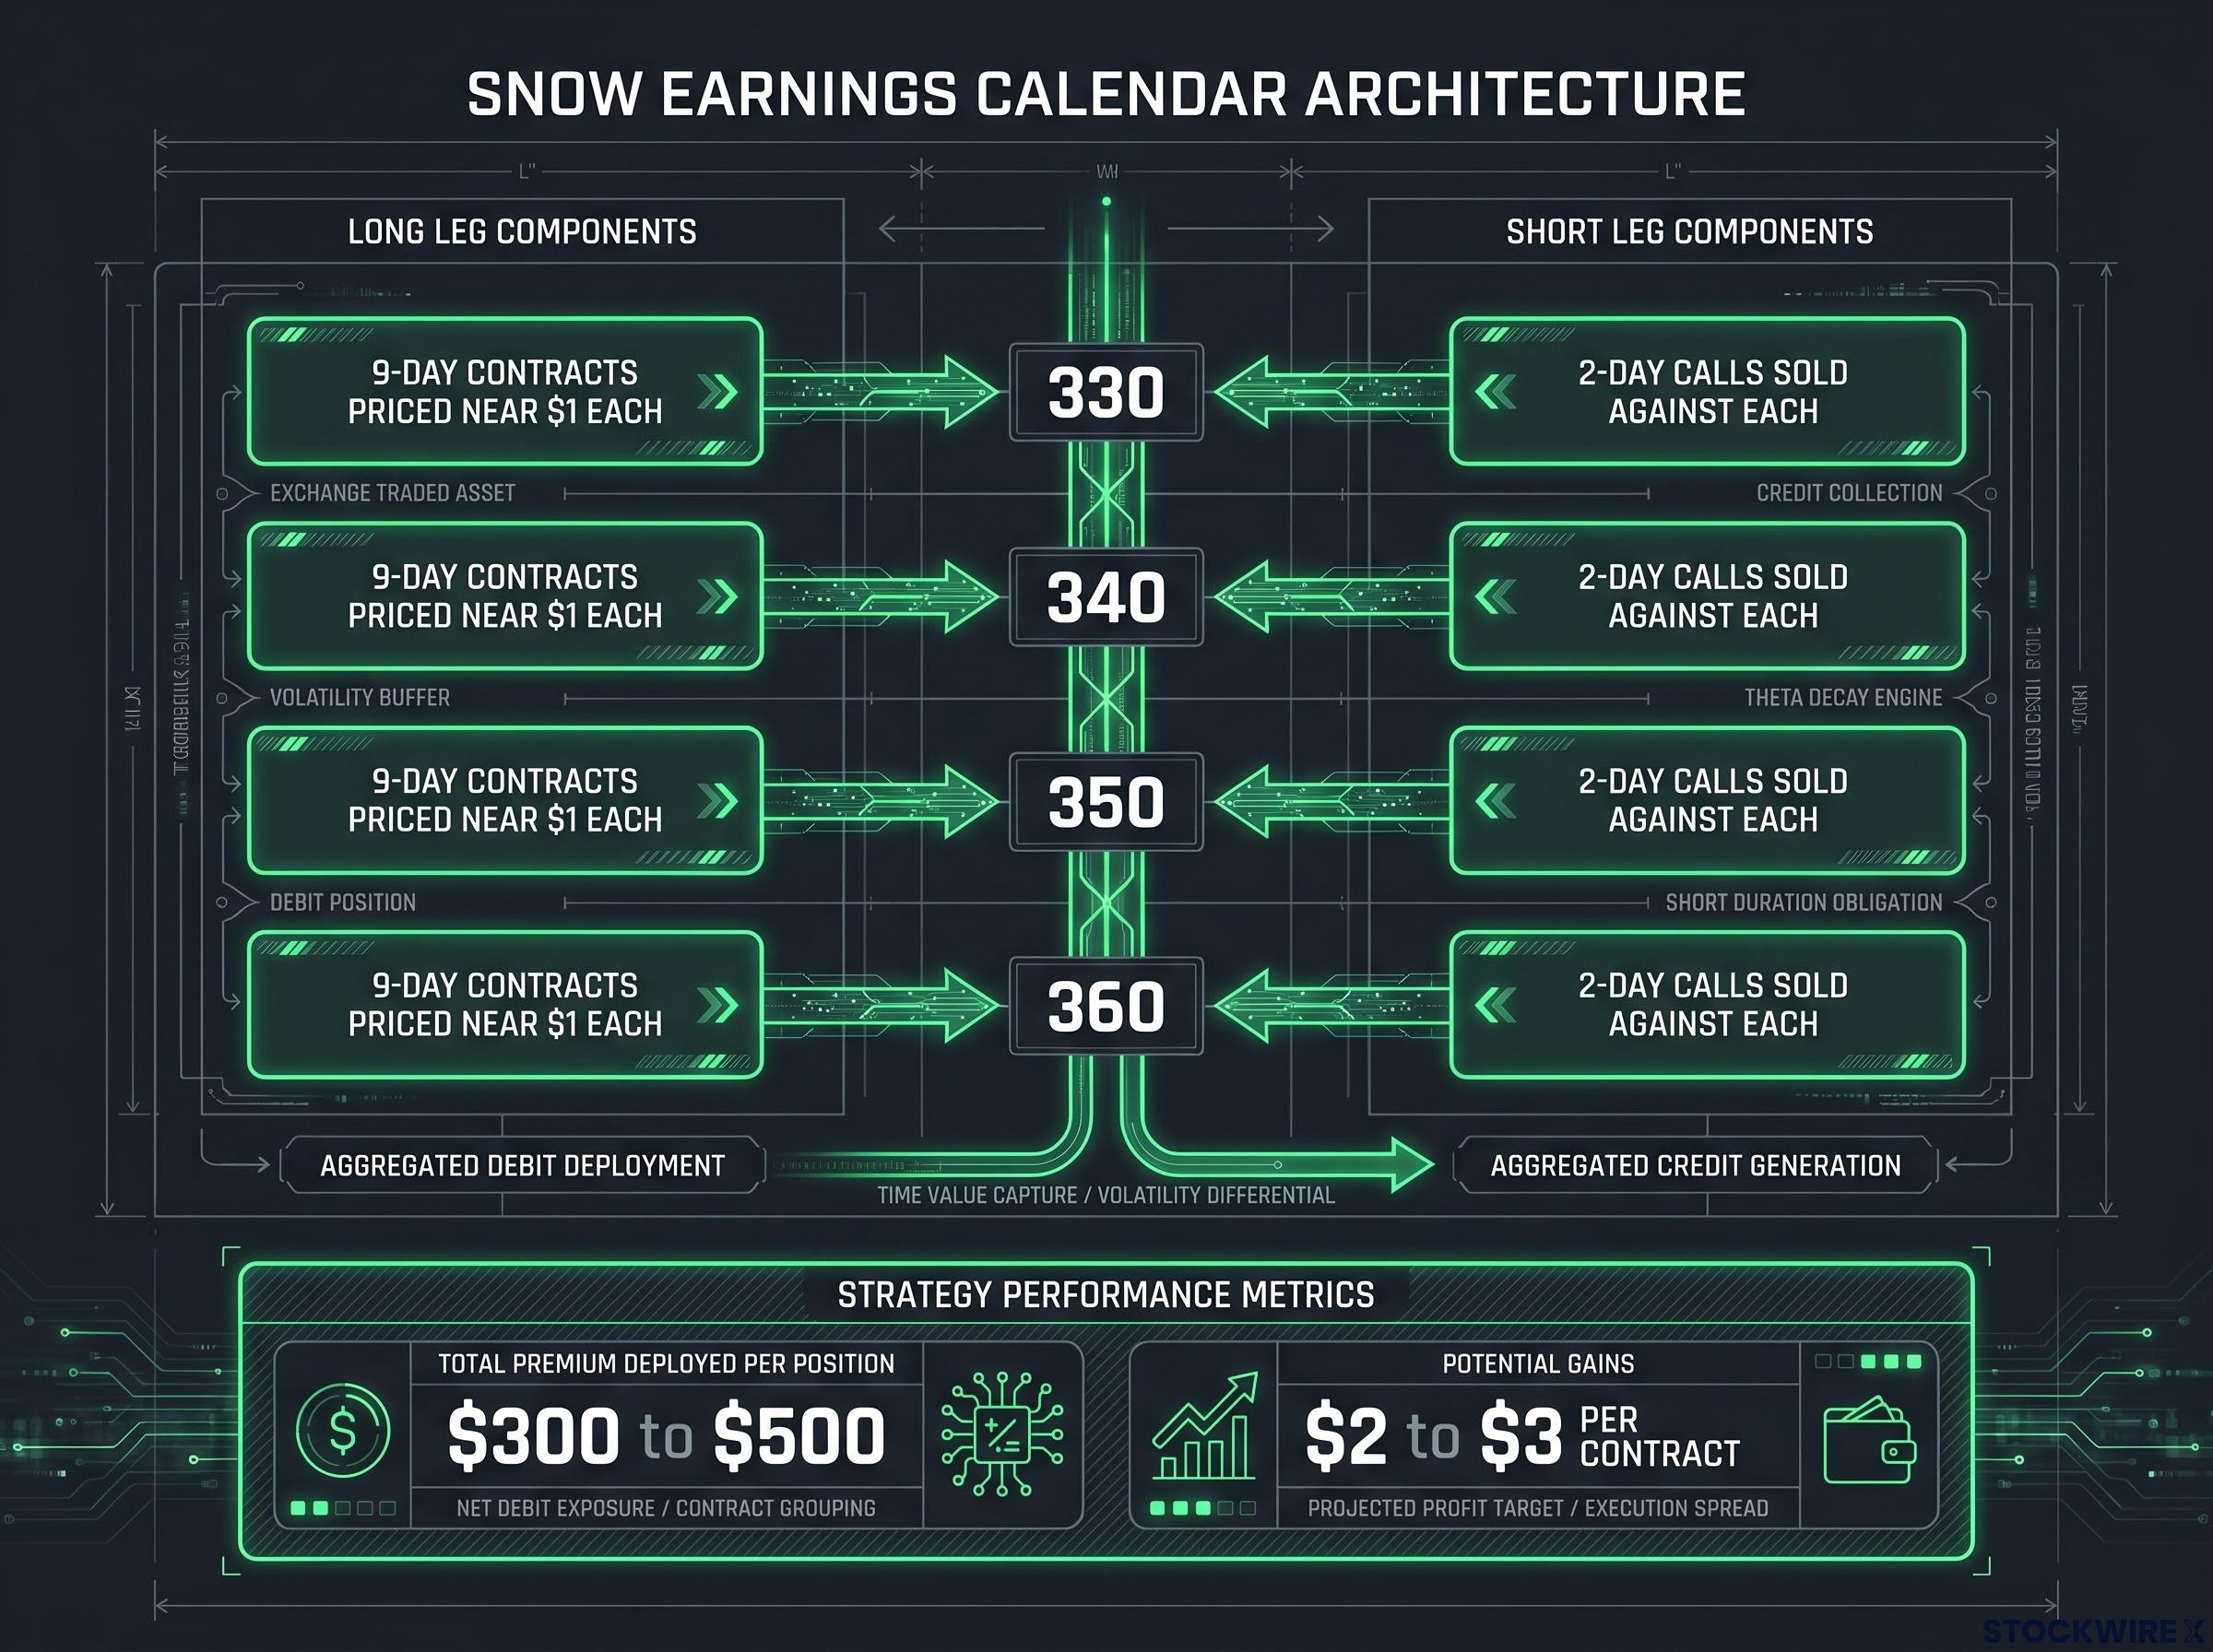
That scale matters more than it first appears. It tells you that the real constraint on applying this approach is not capital access. It is position-sizing discipline, because the whole architecture only works if a total loss on any single position stays within a risk tolerance you set before you enter.
Managing the position after the announcement
The management decision is where the trade is actually won or lost, and it usually resolves within the first trading session after the report. Practitioners monitor front-leg implied volatility and price behaviour intraday on announcement day rather than waiting.
Three scenarios cover most outcomes.
If the IV crush proceeds as expected, repurchase the short leg once you have recovered roughly 70-80% of the cost basis. That threshold, confirmed in the original source and corroborated by Menthorq’s ACES guide, leaves the remaining long position needing only a small move to turn profitable. You then hold or exit the long depending on your bias.
If the stock moves directionally but stays within the expected range, manage it the same way: close the short leg into the volatility collapse and reassess the long.
If the move runs far beyond the expected range, the calculus changes. Evaluate closing the full spread to contain the loss, because the short leg has now become the problem rather than the profit source.
Stryke’s guidance adds a useful option for the survivors. Once implied volatility normalises, you can convert the remaining position into a standalone long or a diagonal structure if a clear directional bias has emerged from the report.
What the short-dated expiration expansion actually changed
None of this precision was available a couple of years ago, and understanding why is what separates a sharp version of this trade from a blunt one.
Under a monthly-only expiration framework, the nearest short leg you could sell after an earnings announcement was often 16 or more days away. That forced you to sell a contract carrying substantial remaining time value, which diluted the front leg and reduced the efficiency of the whole structure. You were approximating the event, not targeting it.
Nasdaq’s 26 January 2026 expansion changed that arithmetic. Under an SEC-approved extension of its Short-Term Option Series Programme, the exchange introduced Monday and Wednesday expirations for select high-volume single-stock names, with the first such expirations occurring in February 2026.
The initial rollout covered four of the most heavily traded names on the market:
- Apple
- Nvidia
- Tesla
- Microsoft
For a reader holding a longer-dated long position around earnings on one of these names, this is the practical shift: your front-leg choice is now a precision instrument rather than a rough approximation. You can target an expiration two or three days after the announcement instead of two or three weeks, and that tightening directly improves the expected edge of the trade.
The comparison below shows what actually changed across the three dimensions that matter.
| Dimension | Monthly-only framework | Multi-expiration framework |
|---|---|---|
| Nearest front-leg expiry after earnings | Often 16+ days out | 2-3 days out |
| Time value in the short leg | Substantial, diluting the capture | Minimal, cleaner capture |
| Precision of event alignment | Approximate | Precise |
This sits inside a much larger structural shift toward short-dated contracts across the US options complex. The scale of it is easy to underestimate.
SPX 0DTE options now represent 59% of all SPX options volume, roughly 2.3 million contracts a day as of mid-2026, according to Cboe data updated 25 August 2026 and corroborated by EBC’s 5 February 2026 summary.
The same trend shows up in index futures. CME Group’s data, updated 23 August 2026, reports that zero-to-five-DTE E-mini S&P 500 volume grew from around 350,000 to 770,000 contracts per day over four years, a 120% increase.
The original practitioner source expects zero-DTE trading across individual names to become increasingly widespread. That points to a clear takeaway for you: the menu of qualifying tickers is likely to expand, so it is worth checking whether the names you already trade offer this precision today, and anticipating that more will soon.
Pre-market options trading, pending Cboe’s SEC-approved launch for 21 high-volume names including Nvidia and Apple, would add another layer of precision to earnings calendar management by letting traders adjust or close the short leg during the pre-market session when the stock gaps before the equity open.
Risks that can turn a well-structured calendar into a loss
A clean structure and a favourable IV differential do not make this trade safe. Each way it fails has a specific mechanism, and knowing them lets you set go/no-go criteria before you enter rather than discovering them after.
The four distinct failure modes are:
- A large directional move beyond the expected range
- Unequal volatility crush across the two legs
- Bid-ask and execution friction in short-dated contracts
- Crowding and competition for the edge
The primary failure mode is the earnings move that far exceeds the implied expected range. A calendar is short gamma at the strike, meaning you are short the fast-moving near-term option and long a slower-moving longer-dated one. If the stock gaps well beyond what the market priced, the short front leg pushes deep in-the-money and accumulates intrinsic value losses the long leg simply cannot offset in time.
Menthorq’s ACES guide, published 3 March 2026, identifies “realised volatility that far exceeds implied” as exactly this primary failure mode, and recommends selecting strikes within the expected-move range to limit the exposure.
The second risk is subtler. Your profit depends on the front-leg IV collapsing much harder than the back-leg IV. But the longer-dated leg you intended to keep can also suffer a secondary IV decline once the event risk passes.
OptionsPilot’s stress case makes this concrete: if the back-leg IV falls nearly as much as the front-leg IV, the calendar can underperform or even lose despite the IV crush arriving exactly as you expected. The crush has to be lopsided in your favour, not just present.
Execution friction is the third, and it bites hardest on the smallest positions. Bid-ask spreads on two-day and three-day single-stock options can be meaningfully wider than on standard monthly contracts, and the slippage from establishing and later unwinding the short leg can quietly erode your net edge.
The fourth consideration is crowding. The expansion of short-dated expirations and the growth of systematic and institutional participation in 0-5 DTE products, documented in CME’s 23 August 2026 data, means earnings calendars are no longer a niche tactic. More participants competing for the same edge tends to compress it.
Require a steep IV curve before entering. Menthorq’s guidance is that when the front-to-back inversion is modest, the edge may be too small to survive transaction costs and slippage.
Treat the IV differential as a minimum threshold, not just an opportunity signal. If the front-to-back spread is modest, transaction costs can eliminate the theoretical edge entirely, which means a marginal setup is often no setup at all.
What this means for traders approaching an earnings calendar today
Pull the structural picture together, and a clear decision framework falls out of it. A well-built earnings calendar needs four things aligned at once: a steep front-to-back IV differential, a qualifying short-dated expiration landing two to three days after the announcement, strike placement within the expected-move range, and management rules for the short leg defined before you enter.
The single most practical pre-entry filter is the volatility ratio. Check whether the front-leg IV sits at least 1.5x above the next-expiry IV, using the 1.5x-3x practitioner range as your benchmark for an adequate differential. Below that floor, the edge is likely too thin.
Reading the options chain through the lens of IV rank, skew, expected-move mapping, and term-structure comparison gives you the five data points needed to confirm whether a specific ticker’s pre-earnings inversion is steep enough to justify the trade, rather than entering on a directional impulse alone.
The SNOW example is worth keeping in mind as a template. Its multi-strike, low-premium architecture, with total risk of roughly $300 to $500 per position, shows how to keep total exposure small enough that a full loss stays inside your risk tolerance.
Here is the checklist to run before your next earnings entry.
- Confirm the front-leg expiration lands within two to three days of the announcement.
- Measure the front-to-back IV ratio, targeting 1.5x or higher.
- Centre the strike within the expected-move range.
- Size total premium so a complete loss sits within your pre-defined risk tolerance.
- Establish your short-leg management rules before the position goes on.
The forward look is what makes this genuinely dynamic. As more names qualify for Monday and Wednesday expirations and 0DTE single-stock trading keeps expanding, the structural advantage of precise expiration alignment will reach a broader set of tickers. So will the crowding. Both the IV conditions in a given stock and the availability of the right expiration are more favourable for more names than they were two years ago, which is precisely why the framework, rather than any single trade, is the thing to carry forward.
This article is for informational purposes only and should not be considered financial advice. Investors should conduct their own research and consult with financial professionals before making investment decisions.
Past performance does not guarantee future results. Financial projections are subject to market conditions and various risk factors.