
Most traders learn short selling as a concept. Very few encounter it as a discipline, with named positions, specific entry triggers, live stop adjustments, and a clear thesis about why a stock is being distributed right now.
That gap between theory and practice is where most bearish trades fail.
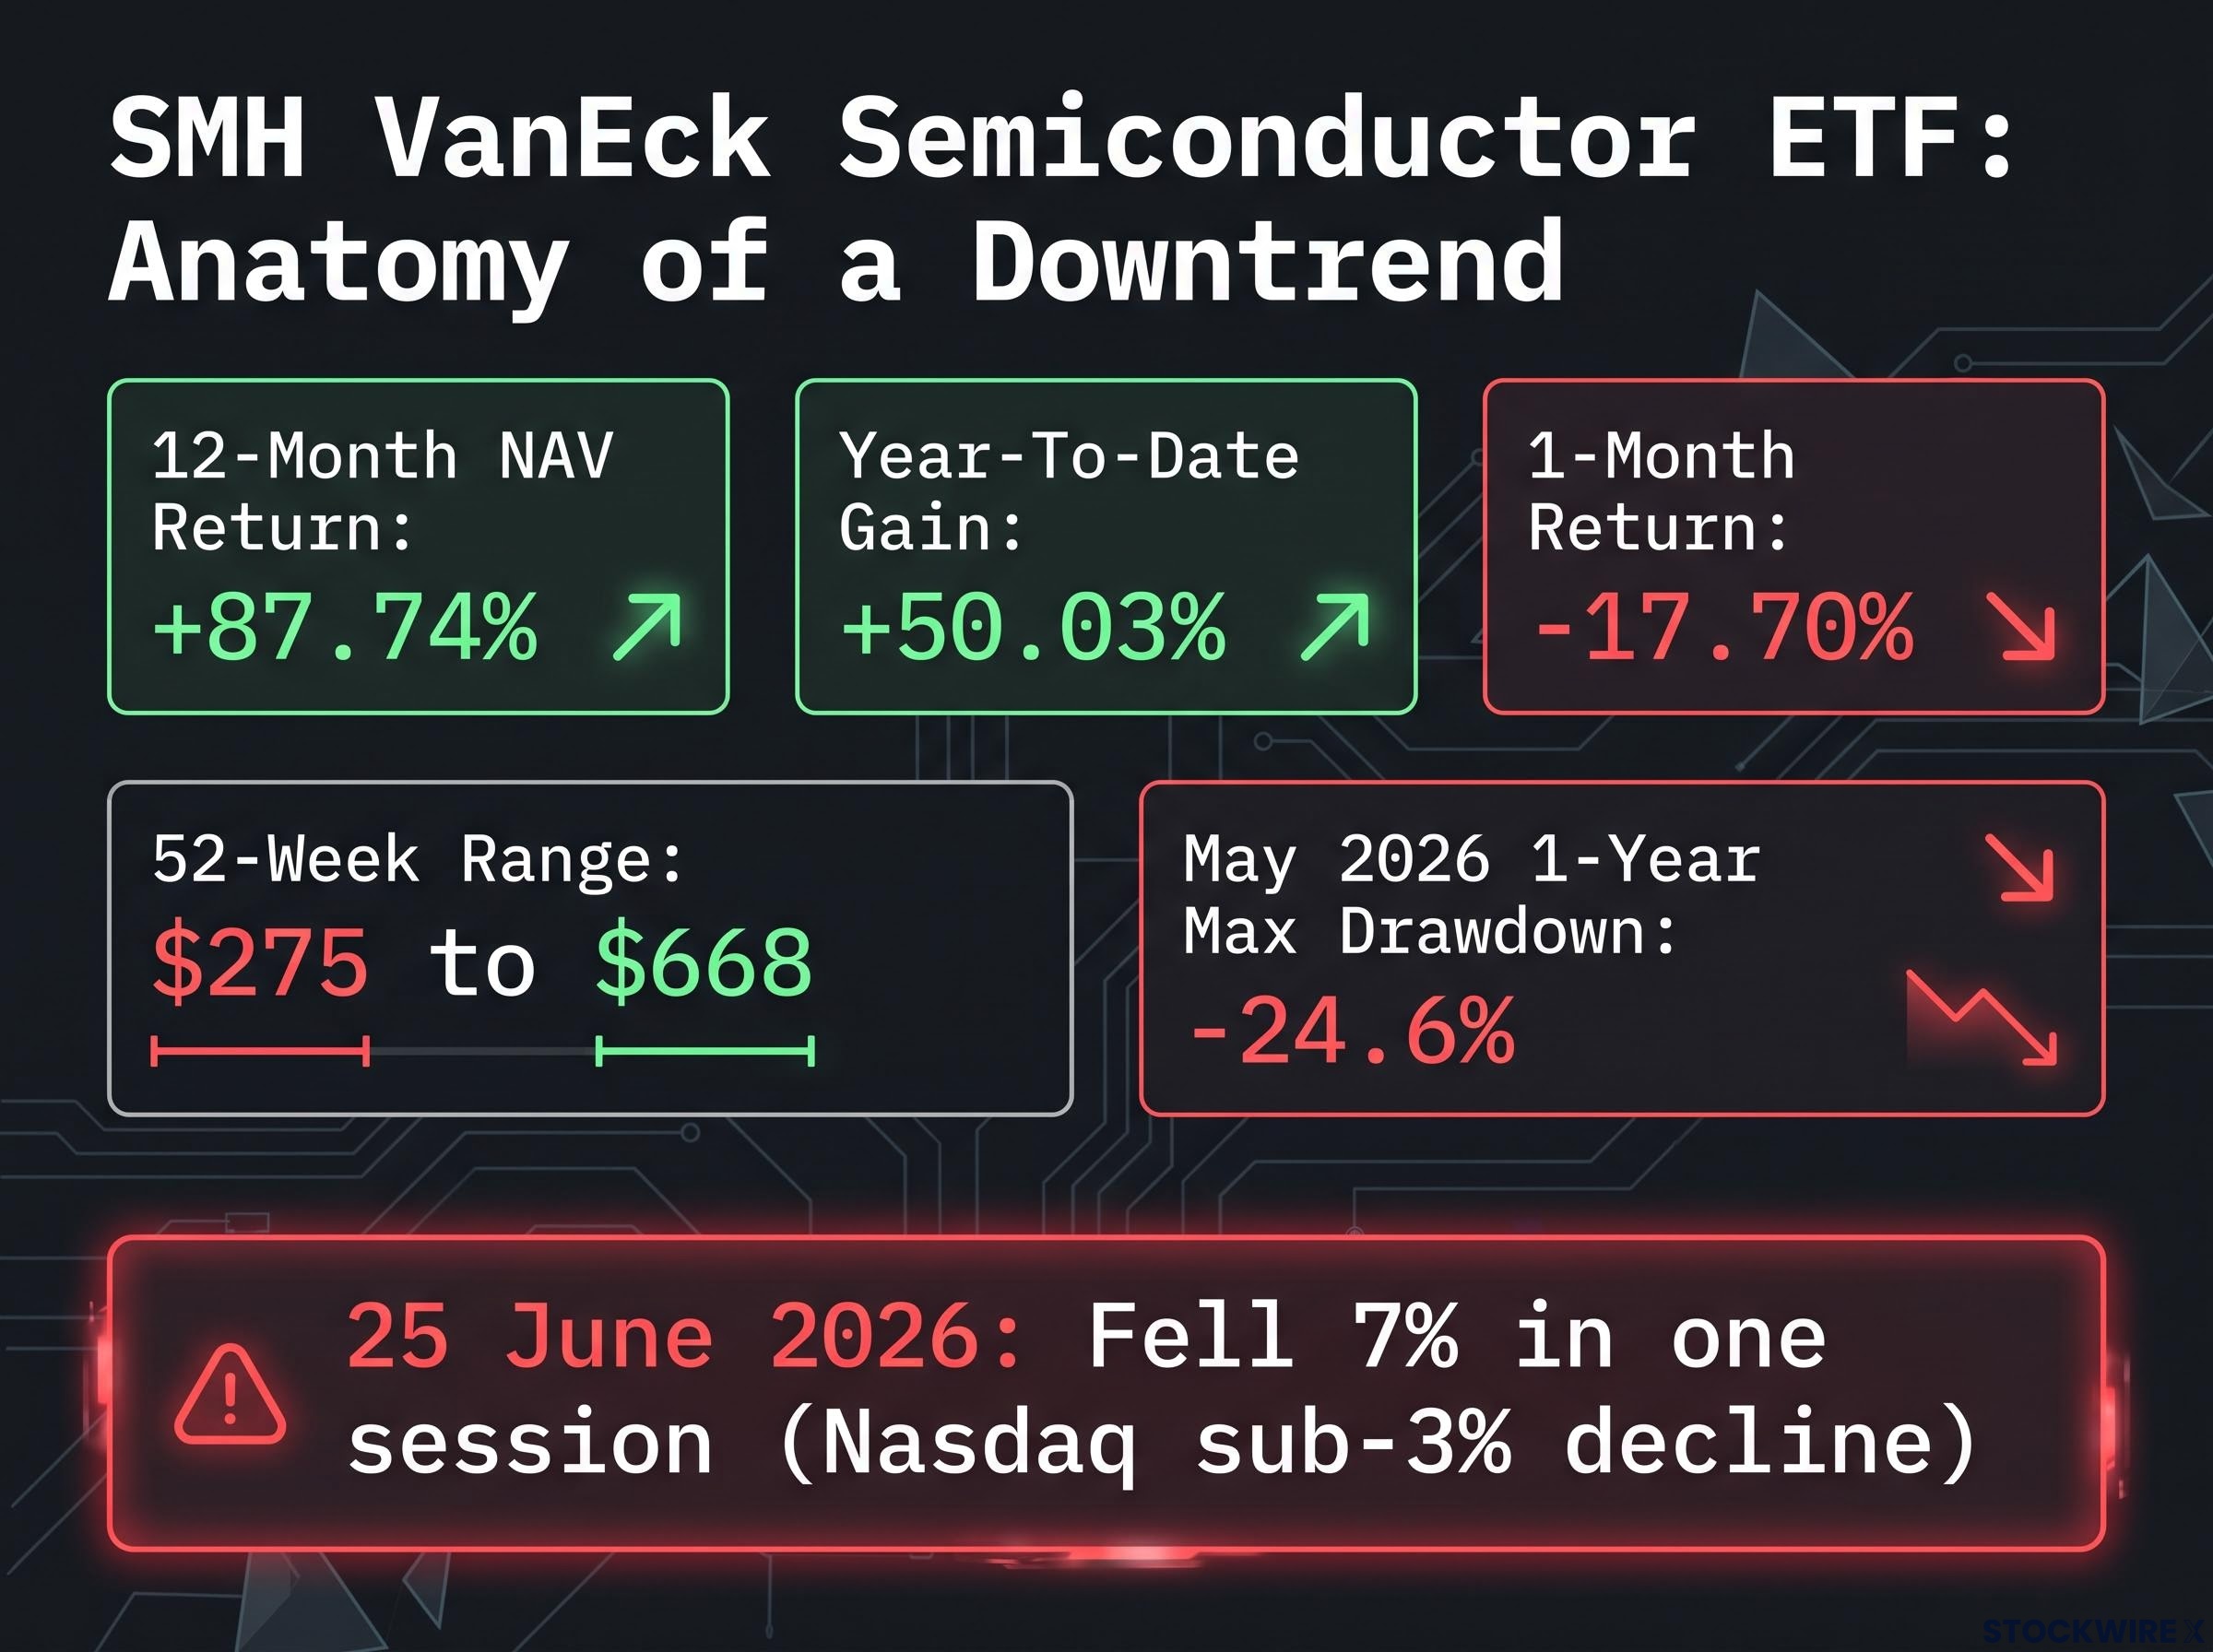
Short selling is having a moment. The SMH semiconductor ETF has shed nearly 18% in a single month despite an 87% gain over the prior year. Post-earnings sell-offs are wiping double-digit percentage points off tech names in single sessions, and September seasonality data going back to 1928 argues that equity weakness is the base case for the next four weeks, not the exception.
Traders who know how to build bearish positions systematically are operating in a market that rewards that preparation.
This guide walks through the actual mechanics: how experienced traders identify short entry signals, how they size and stop positions in real conditions, and what the structural risks look like once you move beyond the textbook. Everything here is grounded in real trades and real data, not abstract frameworks. By the time you finish, you will know what separates a disciplined short from a directional gamble.
The three entry signals traders actually use to identify a short
Picture a stock that gaps down at the open and keeps falling. The gap does not fill. Volume is heavy. The broader market is flat or weak. This is the setup behind the gap-and-go continuation short, and it is the most visual entry a short seller has.
You are not fading the move here. You are joining it, entering short in the direction of the gap because the selling pressure is already confirmed by volume. Stops typically sit just above the high of the gap candle, which gives you a defined risk before you commit a single dollar.
The fade-the-gap short runs the opposite logic. Instead of chasing a gap down, you wait for a gap up to fail. When an overnight gap higher runs into resistance and the early buyers exhaust themselves, you enter short as price rolls back toward the prior close. It takes more patience, but the risk-reward on the entry is usually better because you are selling into strength rather than weakness.
Both gap plays share one gatekeeper: intraday confirmation. Waiting past the first 30-60 minutes lets you sidestep the opening noise, and a stock trading below its VWAP or opening range lows tells you institutions are distributing rather than accumulating.
Volume confirmation is the gatekeeper that separates a distributional gap from random noise: valid gap-and-go continuation shorts typically require volume running well above the 20-day average on the gap bar, which is the same threshold that distinguishes confirmed breakdowns from low-participation fades that reverse quickly.
The VWAP confirmation rule Volume-Weighted Average Price (VWAP) is the average price a stock has traded at through the day, weighted by volume. When a stock holds below VWAP, larger players are selling into the market. Confirmed weakness below VWAP or the opening range low is the technical green light before you enter.
Here are the three signals, at a glance:
- Gap-and-go continuation: Enter short in the direction of a gap down when volume confirms the selling and the gap does not fill.
- Fade-the-gap: Wait for a gap up to fail at resistance, then enter short as exhausted buyers give way.
- Relative weakness on up days: Short a stock that is falling while the index is climbing, because that divergence signals distribution independent of market direction.
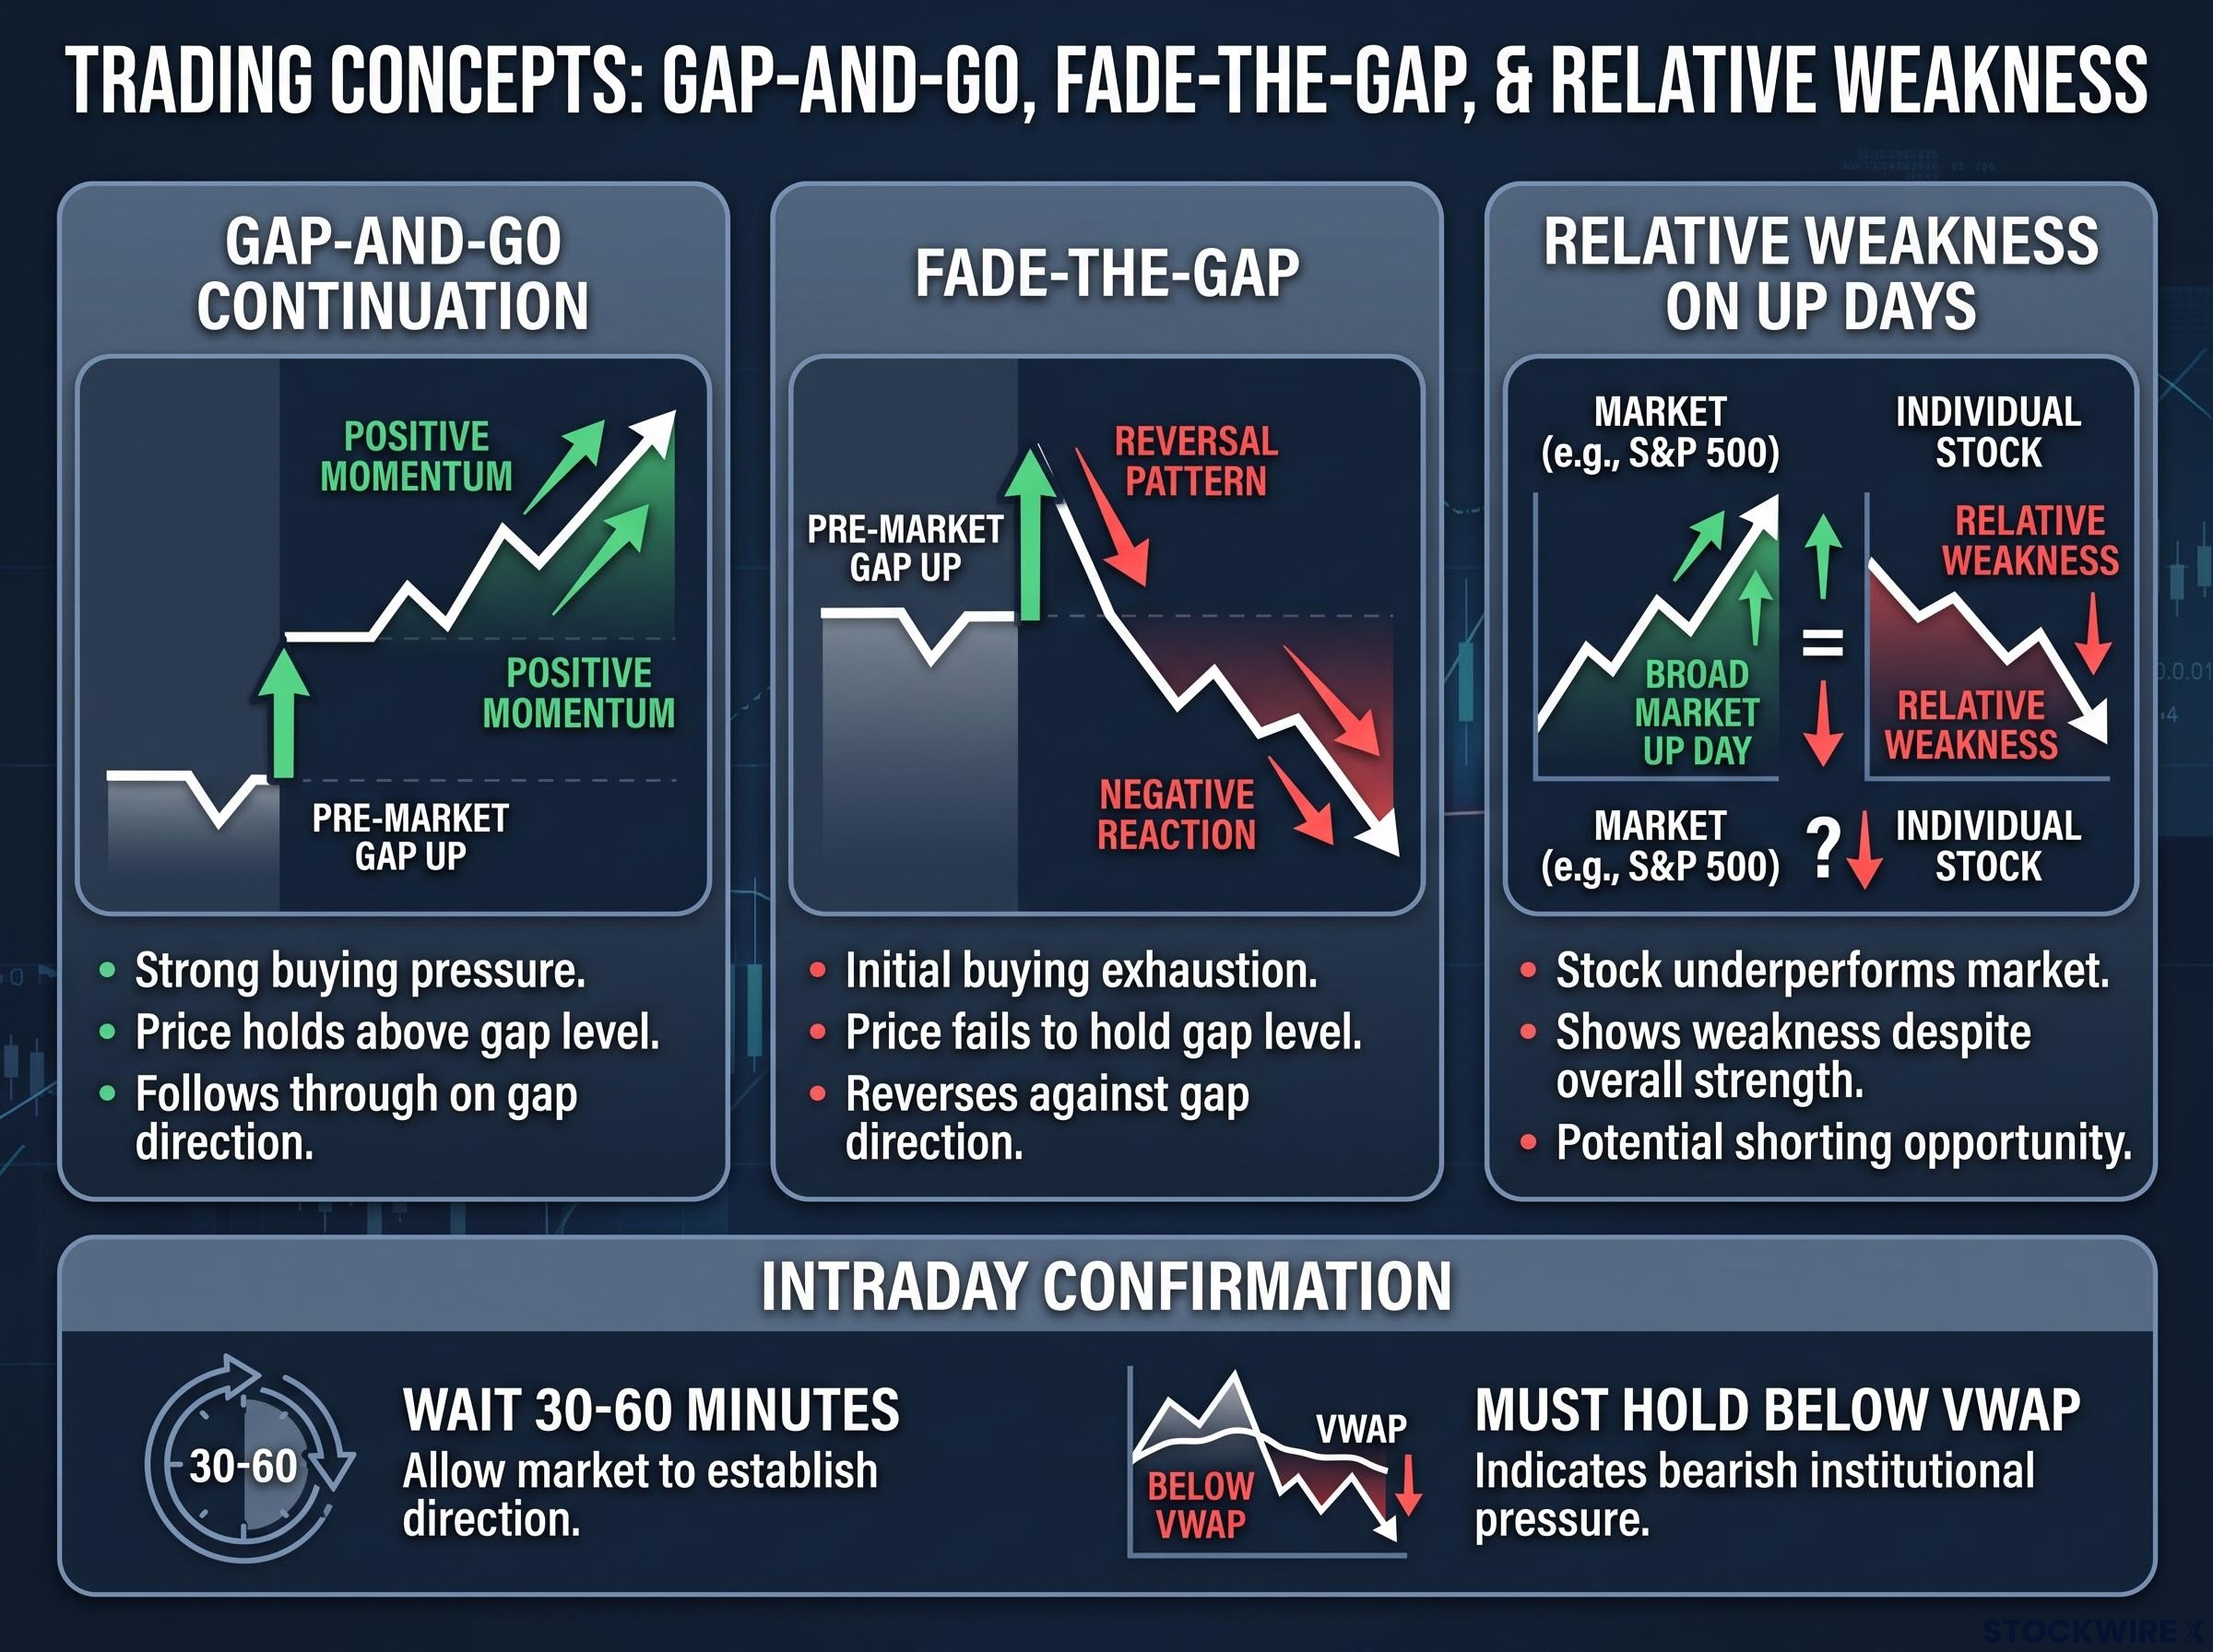
Gap trades vs relative weakness shorts: different entry, same core logic
The third signal is arguably the most important, and it works on a slower clock. Relative weakness shows up when a stock declines while the S&P 500 is up 40-plus points. One trader tracked in the research holds an active short in Tesla built on exactly this read, noting the stock drifting lower on a session where the S&P 500 was up roughly 44.5 points to around 5,576 and the Nasdaq traded above 29,000.
A stock falling on a strong market day is not just a data point. It tells you someone with real size has decided this name is not worth holding, and that conviction is running independent of the tide lifting every other boat.
Gap trades are entered near the open with immediate momentum confirmation. Relative weakness shorts develop through the session as the divergence becomes obvious. Different timing, but the downstream management is identical: a defined stop, and a thesis about why the stock is structurally weak rather than just temporarily lower.
When big ASX news breaks, our subscribers know first
What short selling actually looks like in practice: two live trades
Signals are abstract until you watch someone put them on. Two live positions from the research show how a real short is built, adjusted, and anchored to a thesis.
The first is a short in the SMH VanEck Semiconductor ETF. The entry rationale is a multi-month downtrend, a pattern of lower highs and lower lows that the trader identified as structurally weak. The initial stop sat at an original gap level, but as the trade developed it was nudged up to the prior Monday’s high, with resistance identified near a small gap that formed between Monday and Tuesday of the current week.
That stop adjustment is the whole lesson. Stop-loss management is not a static decision made at entry. It is a continuous recalibration as the market reveals new resistance and support, and a trader who fails to adjust is holding a position with a thesis the market has already partly invalidated.
An ETF short is also structurally different from a single-stock short. Sector-level exposure reduces the risk of one company blowing up your trade on surprise news, but it also mutes your return and forces you to be right about the direction of an entire sector, not just one name.
A single-session move worth respecting On 25 June 2026, SMH fell 7% in one session, more than double the Nasdaq Composite’s sub-3% decline that same day. That is the volatility a semiconductor short is trading inside.
The SMH numbers frame why the downtrend thesis exists at all:
| Position | Entry trigger | Stop level | Thesis | ETF vs single stock |
|---|---|---|---|---|
| SMH (short) | Multi-month downtrend, breakdown below key levels | Adjusted from original gap to prior Monday’s high | Sector weakness, resistance near Mon-Tue gap | ETF: lower blowup risk, muted return |
| Tesla (short) | Gap trade plus relative weakness on an up day | Above gap candle high | Stock falling while S&P 500 up ~44.5 pts | Single stock: higher idiosyncratic risk and reward |
| SpaceX (watching, not yet entered) | Eight-session positive streak ended with a 1.3% decline | Not set: waiting for confirmation | Exhaustion near the 150 resistance level | Monitoring only |
The context for the SMH short is a sharp reversal after an enormous run. Over the prior 12 months the ETF returned +87.74% on a NAV basis, with a year-to-date gain of +50.03%, yet its most recent one-month return was -17.70%. Its 52-week range ran from roughly $275 to $668.
A May 2026 risk analysis recorded a 1-year maximum drawdown of -24.6%, with the ETF trading roughly -18.5% below its prior peak at the time. That combination, a violent uptrend giving way to a deep drawdown, is precisely the structure a downtrend short is built to exploit.
The SpaceX line in the table is the counterpoint to acting. After eight consecutive positive sessions, the privately traded shares closed down about 1.3% near the 150 level. That is a setup being watched for exhaustion, not a trade that has broken. Watching a setup develop and acting on one that has already confirmed are two different disciplines, and confusing them is how good theses become bad entries.
Why stocks fall after beating earnings, and how traders position for it
Here is the moment that confuses most retail traders. A company beats on earnings, and the stock drops 18% in a single session anyway.
That is not a glitch. It is one of the most repeatable short setups on the board, and it happens because the number you see reported is not the number the stock is actually being measured against.
The official estimate is the visible bar. The real bar is the whisper number, the unofficial consensus baked into options pricing and buy-side positioning. When a stock clears the published estimate but misses the whisper, it sells off despite a headline beat. Layer on “buy the rumour, sell the news” dynamics, where a stock runs 30-40% into an earnings date, and you get structural conditions for heavy profit-taking regardless of what the print says.
The expectations gap between the reported number and the whisper consensus is the same structural force that produced the Q1 2026 environment where blended EPS growth ran at 27.1% year-over-year yet multiple large-cap names still sold off sharply after their prints.
Reading the setup before the print: what positions and implied volatility tell you
Implied volatility (IV) is the market’s expectation of how much a stock will move, priced into its options. In the days before earnings, elevated IV embeds that whisper premium, and traders watch it alongside the stock’s run-up as a crowding gauge.
The candidates most exposed to a post-earnings sell-off are the ones carrying both a large pre-earnings run-up and elevated IV. Crowded positioning plus stretched expectations means even good numbers struggle to clear the bar.
The pattern shows up across three recent tech prints:
- Credo Technology (CRDO): Fell 18.38% in the regular session on 1 September 2026 after an earnings beat, following pre-market declines of 10.3% and after-hours drops of 4.43%, driven by margin concerns and mixed analyst reactions.
- MongoDB (MDB): Surged up to 24% intraday after its fiscal Q1 2027 earnings in late May 2026 before reversing sharply to close roughly flat, a textbook case of violent two-sided volatility.
- Palo Alto Networks (PANW): Fell roughly 4-7% after its fiscal Q3 2026 print on 2 June 2026 despite an EPS beat, having declined the day after earnings in three of its last four reports.
- The Dell exception: Rose more than $18 per share in one session, partly because it had sold off hard the prior session, which is the contrasting case that makes the rule visible.
The most acute illustration Credo Technology (CRDO) dropping 18.38% in a single regular session on an earnings beat shows how far a stock can fall when the whisper number was set higher than any quarterly result could clear.
When a stock drops on a good print, the market is telling you expectations were already priced at a level no quarter was going to satisfy. Recognising that dynamic before the report is exactly what separates a short trade from a guess. MongoDB is the caution built into this setup: the same crowded positioning that fuels a sell-off can also fuel a 24% squeeze first, which is why entry timing and stops matter as much as the thesis.
The structural risks of short selling that most guides skip
Everything so far has been tactical. Now the register shifts, because short selling carries structural risks that long-only trading simply does not, and the asymmetry is not an abstraction. It is a design feature of the trade.
The four risks that define it:
- Unlimited loss potential. A stock has no theoretical ceiling, so a short can lose far more than its entry value. Stop orders can gap straight through their levels on sudden news, leaving a loss much larger than planned.
- Short squeeze. A coordinated or momentum-driven buying surge forces short sellers to cover at once, which amplifies the upward move and accelerates losses across every short in the name.
- Regulatory constraints. Under SEC Regulation SHO, brokers must secure a “locate” to confirm shares can be borrowed and delivered, and any fails-to-deliver must be closed out promptly. Borrow availability can vanish without warning and force a liquidation.
- Fee drag. Hard-to-borrow surcharges plus the obligation to pay any dividends on borrowed shares create a carrying cost that erodes returns the longer a position stays open.
Short squeeze mechanics follow a self-reinforcing logic that makes them particularly dangerous for position holders who are right on the fundamental thesis but wrong on the timing: forced covering by one cohort of shorts elevates the price, which triggers margin calls on the next cohort, compounding the upward move until buying exhaustion sets in.
Here is how that risk profile compares against a long position:
| Risk factor | Long position | Short position |
|---|---|---|
| Maximum loss | Capped at amount invested | Theoretically unlimited |
| Squeeze risk | None | Forced covering amplifies losses |
| Regulatory burden | Minimal | Regulation SHO locate and closeout rules |
| Carrying cost | None (may earn dividends) | Borrow fees plus dividend obligations |
The data on retail short sellers is sobering.
What happens without discipline A 2025 CFA Institute study found that retail short sellers lost an average of 18% annually from 2024 to 2025, compared to 7% losses for long-only strategies over the same period.
That underperformance figure is not an argument against short selling. It is an argument for the exact disciplines this guide covers, because the traders losing 18% a year are the ones entering without defined stops, thesis clarity, or an honest accounting of borrow costs.
The macro backdrop does lean their way right now. Since 1928, the S&P 500 has averaged roughly -1.17% to -1.2% in September and posted negative returns 55-56% of the time. Volatility expands too: since 1990 the VIX has climbed an average of 8.2% in September.
But seasonality is a contextual input, not a signal. Over the last 25 years the average September return has shrunk to about -0.4% with a positive median, which means the historical average is skewed by a handful of extreme years. Use it to frame the environment, not to justify a trade on its own.
Building a bearish position with the discipline that makes it survivable
Pull the threads together and a disciplined short trade has a recognisable shape from entry through stop to exit. Start with the entry checklist. Before initiating a short, confirm:
- A valid entry signal is present: a gap-and-go continuation, a failed gap-up fade, or clear relative weakness on an up day.
- The setup aligns with a multi-month downtrend of lower highs and lower lows.
- There is a structural thesis, such as post-earnings exhaustion in a crowded, high-IV name, not just a lower price.
- Intraday confirmation holds: the stock is trading below VWAP or the opening range low.
Next, stop placement. Stops belong above structure, not at arbitrary percentages:
- Above the prior gap high, as the SMH short used at entry.
- Above the prior session or prior week’s high, where the SMH stop was moved as the trade developed.
- Adjusted dynamically as new resistance reveals itself, tightening risk without abandoning the thesis.
Then sizing. Given the gap-through risk that can blow past a stop on news, a short warrants meaningfully smaller size than an equivalent long. Volatility feeds directly into this: since 1990 the VIX has risen an average of 8.2% in September, and the average September VIX since 2020 has run at 21.47 versus 17.25 in August. Wider expected swings mean wider stops and smaller positions.
The volatility case for smaller size is reinforced by a fixed-dollar-risk approach to short position sizing, where shares short equals your dollar risk divided by the distance between entry and stop, so wider stops in high-volatility environments automatically shrink exposure without any separate judgment call.
The sizing principle A short position warrants smaller size than an equivalent long trade, because the loss structure is asymmetric and a stop can gap straight through its level.
A short trade without a structurally placed stop is not a trade with managed risk. It is a directional bet with an undefined downside, and that difference is the difference between a strategy and a gamble.
This article is for informational purposes only and should not be considered financial advice. Investors should conduct their own research and consult with financial professionals before making investment decisions. Past performance does not guarantee future results, and financial projections are subject to market conditions and various risk factors.
What separates survivable short selling from speculative bets
Two things make short selling work, and neither functions without the other. The first is pattern recognition: the gap trades, the relative weakness reads, the post-earnings exhaustion setups. The second is discipline execution: the structural stops, the smaller sizing, the thesis clarity that tells you why you are in the trade.
The signals get you in. The discipline keeps you solvent.
The environment is cooperating for now. A -17.70% single-month move in SMH is the kind of sector-level decline that creates the downtrend alignment high-probability shorts depend on, and an elevated September VIX only sharpens the backdrop. None of that removes the need for individual trade discipline. The 18% average annual loss recorded among retail short sellers is what the absence of that discipline looks like in the data.
So make this concrete. Take the signal framework and apply it to one sector or one position you are already watching, and define your thesis and your stop before you define your entry.
The traders worth learning from are not operating on a bearish hunch. They are running a structured framework against a specific environment, and that framework is available to anyone willing to do the work before the trade rather than after it.