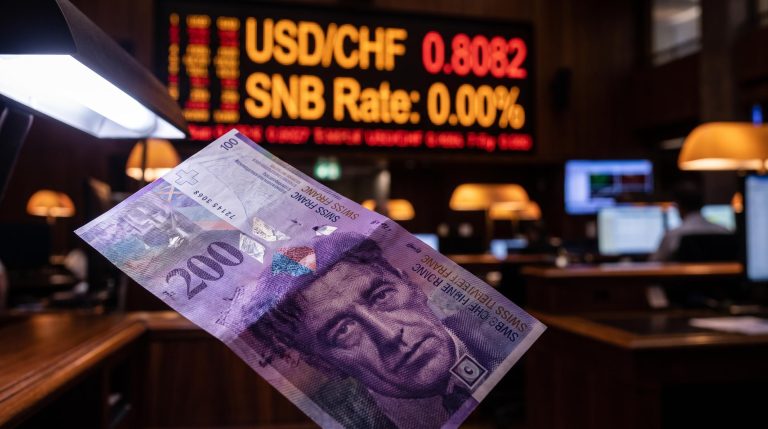
Two central banks, two decisions, and thirteen days between them. On 16 September 2026 the US Federal Reserve delivers its verdict. On 29 September 2026 the Reserve Bank of Australia (RBA) follows. Market probability trackers cannot agree on what either will do: the Fed sits at roughly 63-66% priced for a hike, while the RBA is close to a coin toss.
That disagreement matters because it lands inside the most contested month on the equity calendar. September carries a historical reputation for weakness, and this year the seasonal overlay collides with two live rate decisions, sticky underlying inflation in both countries, and a geopolitical oil risk that neither central bank can price with confidence.
This is not simply a question of whether rates go up. It is a question of what the combination of signals reveals about how far into restriction territory both economies still have to travel. Here is what the data actually tells you about the risk environment heading into these two meetings, and what to watch as each one approaches.
What market pricing actually tells us about September rate expectations
Start with where the money sits. As of early September, the Fed is priced with a clear tilt toward tightening, while the RBA sits far closer to the fence, and the gap between the two is the first thing worth reading.
For the Fed, the probability of a 25 basis point hike on 16 September ranges by tracker. RateProbability.com put it at 63% as of 2 September 2026. Marketplace, citing the CME FedWatch Tool on 1 September 2026, estimated about 66%. CNBC reported a lower 56% as of 28 August 2026. The spread itself is the signal: even the professionals watching the same data land in different places.
The RBA picture is more contested still. RateProbability.com showed a 57% hike probability, centralbank.watch had it split 50-50, and RBA Rate Watch leaned the other way with a 54.68% hold probability against 44.81% for a hike, all dated 31 August to 1 September 2026. This is genuinely a closer call than the Fed decision.
| Central Bank | Decision Date | Current Rate | Hike Probability Range | Hold Probability Range |
|---|---|---|---|---|
| US Federal Reserve | 16 September 2026 | 3.50-3.75% | 56-66% | 34-44% |
| Reserve Bank of Australia | 29 September 2026 | 4.35% | 45-57% | 43-55% |
The Fed’s pricing has also swung hard across the summer, from 80% hike odds in late June, to a hold lean of 60-65% by early August, back up to the current 63-66% range. Pricing this jumpy is not a settled market.
The FOMC minutes from the July 2026 meeting showed three officials had favoured an immediate 25 basis point hike at a meeting that ultimately ended in a hold, a documented internal split that explains why the September decision carries genuine two-sided risk rather than reflecting a settled committee view.
Internal debate already live: The July FOMC meeting ended in a hold on a 9-3 vote, with three officials preferring an immediate 25 basis point hike. The split tells you the argument inside the Fed is not hypothetical; it is already on the table.
The July meeting’s 9-3 vote is a reminder that FOMC structure and forward guidance carry as much policy signal as the rate decision itself; non-voting regional presidents who dissented publicly through July were telling markets the argument for tightening remained alive inside the committee.
Here is what the tracker divergence means for you. When professional investors are this far from consensus on both decisions, the market reaction to either outcome becomes asymmetric. A 66% priced hike that arrives delivers a smaller jolt than a surprise would, but the RBA’s near coin-flip means its decision, whichever way it lands, carries outsized reaction risk.
When big ASX news breaks, our subscribers know first
The inflation data both central banks are reading right now
Both central banks face the same structural problem wearing different national clothing. Headline inflation is moving in the right direction in both countries. Underlying inflation, the measure each bank actually weights, is refusing to follow. And in both cases the preferred gauge sits materially above target.
The distinction matters because headline CPI includes volatile items like fuel and fresh food, while underlying measures strip those out to reveal the persistent trend. Central banks steer by the underlying number, which is why falling headline figures have not produced a clear policy pivot in either economy.
Headline versus core divergence had already emerged as the structuring question by June 2026, when headline CPI hit 4.2% while core printed at 2.9%, a 1.3 percentage-point gap that analysts characterised as an energy-driven uptick rather than a demand spiral, the same analytical distinction the RBA and Fed are now applying to their September deliberations.
Australia: headline improving, underlying stuck
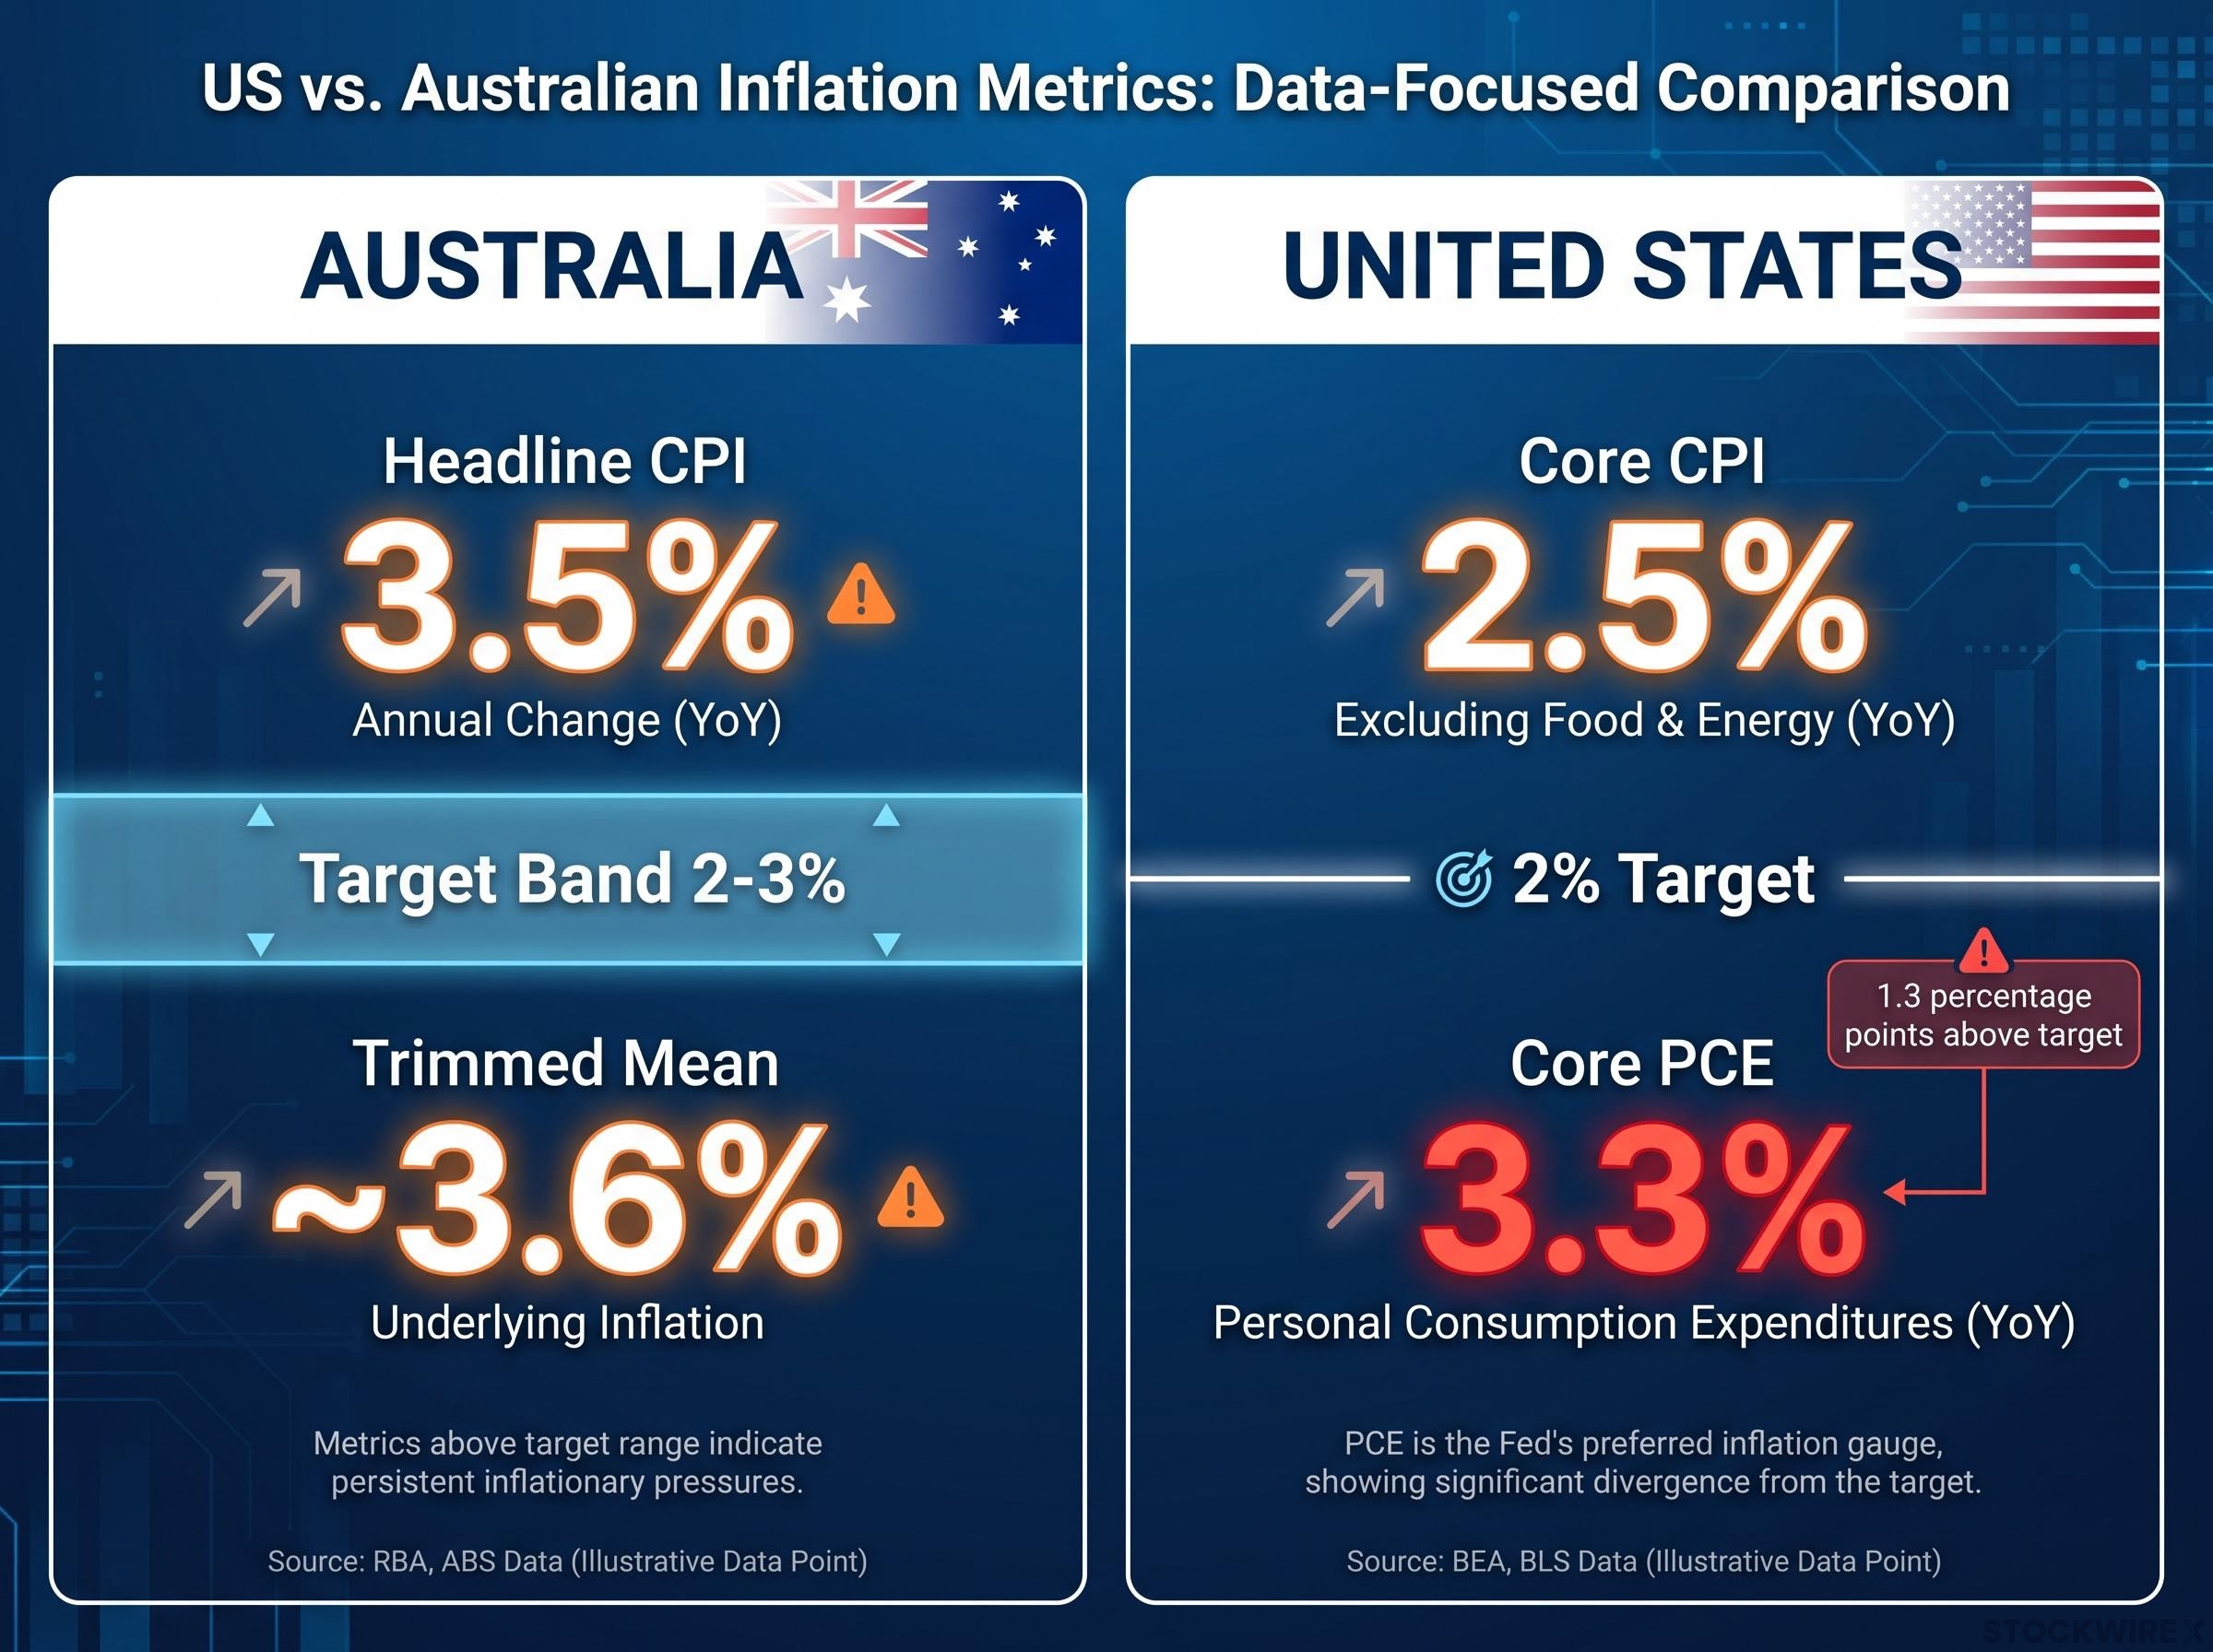
Australian headline CPI rose 3.5% over the year to July 2026, down from 3.8% in June, per the release dated 26 August 2026. On the surface, that is a fourth consecutive month of improvement.
The trimmed mean tells a different story. The RBA’s preferred underlying measure held at roughly 3.6% year-on-year, unchanged from June, and still above the 2-3% target band. The RBA’s own projections have the trimmed mean staying above 3% until mid-2027, easing only to around 2.5% by early 2028.
That is a long plateau. Deutsche Bank went further, characterising Australian underlying inflation as “intolerably high” in August 2026 coverage, which is unusually blunt language from a major forecaster.
United States: core PCE is the number that matters
In the US, the split is just as clear. Headline CPI rose 3.4% year-on-year in July 2026, and core CPI came in softer at 2.5%.
But the Fed does not steer by CPI. Its preferred gauge is core PCE, which rose 3.3% year-on-year in July, unchanged from June, and headline PCE ran hotter at 3.7%.
The BEA Personal Income and Outlays release for July 2026 confirmed core PCE at 3.3% year-on-year, the same reading as June, placing the Fed’s preferred inflation gauge 1.3 percentage points above its 2% target and keeping the September decision firmly live.
Here is the number that actually matters. Core PCE at 3.3% sits 1.3 percentage points above the Fed’s 2% target. That gap, not the friendlier core CPI figure, is what keeps the September decision live.
The parallel is the point. Headline metrics in both countries are cooperating, and the underlying measures in both are not.
- Australia headline CPI: 3.5% (target band 2-3%)
- Australia trimmed mean: ~3.6% (above target)
- US core CPI: 2.5% (softer)
- US core PCE: 3.3% (1.3 points above 2% target)
The read for you is straightforward. As long as underlying inflation stays this sticky in both economies, neither central bank has the political cover to credibly commit to a pause, no matter how encouraging the headline prints look.
Where economists and major banks stand on each decision
If the professionals cannot agree, it is worth understanding exactly how they disagree, because the shape of that disagreement tells you what is driving it. Among Australia’s major banks, all reading comparable data, the split is real.
NAB expects a 25 basis point hike in September, taking the cash rate to 4.60%. ANZ and Commonwealth Bank both forecast the next move in November, also to 4.60%, having revised their calls after the hot August CPI print. Westpac sits at the dovish end, expecting a hold at 4.35% for the rest of 2026. Goldman Sachs joined the November camp after the same inflation data.
| Institution | RBA Forecast | Rate Implied | Key Rationale |
|---|---|---|---|
| NAB | September hike | 4.60% | Underlying inflation too high to wait |
| ANZ / CBA | November hike | 4.60% | Revised later after hot August CPI |
| Westpac | Hold through 2026 | 4.35% | Growth risks favour wait-and-see |
The disagreement is not new. A Reuters poll from 11 June 2026 found 26 of 44 economists expected the cash rate to stay at 4.35% at the end of September, while 18 expected at least 4.60%.
Blunt language from Deutsche Bank: The bank forecast a September hike outright, describing Australian underlying inflation as “intolerably high.” That framing captures why the hawkish case has not gone away despite falling headline numbers.
The Fed forecasts have swung even more violently. Futures priced an 80% chance of a September hike in late June. A weak July jobs report flipped that, and by 7 August 2026 traders saw a 60-65% chance of a hold. After former Fed official Kevin Warsh’s Jackson Hole speech, odds swung north again to the current 63-66% range.
Reuters reported on 20 August 2026 that Fed minutes flagged a September hike as “on the table” but noted softer inflation and jobs data had reduced the urgency, leaving genuine two-sided risk.
Here is what to take from the disagreement. When institutions holding the same data land on September, November, and no move at all, the RBA decision is genuinely data-contingent, and that means the timing of any hike matters as much as the hike itself. Divided forecasts price in more volatility around the decision, not just around the outcome.
The September effect and what history says about this setup
September has a reputation for equity weakness, and unlike most market folklore, this one rests on identifiable institutional mechanics rather than superstition. Three forces drive it, and all three are particularly active in 2026.
September effect data complicates the simple seasonal narrative: the S&P 500’s median September return is actually +0.1% and roughly 52% of all Septembers since 1925 have closed positive, which means the current article’s seasonal risk argument rests on the specific macro overlay of two live rate decisions, not on the calendar month producing reliable declines on its own.
- Tax selling and rebalancing. Many mutual funds close their fiscal years around September, prompting tax-motivated selling and rotation away from the year’s outperformers.
- Event-driven de-risking. After the summer lull, September opens a dense cluster of macro events. This year that means the 16 September Fed decision and the 29 September RBA decision, and investors routinely trim risk ahead of binary events.
- Buyback blackouts. Corporate share buyback programmes often enter blackout periods before Q3 earnings, removing a steady source of demand and thinning liquidity.
Now overlay the starting point. The S&P 500 closed at 7,686.14 on 31 August 2026, having gained 2.62% for the month and 12.28% year-to-date. That is a market entering a historically weak month at or near record highs.
How much is riding on it: The S&P 500 is up 18.98% year-on-year. Entering a seasonally weak month with a gain that size raises the stakes if the two rate decisions surprise on the hawkish side.
Australian equities are steadier but less clear cut. The ASX 200 sat around 9,076 to 9,092 points in late August, though sources conflict on the monthly result, ranging from a 0.59% decline to a 1.29% gain. Commonwealth Bank noted the index had recovered roughly 6.8% from its March selloff.
History rhymes here. Late-cycle Fed tightening episodes, the mid-1990s, the 2004-2006 cycle, and the 2022-2023 post-pandemic hikes, all produced elevated volatility and equity drawdowns once markets concluded policy would stay restrictive longer than priced.
The interpretive point for your positioning is this. An equity market at record highs, facing seasonal headwinds and two live decisions inside a fortnight, carries more compression risk than a strong trailing 12-month return would suggest on its own.
Geopolitical risk and the oil price wildcard for both central banks
There is one variable neither central bank can model with confidence, and it sits outside their control entirely. Renewed hostility between the US and Iran keeps oil prices as a live risk, and the transmission from a crude spike into a rate decision is more direct and more measurable than a vague tail risk implies.
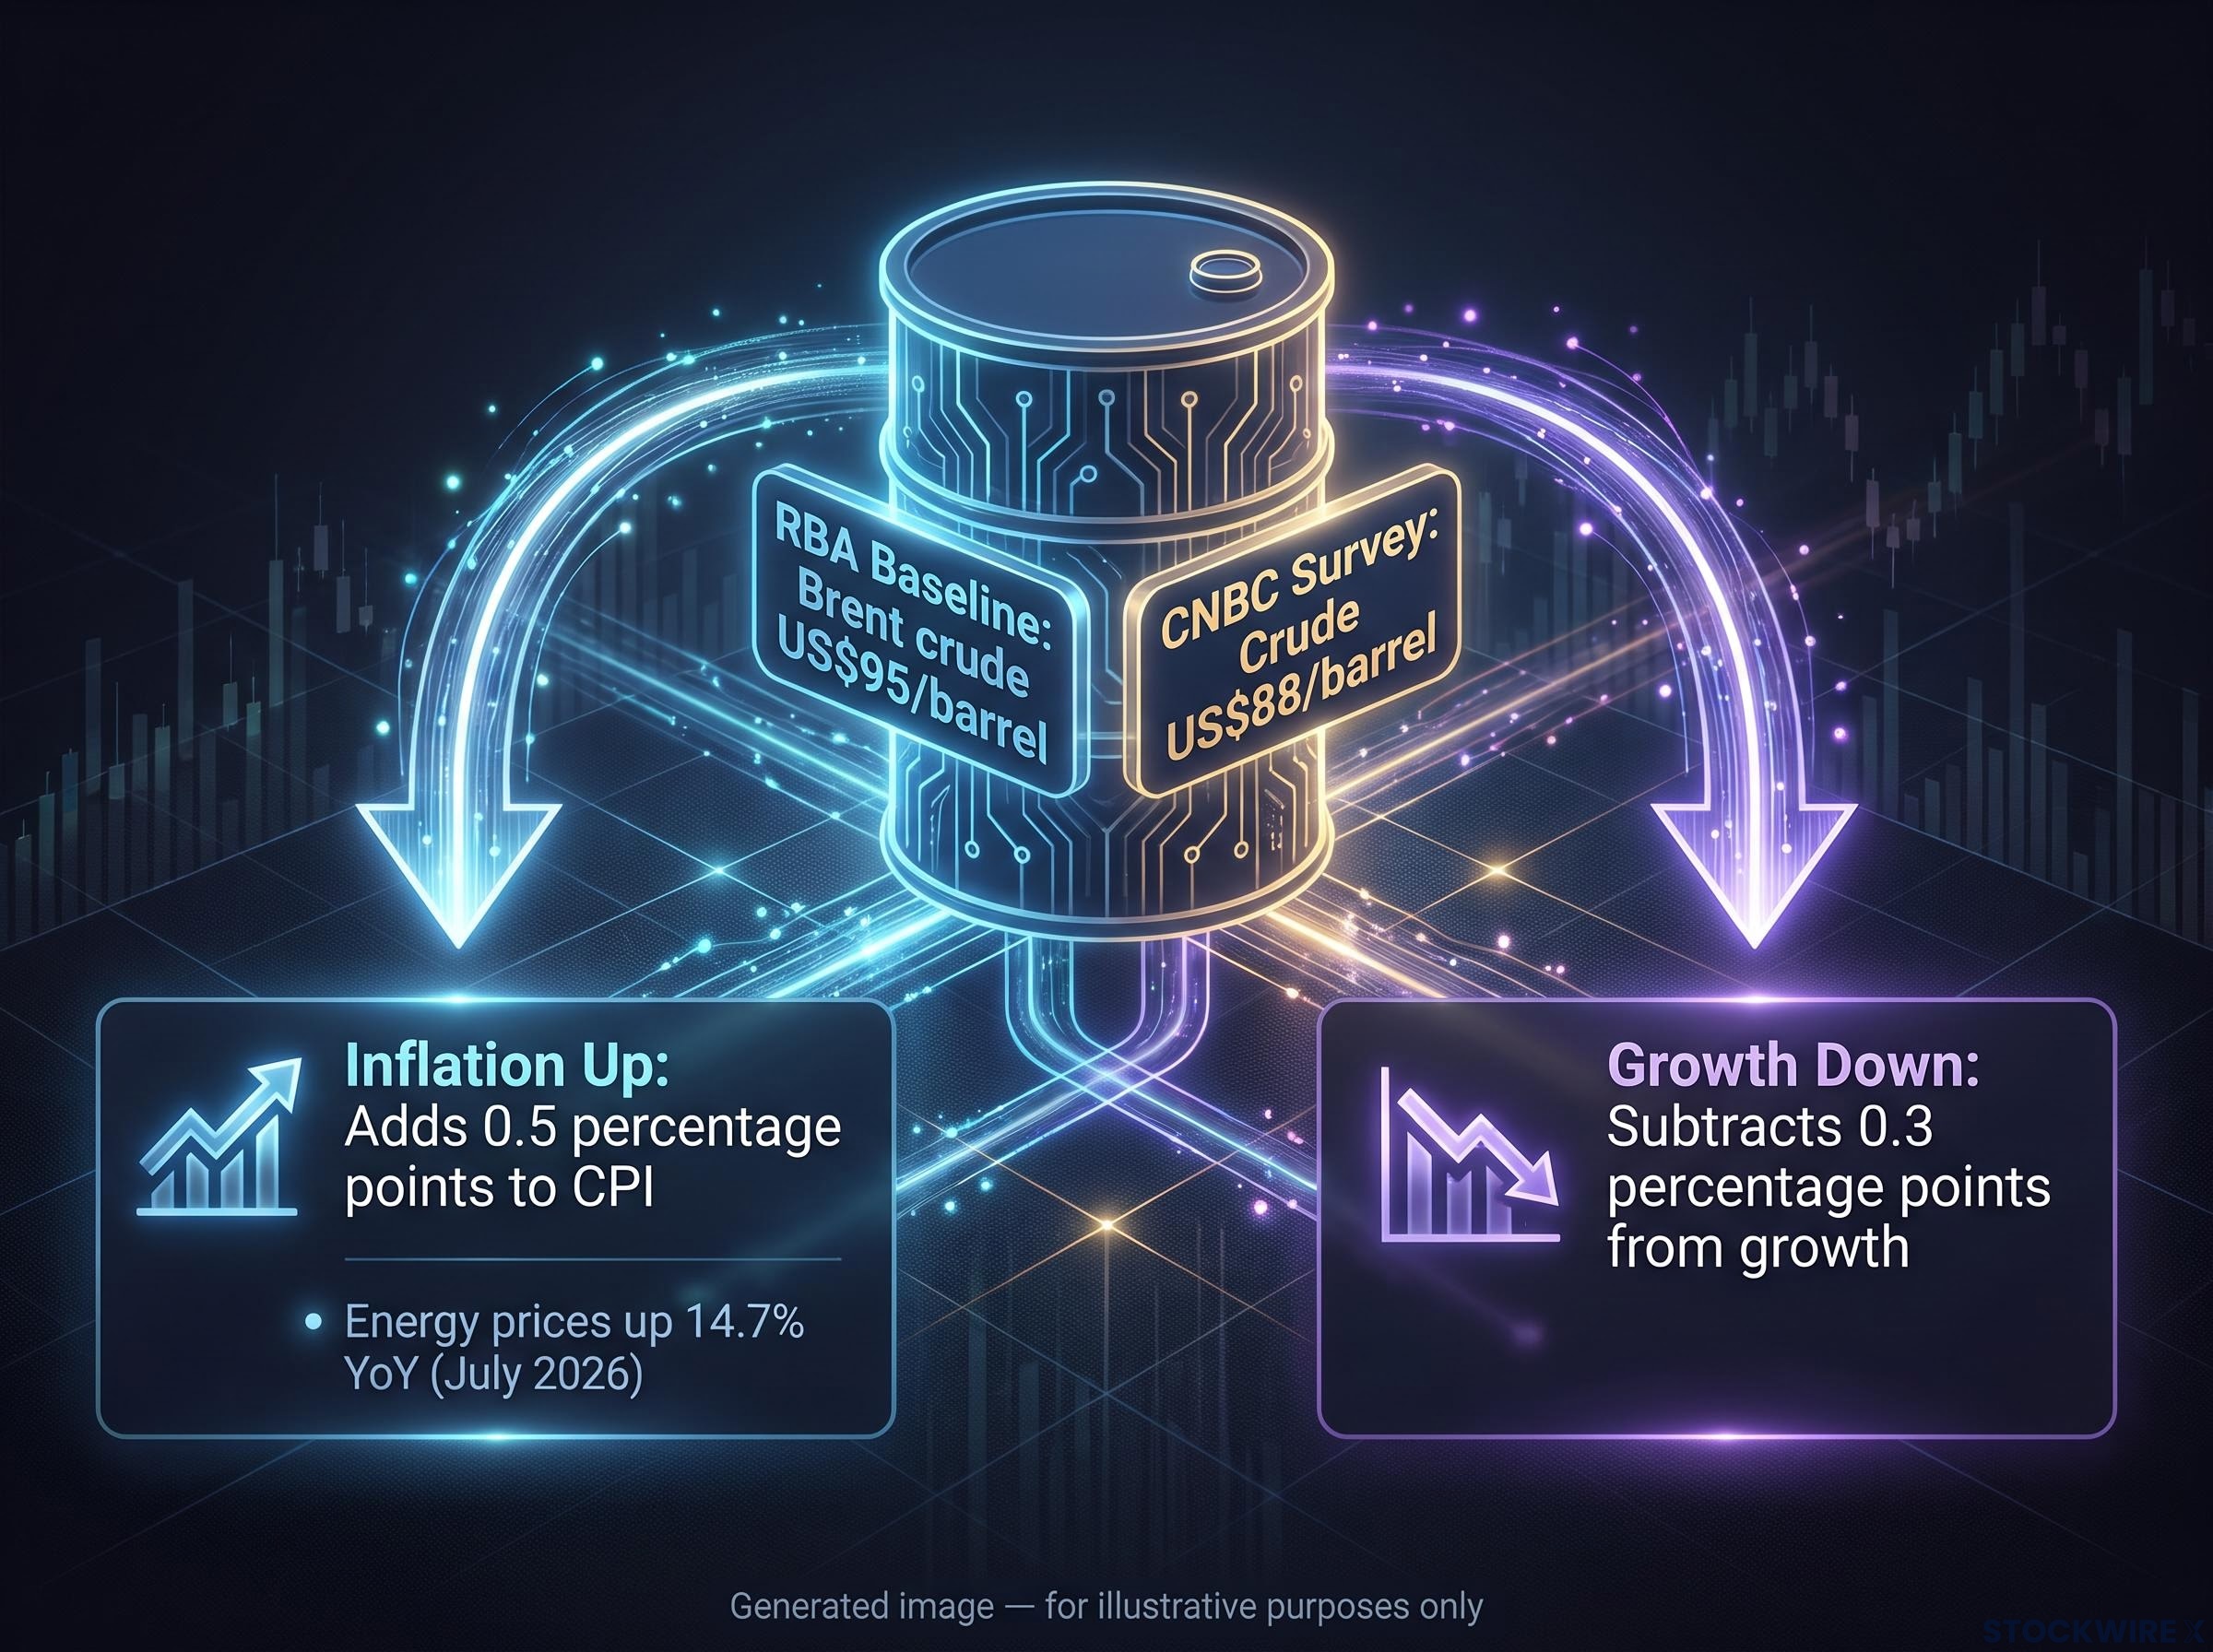
The RBA has effectively said so. Its August 2026 Statement on Monetary Policy conditions its baseline forecast on Brent crude gradually receding from around US$95 per barrel. If that assumption breaks, the inflation path breaks with it.
There is a recent precedent. On 29 April 2026, Australian headline inflation jumped to 4.6% as what The Guardian called the “Iran war fuel shock” fed through, and the probability of an immediate hike shifted from 80% to 68%.
War-driven cost pass-through into core inflation is one reason the forecaster disagreement is wider than the domestic data alone would justify; diesel prices surged approximately 50% since February 2026 compared to a 26% rise in crude futures, meaning the embedded energy cost running through logistics and imported goods is systematically understated in the headline CPI figures both banks are reading.
The US pass-through is quantified. A CNBC Fed Survey found 82% of respondents believed higher oil prices would lift core inflation, estimating that crude at roughly US$88 per barrel would add 0.5 percentage points to CPI while subtracting 0.3 percentage points from growth.
The measurable shock: At US$88 per barrel, the CNBC Fed Survey estimated oil adds 0.5 percentage points to US CPI. Energy prices were already up 14.7% year-on-year in July 2026, contributing to headline pressure.
That dual effect is precisely what makes an oil shock so awkward for a central bank:
- Inflation up: higher energy costs push headline and core measures away from target
- Growth down: the same shock acts as a tax on consumption, weakening activity
This is the thread connecting back to the forecaster disagreement. Part of why economists remain divided is not domestic data alone but this asymmetric tail risk, a shock that could force both banks into hikes they might otherwise have paused.
The read for you is direct. The oil price is the variable that can convert a near-certain hold into a forced hike at either meeting, which means watching energy markets through September carries genuine policy relevance, not just commodity interest.
What changes after September, and what stays the same regardless of the outcome
Both meetings will resolve one thing and leave a larger question wide open. The immediate rate setting will be known. The path back to target, the distance still to travel into restriction, and whether a pause becomes a cut or a hike becomes a series, none of that clears in September.
The underlying data makes the point. The RBA projects trimmed mean inflation staying above 3% until mid-2027, easing to around 2.5% by early 2028. That implies a long plateau even if September delivers a hold, and it means treating these meetings as the last decisions of the cycle would be the costly error.
Longer-horizon views complicate the near-term hawkishness further. A broader CNBC Fed Survey from March 2026 found respondents expected on average 1.8 rate cuts in 2026, with headline CPI projected to settle to 2.7% the following year. The ANZ and CBA November hike calls sit as the ready-made “next move” scenario if September produces a hold.
After the meetings: three variables that matter more than the decision itself
Once the decisions land, three signals will do more to shape the path than the September verdicts themselves.
- Underlying inflation prints. Track the trimmed mean in Australia and core PCE in the US. These are the measures each bank steers by, and they will dictate whether the plateau shortens or extends.
- Forward guidance language. Watch for shifts in tone rather than just the rate itself. A hold paired with hawkish language is a very different signal to a hold paired with a data-dependent shrug.
- Oil price trajectory. Treat energy moves as a policy proxy. Given the quantified pass-through, a sustained crude spike reads directly into the rate path.
History offers the frame. Late-cycle hikes, even when correct in isolation, have often marked or preceded inflection points for risk assets in the mid-1990s, 2004-2006, and 2022-2023, and the 2026 setup shares their key characteristics.
Whether both banks hike or hold this month, the sticky underlying data in both economies means the risk of further tightening extends well beyond September. Positioning as if the cycle ends here is the analytical mistake most likely to cost you.
This article is for informational purposes only and should not be considered financial advice. Investors should conduct their own research and consult with financial professionals before making investment decisions.
Past performance does not guarantee future results. Financial projections are subject to market conditions and various risk factors. These statements are speculative and subject to change based on market developments and central bank decisions.