A 7-to-9% single-day surge is usually the kind of move that prompts profit-taking. Yet within hours of Nvidia’s close on 27 August 2026, options traders committed roughly $3.08 million in fresh premium to stay long. That is not hedging. That is conviction, expressed in real capital, placed after the earnings catalyst has already resolved.
The catalyst itself, Nvidia’s 26 August earnings release, did exactly what the options market expected it to do: resolve uncertainty. The stock surged. Implied volatility collapsed. And in the gap between those two events, a specific set of conditions emerged that shaped how sophisticated traders structured their next bets. The same IV crush that made options cheaper in volatility terms also stripped out any possibility of profiting from a secondary volatility expansion. What remained was a pure directional market: pay premium, and hope the stock keeps moving.
Here is what you get from this piece: a mechanics-level breakdown of two real post-earnings options trades, the probability dynamics underpinning each, and what the combined positioning tells you about how sophisticated traders read Nvidia’s near-term outlook. Think of it as a case study you can apply the next time a high-conviction earnings event reshapes the options surface.
What Nvidia’s earnings report actually delivered, and what the options market priced in
The double beat was clean:
- Non-GAAP EPS: $2.22 versus a $2.09 consensus estimate
- Revenue: $96.22 billion, ahead of Wall Street expectations
- Q3 guidance: approximately $108 billion, signalling continued AI-driven demand
Nvidia closed at $227.98 on 27 August, up $18.32 (approximately 8.74%) from the prior close of $209.66. That move landed at the upper edge of what the options market had priced in ahead of the event: implied pricing suggested roughly a 6% swing in either direction, meaning the actual result slightly exceeded the expected range.
Nvidia’s Q2 fiscal 2027 earnings release confirmed non-GAAP EPS of $2.22 against a $2.09 consensus and revenue of $96.22 billion, providing the factual foundation that resolved event-risk uncertainty and triggered the IV crush described throughout this analysis.
“Implied volatility on a specific Nvidia strike fell 16% between the day before and the day of the announcement.”
That 16% drop is the IV crush in action. Implied volatility (IV) is the options market’s estimate of how much a stock will move over a given period; when a known risk event resolves, that estimate resets sharply lower because the uncertainty it was pricing has been removed. Once the earnings numbers landed, event-risk premium drained from options premiums almost immediately.
The 16% single-day drop in IV is the most consequential structural fact in this trade setup, and implied volatility mechanics explain why that reset happens so abruptly once a known risk event resolves: the market was never pricing in continued uncertainty, only the event itself.
For anyone placing a trade after the close on 27 August, this IV crush changed the calculus entirely. There was no volatility tailwind available. No secondary IV expansion to cushion a position if the stock stalled. Any options position placed in this environment was a pure directional bet: you needed the stock to move in your favour, in price terms, to make money. Over the subsequent 13 days, the implied expected move placed roughly $10.15 of further upside on the table, putting potential share price in the vicinity of $237-$238.
That context is the prerequisite for reading the two trades that followed.
When big ASX news breaks, our subscribers know first
The $230 call trade: a near-term directional bet inside the implied move range
The first trade was built for speed. Structured around a $230 strike expiring on 9 September, it carried around 13 days of runway. At the time, shares were changing hands near $228, leaving the strike sitting just over 2% above spot price and modestly out of the money. Total premium committed to the position came to around $2.8 million.
| Parameter | Value |
|---|---|
| Expiration | 9 September 2026 |
| Strike | $230 |
| Days to Expiration | ~13 |
| Distance OTM | ~2% |
| Premium Outlay | ~$2.8 million |
| Implied Volatility | ~30% |
| Implied Probability of Profit | ~1 in 3 (33%) |
The $230 strike sits inside the implied expected move range. That detail matters. The options market itself was pricing this outcome as plausible rather than extreme, meaning the trader was not betting against the market’s probability estimate but rather committing capital to the scenario the market already considered reasonably likely.
Why the $230 strike attracted this level of open interest
Heading into the session, open interest at the $230 strike had already climbed by more than 323% before fresh volume arrived. The calls themselves were marked at roughly 77% above the average price paid for them, a sign that earlier buyers were carrying meaningful unrealised gains into the day.
This creates a clustering effect. When a strike sits inside the implied move range and earlier buyers are already profitable, it becomes a focal point. New buyers join a trade that already has momentum and accumulated conviction behind it. The early entrants have a buffer; new entrants are reinforcing a thesis that has already been rewarded.
Options chain sentiment signals, including the call-to-put premium ratio and far-OTM open interest crowding, give a more granular read on directional conviction than headline volume figures alone, and the concentration of premium at specific strikes is precisely what makes the open interest build at the $230 level interpretable as a focal point rather than noise.
A 1-in-3 implied probability sounds low if you are accustomed to thinking in investing terms. For a short-dated options trade placed inside the market’s own implied move range on a stock with this kind of momentum, it represents a relatively measured risk profile. The trader is not swinging at an unlikely outcome. They are paying for the most probable directional scenario that the post-earnings surface supports.
The $250 call trade: low-probability, high-convexity exposure to an extreme upside scenario
The second trade is not a bigger version of the first. It is a structurally different instrument serving a different purpose.
| Parameter | Value |
|---|---|
| Expiration | 11 September 2026 |
| Strike | $250 |
| Days to Expiration | ~15 |
| Distance OTM | ~11% |
| Premium Outlay | ~$281,000 |
| Implied Volatility | ~36% |
| Implied Probability of Profit | ~1 in 14 (7%) |
“For Nvidia to close at $250, the stock would need to tack on a further 10% gain beyond an 8.74% post-earnings advance, all within a fortnight.”
The higher implied volatility on the $250 calls (36% versus 30% on the $230s) reflects greater uncertainty at the more extreme strike. It does not mean the $250 position is riskier in notional terms; the maximum loss is the defined $281,000 premium, full stop. But it does mean the options market is pricing a wider distribution of outcomes at that level, acknowledging just how far the stock would need to travel.
The 7% implied probability is not a red flag. It is a design feature. Convexity is the concept at work here: the idea that a position’s payoff accelerates disproportionately relative to the premium paid as the underlying moves further in the trader’s favour. If Nvidia extends sharply, fuelled by analyst upgrades, broader AI sector momentum, or macro tailwinds, the payoff on these deep out-of-the-money calls can return multiples of the premium.
The notional tells the story of intent. At $281,000 against the $2.8 million committed to the $230 calls, this is a satellite position. The trader is almost certainly already long Nvidia through stock or nearer-the-money options. The $250 calls layer on tail exposure: a defined, small-capital commitment to the scenario where everything goes better than expected.
Reading the combined signal: what these two trades reveal about post-earnings sentiment
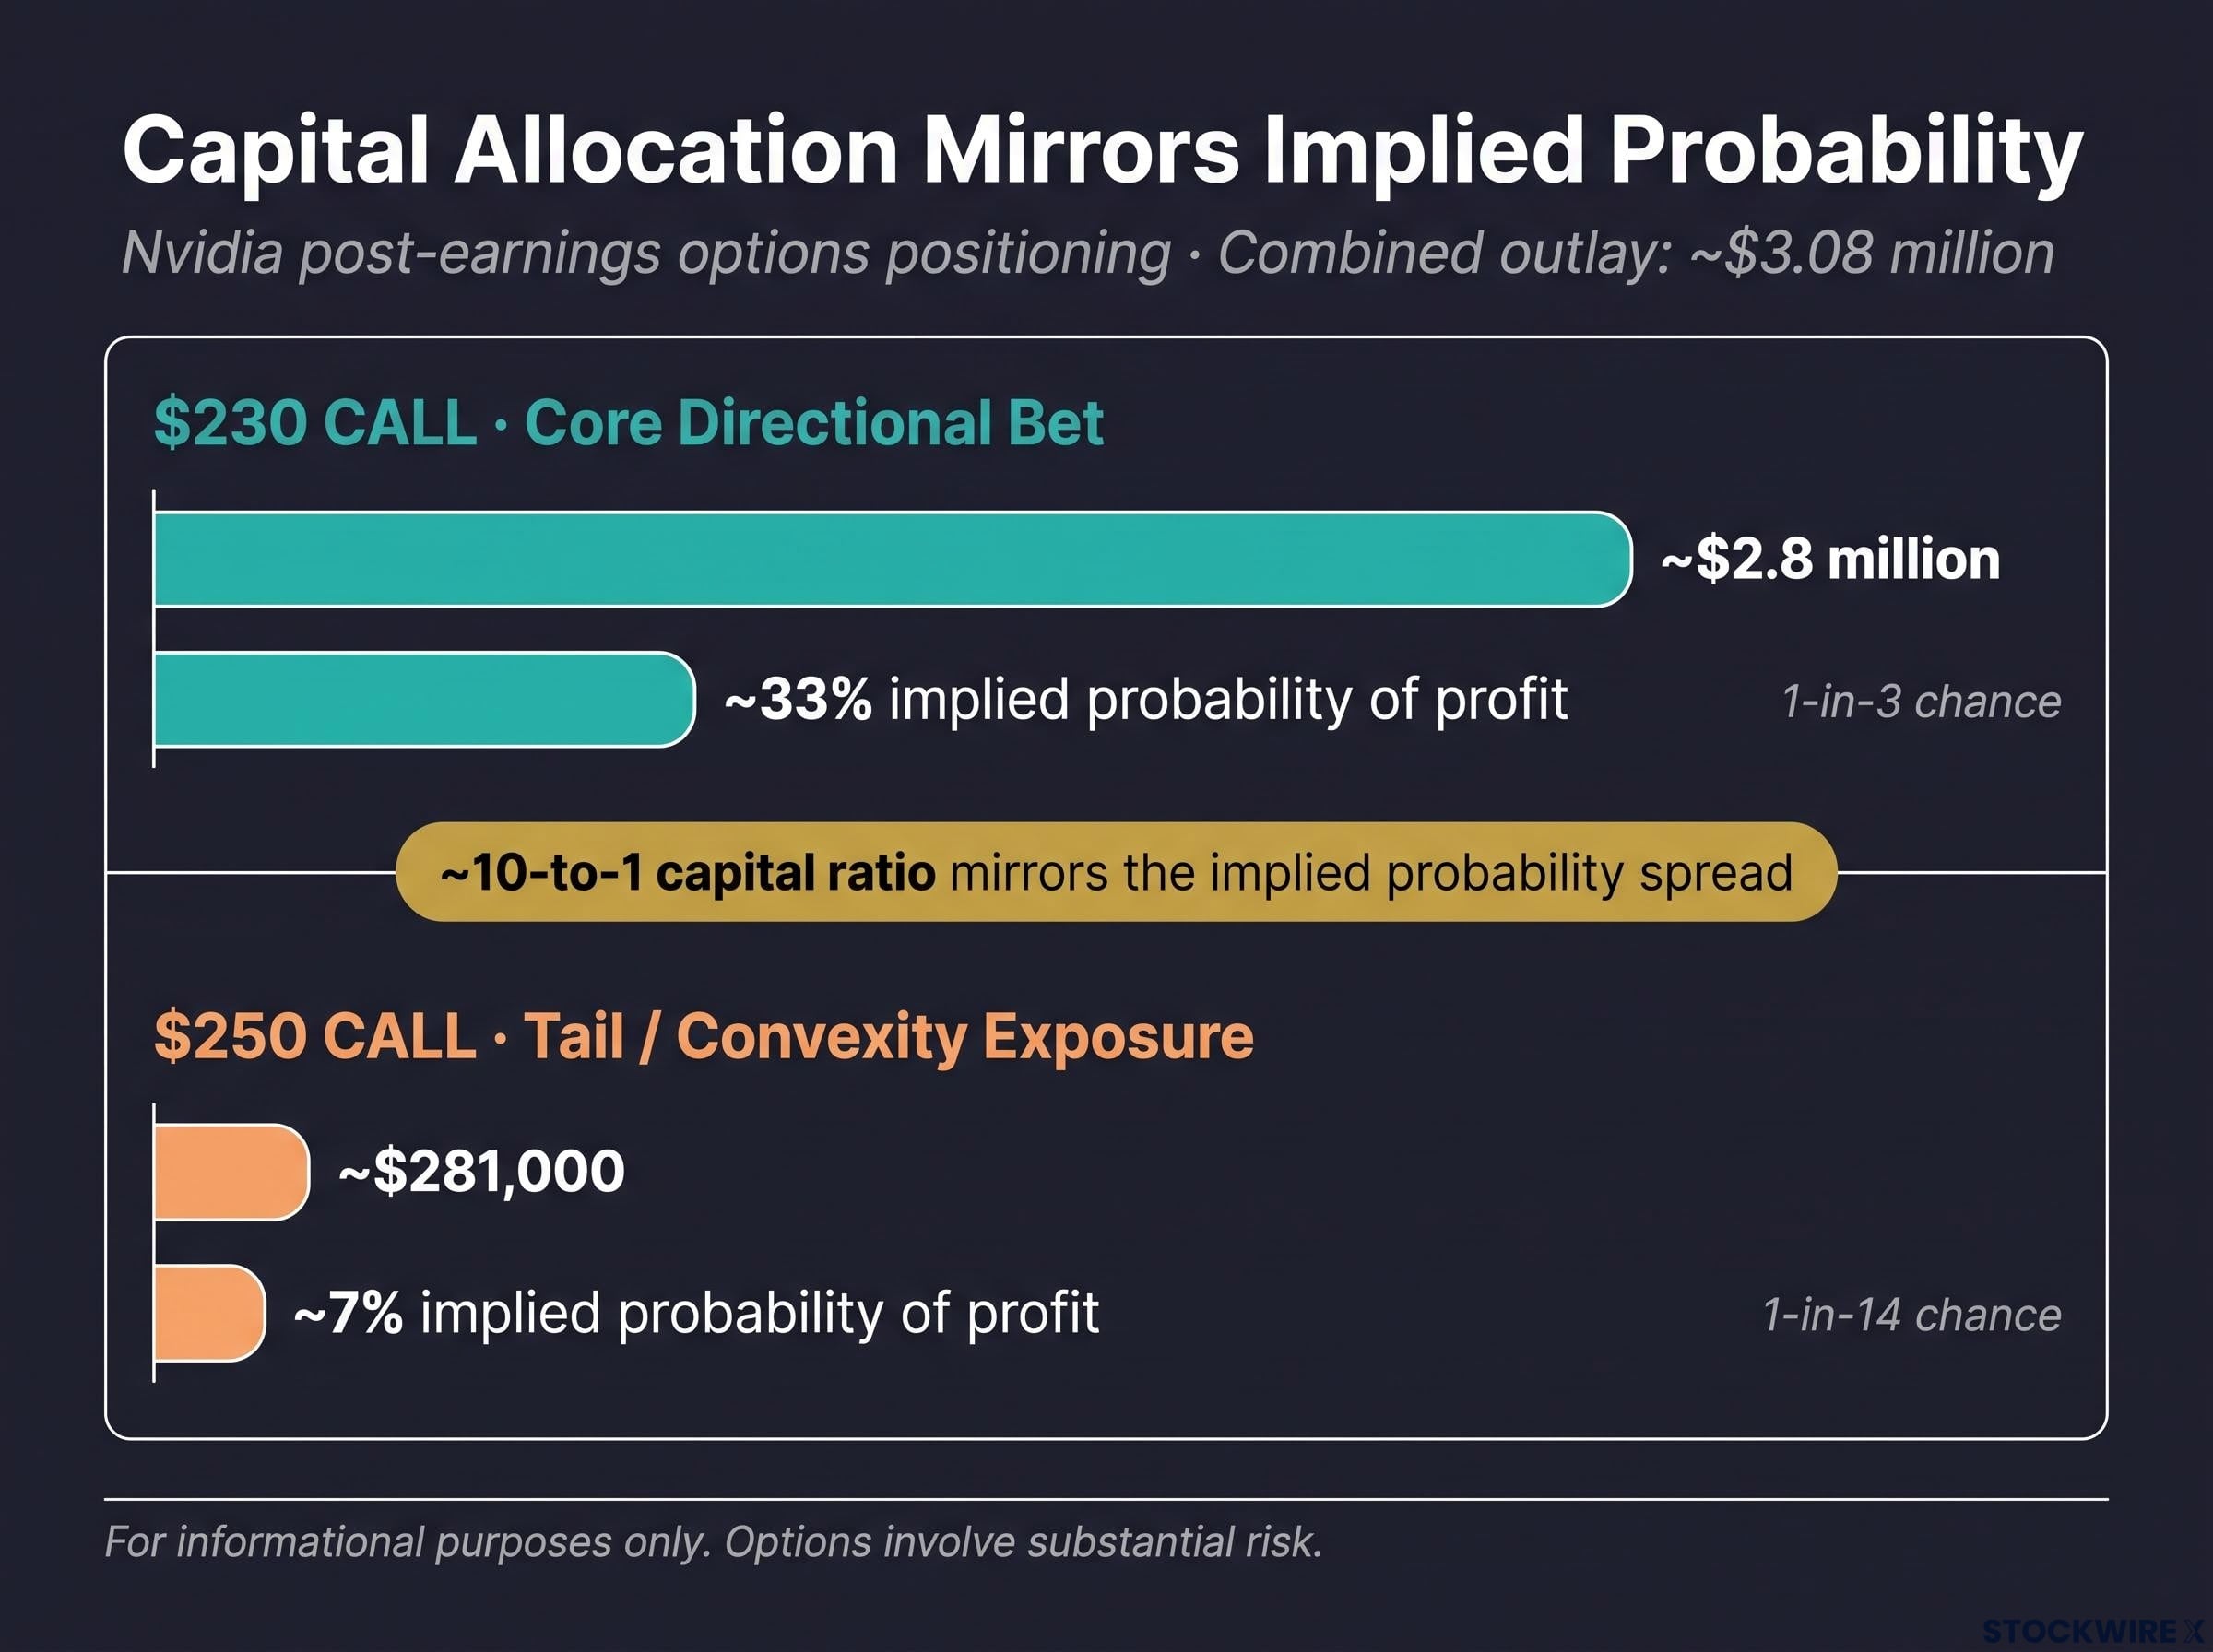
Together, these two positions outline a two-tier bullish structure. The $230 trade carries the core directional thesis: high-conviction, probability-aware, inside the market’s implied range. The $250 trade preserves exposure to an extreme upside scenario, with capital allocation scaled to the probability each outcome deserves. Combined premium outlay across both: approximately $3.08 million.
The critical structural point is that neither trade can benefit from volatility expansion. The IV crush has already occurred. Both positions require actual price appreciation to generate returns. That makes the premium commitment a clean signal. There is no embedded volatility play muddying the read. Every dollar spent is a dollar betting on Nvidia going higher.
Both trades sit on the wrong side of theta decay: as net premium buyers, the traders are losing time value each day the stock fails to reach the strike, which is precisely the structural cost of pure directional conviction in a post-IV-crush environment where selling premium is no longer viable.
What should you take from this as a market signal?
- Confidence in near-term follow-through: the $230 position, with its 33% implied probability and placement inside the implied move range, says sophisticated traders view the earnings move as the start of a trend leg, not the end of one.
- Respect for the base case with tail exposure preserved: the $250 position acknowledges the extreme scenario is unlikely but explicitly commits capital to remain exposed to it.
- Purely directional, post-IV crush positioning: both trades rely entirely on real price movement, which makes them the cleanest form of directional conviction the options market produces.
What post-earnings options flow tells you that price charts do not
A price chart shows you what happened. Options flow shows you what traders are paying to happen next, including the probability weighting they are assigning to each scenario.
The capital allocation between these two trades is itself a probability statement. Roughly $2.8 million versus $281,000 is a 10-to-1 weighting toward the base case over the tail scenario. That ratio mirrors the implied probability spread between the two strikes (33% versus 7%). The positioning is internally consistent: the money deployed matches the odds, which tells you this is probability-aware construction, not speculative overreach.
For anyone tracking Nvidia’s post-earnings trajectory, this kind of flow carries more signal weight than analyst price targets or sentiment surveys. Price targets are opinions published on a schedule. Options flow is capital committed under real risk.
What informed observers should watch as these positions move toward expiration
The expiration dates and strike levels embedded in these trades function as a short-term roadmap, drawn by traders with real capital at stake. Here are the three variables worth monitoring:
- Nvidia’s price relative to $230 heading into 9 September. This is the near-term line in the sand. Whether the stock holds above or below that strike will determine the outcome of the core directional bet, and the concentrated open interest at that level means price action around $230 is likely to be technically significant as expiration approaches.
- Catalysts capable of driving the additional 10% required for the $250 strike. The $250 calls have a slightly longer runway to 11 September but require something beyond earnings momentum to deliver. Analyst upgrades, broader AI sector developments, or macro tailwinds would all need to contribute. Without a secondary catalyst, the implied expected move of approximately $10.15 (pointing toward $237-$238) suggests the stock may stall short of that level.
AI infrastructure capex is the macro engine the $250 trade is implicitly wagering on: if the 27.1% year-over-year surge in corporate capital expenditure concentrated in AI buildout continues to accelerate demand for Nvidia’s hardware, secondary catalysts capable of pushing the stock beyond the implied expected move become structurally more plausible.
- Open interest changes at both strikes as an indicator of whether the flow is being reinforced or unwound. If open interest at the $230 or $250 strikes grows in the days ahead, the bullish signal is being reinforced. If positions are closed or rolled to different strikes, the directional thesis is being updated, and the signal changes accordingly.
“Implied probabilities derived from option prices are estimates, not certainties, and actual outcomes can diverge materially from what the market is pricing.”
Options involve substantial risk and are not suitable for all investors. The positions described here represent sophisticated, probability-driven strategies by active traders, not recommendations.
This article is for informational purposes only and should not be considered financial advice. Investors should conduct their own research and consult with financial professionals before making investment decisions.
Two strikes, two probability tiers, one coherent bullish thesis
These two trades are not independent bets. They are complementary expressions of a single directional view, scaled to the probability each outcome deserves. The $230 calls carry the weight of conviction. The $250 calls carry the weight of possibility. Together, they describe a market participant who believes the earnings catalyst was a beginning, not an ending.
The IV crush is the structural context that makes both trades legible. With event-risk premium gone, these are clean, post-event directional positions. They tell you that sophisticated capital is willing to stay long Nvidia even after the primary catalyst has resolved, paying for time and price movement rather than mispriced volatility.
The framework itself is replicable: near-the-money calls for core exposure, deep out-of-the-money calls for tail exposure, capital allocation weighted to the probability each scenario deserves. The next time a high-conviction earnings event reshapes an options surface, this is the structure to watch for.